Huang
etal. acta neuropathol commun (2020) 8:219
https://doi.org/10.1186/s40478-020-01092-4
RESEARCH
Eects ofH3.3G34V mutation ongenomic
H3K36 andH3K27 methylation patterns
inisogenic pediatric glioma cells
Tina Yi‑Ting Huang
1
, Andrea Piunti
2
, Jin Qi
1
, Marc Morgan
2
, Elizabeth Bartom
2
, Ali Shilatifard
2
and Amanda M. Saratsis
1,2,3*
Abstract
Histone H3.3 mutation (H3F3A) occurs in 50% of cortical pediatric high‑grade gliomas. This mutation replaces glycine
34 with arginine or valine (G34R/V), impairing SETD2 activity (H3K36‑specific trimethyltransferase). Consequently,
reduced H3K36me3 is observed on H3.3G34V nucleosomes relative to wild‑type, contributing to genomic instabil‑
ity and driving a distinct gene expression signature associated with tumorigenesis. However, it is not known if this
differential H3K36me3 enrichment is due to H3.3G34V mutant protein alone. Therefore, we set to elucidate the effect
of H3.3G34V mutant protein in pediatric glioma on H3K36me3, H3K27me3 and H3.3 enrichment in vitro. We found
that the doxycycline‑inducible shRNA knockdown of mutant H3F3A encoding the H3.3G34V protein resulted in loss
of H3.3G34V enrichment and increased H3K36me3 enrichment throughout the genome. After knockdown, H3.3G34V
enrichment was preserved at loci observed to have the greatest H3.3G34V and H3K36me3 enrichment prior to
knockdown. Induced expression of mutant H3.3G34V protein in vitro was insufficient to induce genomic H3K36me3
enrichment patterns observed in H3.3G34V mutant glioma cells. We also observed strong co‑enrichment of H3.3G34V
and wild‑type H3.3 protein, as well as greater H3K27me3 enrichment, in cells expressing H3.3G34V. Taken together,
our study demonstrates the effects of H3.3G34V mutant protein on genomic H3K36me3, H3K27me3 and H3.3 enrich‑
ment patterns in isogenic cell lines.
Keywords: Pediatric high‑grade glioma, Post‑translational modifications, H3K36me3, Histone H3 mutations
© The Author(s) 2020. This article is licensed under a Creative Commons Attribution 4.0 International License, which permits use, sharing,
adaptation, distribution and reproduction in any medium or format, as long as you give appropriate credit to the original author(s) and
the source, provide a link to the Creative Commons licence, and indicate if changes were made. The images or other third party material
in this article are included in the article’s Creative Commons licence, unless indicated otherwise in a credit line to the material. If material
is not included in the article’s Creative Commons licence and your intended use is not permitted by statutory regulation or exceeds
the permitted use, you will need to obtain permission directly from the copyright holder. To view a copy of this licence, visit http://crea‑
tivecommons.org/licenses/by/4.0/. The Creative Commons Public Domain Dedication waiver (http://creativecommons.org/publicdo‑
main/zero/1.0/) applies to the data made available in this article, unless otherwise stated in a credit line to the data.
Introduction
Pediatric high-grade glioma (pHGG) is the number one
cause of cancer death in children, with a 5-year survival
of less than 20%. is dismal prognosis is in large part
due to an historical lack of understanding of its distinct
biology and the presumption that pHGG is biologically
identical to its adult counterpart, resulting in ineffective
treatment. However, with the development of next-gen
-
eration sequencing technologies to analyze rare tumor
specimens, knowledge of pHGG biology significantly
increased over the past decade. Somatic missense muta
-
tions in genes encoding Histone H3 isoforms, including
H3F3A, HIST1H3B and HIST1H3C, were subsequently
identified in up to 50% of supratentorial hemispheric
pHGG, and 80% of pediatric diffuse midline gliomas
(DMG), a form of pHGG in the thalamus or brainstem
[11, 15, 20]. ese mutations are associated with distinct
tumor biology and poorer clinical outcome, and are now
understood to play a role in pediatric gliomagenesis. As a
result, determining the effects of these mutations on his
-
tone H3 function and regulation of gene transcription, in
order to identify more effective therapeutic targets, is of
great interest.
Open Access
*Correspondence: [email protected]g
3
Division of Pediatric Neurosurgery, Department of Surgery, Ann &
Robert H. Lurie Children’s Hospital of Chicago, 225 E Chicago Avenue,
Box 28, Chicago, IL 60611‑2991, USA
Full list of author information is available at the end of the article
Page 2 of 13
Huangetal. acta neuropathol commun (2020) 8:219
In hemispheric pHGG, somatic mutations of H3F3A
(GGG to GTG) result in a glycine 34 to arginine (G34R)
or valine (G34V) substitution on the histone H3.3 N-ter
-
minal tail, while H3F3A mutations in DMG result in
lysine to methionine alterations (K27M or K36M). Sev
-
eral studies have focused on the effects of these muta-
tions on global methylation, chromatin structure, and
transcription regulation to promote tumorigenesis. For
example, mutant H3.3K27M protein exhibits higher
affinity for EZH2, a H3K27-specific lysine methyltrans
-
ferase, compared to wildtype H3.3, resulting in EZH2
sequestration and preventing PRC2 from propagating
transcriptionally repressive H3K27 methylation [14].
Mutant H3.3K36M protein inhibits H3K36-specific
lysine methyltransferases, including NSD1, NSD2, and
SETD2, reducing global H3K36 methylation [3, 12, 21].
In contrast, less is known about the epigenetic and tumo
-
rigenic effects of H3.3G34V/R mutations in pHGG. Sev-
eral studies comparing H3.3G34V mutant and wild type
cell lines suggest distinct epigenetic changes at H3K27
and H3K36 in association with H3.3G34V/R mutation,
as well as alteration to DNA repair pathways leading
to transcriptional upregulation, increased mutational
burden and genomic instability [2, 10, 16]. However, as
these studies did not use isogenic cell lines, the distinct
mechanism by which H3.3G34V/R mutation exerts the
observed changes is not clear. erefore, we set to better
elucidate the direct epigenetic effects of H3.3G34V muta
-
tion in pediatric glioma invitro using isogenic cell lines.
Here, we demonstrate changes in genomic enrichment of
multiple chromatin marks after DOX-inducible knock
-
down of H3F3A in an H3.3G34V mutant pediatric glioma
cell line, and H3.3G34V mutation transduction in wild-
type astrocytes, providing insight on epigenetic effects of
this mutation that promote tumorigenesis.
Materials andmethods
Cell lines andculture conditions
Experiments were conducted using an established
H3.3G34V mutant patient-derived pediatric high-grade
glioma cell line (KNS42), and Histone H3.3 wild-type
human astrocytes (NHAs, ScienCell #1800). KNS42 was
obtained from Rintaro Hashizume (Northwestern Uni
-
versity), it is well characterized as previously described
[6]. KNS42 cells were maintained in EMEM (10009CV,
Corning) with 5% FBS (16000-044, Gibco). NHA cells
were maintained in high glucose DMEM (11995-065,
Gibco) and 10% FBS, according to the cell line provider’s
recommendation. Cells were grown in an incubator with
5% CO
2
at 37 °C. All experiments were conducted in
accordance to institutional protocols and approvals (NU
IRB# STU00202063).
H3.3G34V mutation induction andknock‑down
Lentiviral delivery of a doxycycline-inducible RNAi
vector targeted against H3F3A was transduced to
KNS42 cells to knock down H3.3G34V protein expres
-
sion. e vector contains the selectable markers of
puromycin as well as a red fluorescent protein (RFP)
reporter. Lentiviral vector-mediated doxycycline-
inducible cDNA encoding a c.104G > T p.(Gly34Val)
H3F3A mutation was transduced to NHAs in order to
express H3.3G34V mutant protein. is vector, pUC57-
Kan, contained a kanamycin resistant gene. A vector
containing doxycycline-inducible H3F3A for wild-type
H3.3 protein expression was used as negative control.
All vectors were purchased from Genscript. A total of
250,000 cells from each cell line were transduced with
lentivirus for 6h, rinsed in PBS, then cultured in their
respective media as described above. A second round of
lentiviral transduction was performed 24h later. After
an additional 24h, antibiotics were added at 2µg/mL.
Cells were then cultured in their respective media for
three to 5days to achieve desired confluency. For dox
-
ycycline-induced transduction conditions, doxycycline
was added at 1:5000 every other day for 1week (days
one, three, five, seven), and on day eight cells were col
-
lected as a pellet for Western Blotting to confirm pro-
tein expressions, or crosslinked with 1% formaldehyde
for ChIP-Seq (see below). Cells without doxycycline
treatments were cultured and collected in parallel. Flu
-
orescent imaging and flow cytometry were performed
to select for cells with successful protein knockdown or
transduced expression.
Western blotting
Protein was extracted from cells using RIPA buffer
(89900, ermo Fisher Scientific). A total of 60 µg of
protein (from whole cell extract) was separated by elec
-
trophoresis in a 4–15% precast protein gel (4561086, Bio-
Rad) and transferred to PVDF membranes. Blocking was
subsequently performed with 5% non-fat milk in TBST,
followed by incubation with anti-H3K27Ac antibody at
1:500 dilution (8173S, Cell Signaling Technology) over
-
night. After 5 washes with TBST, membranes were incu-
bated with HRP-conjugated anti-Rabbit IgG antibody at
1:1000 (7074 Cell Signaling Technology) for 1h. Pierce
ECL Plus (32132, ermo Fisher Scientific) was used to
detect protein bands. Blots were then stripped (46430,
ermo Fisher Scientific) and re-probed with anti-total
H3 primary antibody at 1:1000 dilution (14269S, Cell
Signaling Technology) as a loading control. HRP-con
-
jugated anti-Mouse IgG antibody (7076, Cell Signaling
Technology) was used to detect total H3 signal. Densi
-
tometry analysis was performed with image J.

Page 3 of 13
Huangetal. acta neuropathol commun (2020) 8:219
Cell proliferation assay
Cell proliferation was measured by counting viable cells
using the TC20 Automated Cell Counter (Bio-Rad).
3 × 10
5
cells were seeded in cell culture dishes. At 3 and
7 days after seeding, cells were harvested, dissociated
into single cell suspension, and stained with 0.4% Trypan
Blue Solution (15250061, ermoFisher) for 5min before
counting.
Cell viability assay
Cell viability was assessed using the CellTiter-Glo Lumi-
nescent Assay (G7570, Promega). 3000 cells were seeded
in 96-well plate. Measurements were taken 1, 3, 5, and 7
days after seeding. Reagent was diluted at 1:1 ratio with
PBS to achieve optimal luminescent range. 100µL rea
-
gent was added to cells in 100µL media. e mix was
incubated for 10min at room temperature with gentle
shaking, followed by luminescent measurement.
Cell crosslinking andchromatin immunoprecipitation
For each immunoprecipitation, 30 million cells were
crosslinked using freshly prepared 1% formaldehyde in
complete cell medium for 10min at RT, and subsequently
quenched with 0.125M glycine for 5min. e cells were
then rinsed twice in cold PBS, gently scraped from the
plates and centrifuged in a 15mL tube (Falcon) at 1350×g
for 8min at 4 °C. Crosslinked cells were either stored
in − 80 °C or used immediately for chromatin immu
-
noprecipitation, as previously described [14]. Briefly,
crosslinked cells were resuspended in 10mL buffer 1 for
10min at 4°C then centrifuged at 1350×g for 5min at
4°C. Pellet was resuspended in 10mL buffer 2 for 10min
at RT then centrifuged at 1350×g for 5min at 4°C. Pellet
was resuspended 1mL buffer 3 and transferred to a 1mL
milliTUBE (520135, Covaris). Sonication was performed
using the Covaris E220 ultrasonicator with the following
parameters: 20% duty cycle, 175 PIP, 200 cycles/burst,
for 8 min. After sonication, sample was centrifuged at
20,000×g for 15min at 4°C and supernatant containing
chromatin was collected. 50 µL of chromain were de-
crosslinked with elution buffer for 3h at 65°C and DNA
was extracted using PCR purification kit (28104, Qiagen).
Purified DNA were loaded in a 1.5% agarose gel to check
for the fragment size (average range 200–500bp). A total
of 100µL ChIP dilution buffer was added to the remain
-
ing sheared chromatin. A total of 10µL of each sample
was saved at 4°C to serve as input. e remaining chro
-
matin was incubated with primary antibody on a nutator
overnight at 4°C (refer to Table1 for a list and dilution of
antibodies used). e following day, 60µL of 50% protein
A/G agarose beads (sc-2003, Santa Cruz Biotech) were
added to the samples and incubated for 3h on a nutator
at 4°C. Agarose beads were pelleted by centrifugation at
2500×g for 1min and washed with 1mL of RIPA buffer
four times followed by 1mL of 50mM NaCl in TE. e
beads and the 10µL input sample were resuspended in
200µL elution buffer for 30min at 65°C then centrifuged
for 2min at 15,000×g. Supernatant was transferred into a
new 1.6mL tube and de-crosslinked overnight 65°C. e
following day, DNA was extracted with PCR purification
kit (28104, Qiagen), and eluted to a final volume of 60µL.
A total of 45µL of each sample and input were used for
library preparation and subsequent sequencing steps. All
additional reagents (Elution buffers 1, 2, 3, Elution buffer,
10× ChIP dilution buffer, RIPA buffer, and elution buffer)
were prepared as previously described [14].
Library Preparation andNext‑Generation Sequencing
ChIP-Seq libraries were prepared with the KAPA Library
preparation kit (KK8234, Kapa Biosystems) and NETflex
DNA barcodes (514104, Bioo Scientific). A total of 10µg
DNA was used as starting material for input and immu
-
noprecipitation samples. Libraries were amplified with a
thermocycler for 13 cycles. Post-amplification libraries
were size-selected at 250-45bp in length using the Agen
-
court AMPure XP beads (A63881, Beckman Coulter).
Libraries were validated using the Agilent High Sensi
-
tivity DNA Analysis Kit (5067-4626). ChIP-Seq libraries
were single-read sequenced on the Illumina NextSeq500
Sequencing System.
ChIP‑Seq data analysis
Reads were filtered using the FASTX-Toolkit suite and
read quality was assessed with FastQC v0.11.5. After
removal of duplicated reads, unique reads were mapped
to human reference genome Hg38. ChIP-Seq reads were
aligned with the ENCODE pipeline. Peaks were called
with MACS2 v2.1.0 software with cutoff of p < 0.01.
Enrichment values were determined as log2(Normalized
experimental read count—normalized input read count)
Table 1 List ofantibodies used
*We would like the table to be inserted following the section “Cell Crosslinking
and Chromatin Immunoprecipitation” of Materials and Methods
Antibody Company Catalog # ChIP WB
H3.3WT Millipore 09‑838 10 µg 1:1000
K36me3 Homemade na 30 µL 1:1000
G34V RevMAb 31‑1193‑00 10 µg 1:1000
K27me3 Homemade na 30 µL na
Total H3 CST 14,269 na 1:1000
Anti‑Rabbit IgG, HRP CST 7074 na 1:5000
Anti‑Mouse IgG, HRP CST 7076 na 1:5000

Page 4 of 13
Huangetal. acta neuropathol commun (2020) 8:219
in regions of interest in each ChIP specimen and cor-
responding input sample. Called peaks were annotated
with HOMER v4.10 to the nearest gene. Active enhanc
-
ers were defined as H3K27ac peaks excluded from the
transcription start site (TSS) (2.5kb upstream and down
-
stream). ChIP-Seq reads density and data visualizations
were generated using Deeptools v3.1.1. Additional func
-
tional pathways and upstream regulator analysis was
performed on differentially enriched loci using Ingenuity
Pathways Analysis software (Qiagen, Germantown MD).
Results
Lentiviral induced knockdown andexpression ofH3.3G34V
To characterize the epigenetic effects of H3.3G34V
mutant protein in pediatric glioma, we compared global
methylation and Histone H3 enrichment patterns in
isogenic cell lines. We used doxycycline-induced lenti
-
viral delivery of genetic constructs designed to silence
(shRNA) or express (cDNA) mutant and wild-type
H3F3A in H3.3G34V mutant glioma cells (KNS42),
and H3 wild type astrocytes (NHA). Using fluorescent
imaging, we measured lentiviral RFP expression after
DOX-induction to confirm vector expression (Fig. 1a).
Western blot analysis of whole-cell extracts confirmed
successful knockdown of H3.3G34V mutant protein in
glioma cells treated with doxycycline, compared to those
not treated with doxycycline and those transduced with
H3F3A for wild-type H3.3 expression, with no significant
reduction in H3K36 trimethylation across conditions
(Fig.1b). In turn, we observed DOX-induced expression
of H3.3G34V mutant protein in cDNA transduced astro
-
cytes, with no mutant protein detected in untreated cells,
or in cells transduced with H3F3A (Fig. 1c). While we
achieved significant overexpression of H3.3G34V mutant
protein in astrocytes compared to control, the maxi
-
mum level of mutant protein we could express in astro-
cytes is only 28.9% of the level observed in H3.3G34V
mutant glioma KNS42 (Additional file 1: Figure S1A,
B). Flow cytometry was used to select the top 30% cells
with successful H3.3G34V knockdown and knock-in, for
subsequent ChIP-Seq (Fig.1d). We did not observe sig
-
nificant difference in cell viability (Additional file1: Fig-
ure S1C) or proliferation (Additional file1: Figure S1D, E)
between KNS42 with and without doxycycline-induced
H3.3G34 knockdown, nor between NHA overexpressed
with H3.3G34V and H3.3 control. On ChIP-Seq analysis,
we observed decreased H3.3G34V enrichment at H3F3A
in KNS42 glioma cells after DOX-induced transduc
-
tion of H3F3A shRNA, relative to KNS42 cells that were
transduced without DOX induction, or not transduced
(Fig. 1e). We also confirmed enrichment of H3.3G34V
mutant protein at H3F3A in DOX-induced astrocytes,
with no mutant protein in untreated NHAs or those
transduced with wild-type H3F3A cDNA (Fig.1e). Out
-
side of H3F3A, metagene plots of H3.3G34V enrichment
within the gene body for the top 1000 most H3.3G34V-
enriched genes demonstrated reduction, but not com
-
plete elimination, of H3.3G34V deposition in KNS42
with DOX-induced knockdown compared to KNS42
cells that were transduced but without DOX induction.
Higher H3.3G34V enrichment is also observed in NHAs
transduced for H3.3G34V expression, compared to
NHAs with only wild-type H3.3 expression (Fig.1f).
H3.3G34V Co‑enriches withWild‑type H3.3
Overall, we observed greater H3.3 enrichment in cells
expressing H3.3G34V mutant protein. Specifically, we
identified 270,656 wild-type H3.3 peaks in glioma cells
after H3.3G34V knockdown (6628 promoter, 144,735
gene body), and significantly fewer H3.3 peaks in KNS42
glioma cells with intact H3.3G34V expression (164,785
total, 4071 promoter, 87,770 gene body, Fig. 2a). e
same trend was observed in astrocytes induced to
express H3.3G34V (77,018 total peaks, 2019 promoter,
40,530 gene body) compared to controls (15,9235 total
peaks, 3952 promoter, 84,746 in gene body, Fig.2a). At
genes previously reported to have greater WT H3.3
enrichment in H3,3G34V mutant tumors compared to
WT, manipulation of H3.3G34V mutant protein expres
-
sion had no effect on WT H3.3 enrichment (Fig.2b). To
further determine the effect of H3.3G34V expression on
genomic enrichment of WT and mutant H3.3, we identi
-
fied the top 10,000 loci most-enriched for H3.3G34V in
transduced KNS42 cells without DOX induction (nega
-
tive control), and compared H3.3G34V and WT H3.3
enrichment at these loci across experimental conditions.
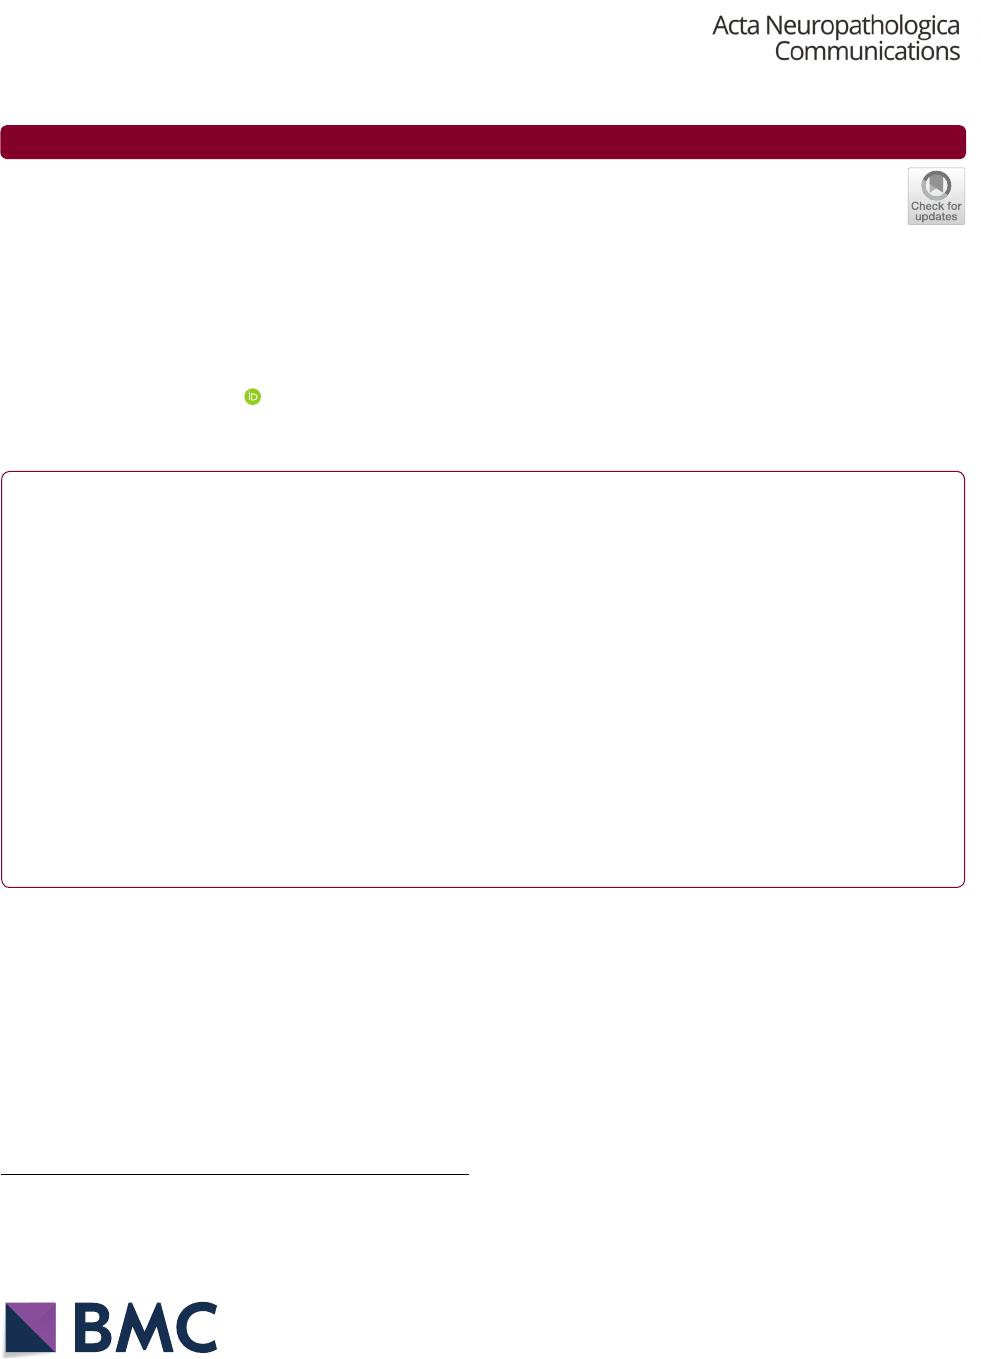
Fig. 1 Genetic Modification of Histone H3.3 expression in Pediatric Glioma Cells and Astrocytes. a Expression of RFP reporter was confirmed in
> 95% of Doxycycline‑induced cells. b H3.3G34V expression was significantly reduced in lentiviral‑transduced KNS42 cells treated with Doxycycline,
compared to no Doxycycline and control conditions. **p < 0.01, ****p < 0.0001. c H3.3G34V protein was expressed in lentiviral‑transduced NHAs
treated with doxycycline, with no H3.3G34V expression observed in controls. d Flow cytometry was used to select the top 30% cells with H3.3G34V
knockdown and knock‑in for subsequent ChIP‑Seq analysis. e Genome browser view of H3.3G34V enrichment at the H3F3A locus across cell lines
studied. Tracks highlighted in red are those conditions without H3.3G34V expression. f Metagene profile of H3.3G34V enrichment in the gene body
across the top 1000 most H3.3G34V‑enriched genes in KNS42. Reduction of H3.3G34V enrichment is observed following doxycycline‑induced
knockdown (light blue versus navy blue lines). Greater H3.3G34V enrichment is also observed in NHA transduced for H3.3G34V expression (green
line) compared to control transduced for H3.3WT expression (orange line)
(See figure on next page.)
Page 5 of 13
Huangetal. acta neuropathol commun (2020) 8:219
a
b c
d
e
f

Page 6 of 13
Huangetal. acta neuropathol commun (2020) 8:219
a
b
c
d
e
Fig. 2 H3.3G34V Co‑enriches With Wild‑type H3.3. a Relative proportion of H3.3WT enrichment across gene elements with H3.3G34V expression
or knock‑down. b H3.3 enrichment at SOX2 was greatest KNS42 cell s expressing H3.3G34V, compared to NHAs lacking H3.3G34V expression (red
highlight) or after H3.3G34V transduction. c, d Co‑enrichment of H3.3G34V and H3.3WT was observed across experimental conditions at the top
10,000 loci most‑enriched for C) H3.3G34V, and D) H3.3WT in transduced KNS42 cells without DOX induction. e When the top 10,000 loci most
enriched for H3.3G34V, H3.3 wild‑type, H3K36me3 and H3K27me3 in transduced KNS42 cells without DOX induction are compared, greatest overlap
is observed between H3.3G34V and wild‑type H3.3 enrichments patterns, with 3041 common loci between these two groups

Page 7 of 13
Huangetal. acta neuropathol commun (2020) 8:219
We detected co-enrichment of H3.3G34V and WT H3.3
in all glioma cell treatment conditions at these 10,000 loci
most enriched for H3.3G34V (Fig.2c), as well as at the
10,000 loci most enriched for WT H3.3 (Fig.2d). When
these loci are mapped to the nearest gene, H3.3G34V and
WT H3.3 enriched loci have the most overlap, with 3041
shared loci between groups (Fig. 2e). Taken together,
these data suggest that glioma H3.3G34V expression is
associated with increased WT H3.3 enrichment through
-
out the genome, that WT H3.3 and H3.3G34V strongly
co-enrich, and that loci most enriched by these proteins
do not significantly change with H3.3G34V knockdown.
H3.3G34V does notaect global H3K36me3 enrichment
levels
Next, we set to determine the effects of H3.3G34V expres-
sion on patterns of genomic H3K36me3 enrichment.
Consistent with previous studies [17], H3.3G34V knock
-
down in glioma cells did not result in significant change in
the level of global H3K36me3 enrichment across all gene
elements evaluated, with a total of 354,857 K36me3 peaks
after H3.3G34V knockdown (7187 promoter, 202,284
gene body), compared to 254,315 H3K36me3 peaks cells
in KNS42 cells with intact H3.3G34V expression (5193
promoter, 145,856 gene body, Fig.3a). Similarly, we did
not observe a significant difference in the number of
H3K36me3 peaks in astrocytes after H3.3G34V knock-in
compared to WT cells (Fig.3a).
In H3.3G34V mutant KNS42 cells, we observed no
difference in H3K36me3 enrichment with or without
DOX-induced H3.3G34V knockdown, at neither the
1000 most H3K36me3 enriched loci, nor at the 1000
most H3.3G34V enriched loci (Fig. 3c, top left and
top right panels). Additionally, we not observe any dif
-
ference in H3K36me3 enrichment in NHAs, with or
without induced H3.3G34V expression. It is possible
that H3.3G34V knockdown in KNS42 did not occur
at loci with highest H3.3G34V enrichment, nor at
loci with highest H3K36me3 enrichment. To test this
hypothesis, we examined the loci with highest differ
-
ence in H3.3G34V and H3K36me3 enrichment, with
and without DOX-induced H3.3G34V knockdown. At
the 1000 loci with the greatest difference in H3.3G34V
enrichment between no DOX and DOX-induced
H3.3G34V knockdown conditions, we also saw no dif
-
ference in H3K36me3 enrichment (Fig.3c, bottom left
panel). Interestingly, at the 1000 loci with the greatest
difference in H3K36me3 enrichment with versus with
-
out H3.3G34V knockdown, we observed much greater
H3K36me3 enrichment with H3.3G34V knockdown
compared to no DOX control (Fig. 3c, bottom right
panel). For example, we saw reduced enrichment with
H3K36me3 at neuroligin-2, NLGN2 with H3.3G34V
knockdown, compared to transduced KNS42 with no
DOX control and KNS42 non-transduced cell lines
(Fig.3b). ese data are consistent with previous obser
-
vations that H3.3G34V mutation leads to local reduc-
tions in H3K36me3 enrichment. Additionally, our data
indicate that the loci with differences in H3K36me3
enrichment after H3.3G34V knockdown are neither
those with greatest H3.3G34V enrichment, nor those
with the greatest H3K36me3 enrichment.
In contrast, induced expression of H3.3G34V was not
sufficient to change genomic H3K36me3 enrichment
patterns. Evaluation of the top 1000 loci with the most
significantly different H3K36me3 enrichment between
no DOX and DOX-induced knockdown of H3.3G34V
in KNS42 showed that, compared to no DOX control,
KNS42 cells with DOX-induced H3.3G34V knock
-
down have greater overall H3K36me3 enrichment at
698 loci (Fig.3d). It has been previously suggested that
H3.3G34V expression leads to differential distribu
-
tion of H3K36me3 on approximately 150 genes [19].
Taken together, our data suggest that DOX-induced
H3.3G34V knockdown does not affect the most
H3.3G34V or H3K36me3 enriched loci, but does have
specific genomic effects on a limited subset of biologi
-
cally relevant genes.
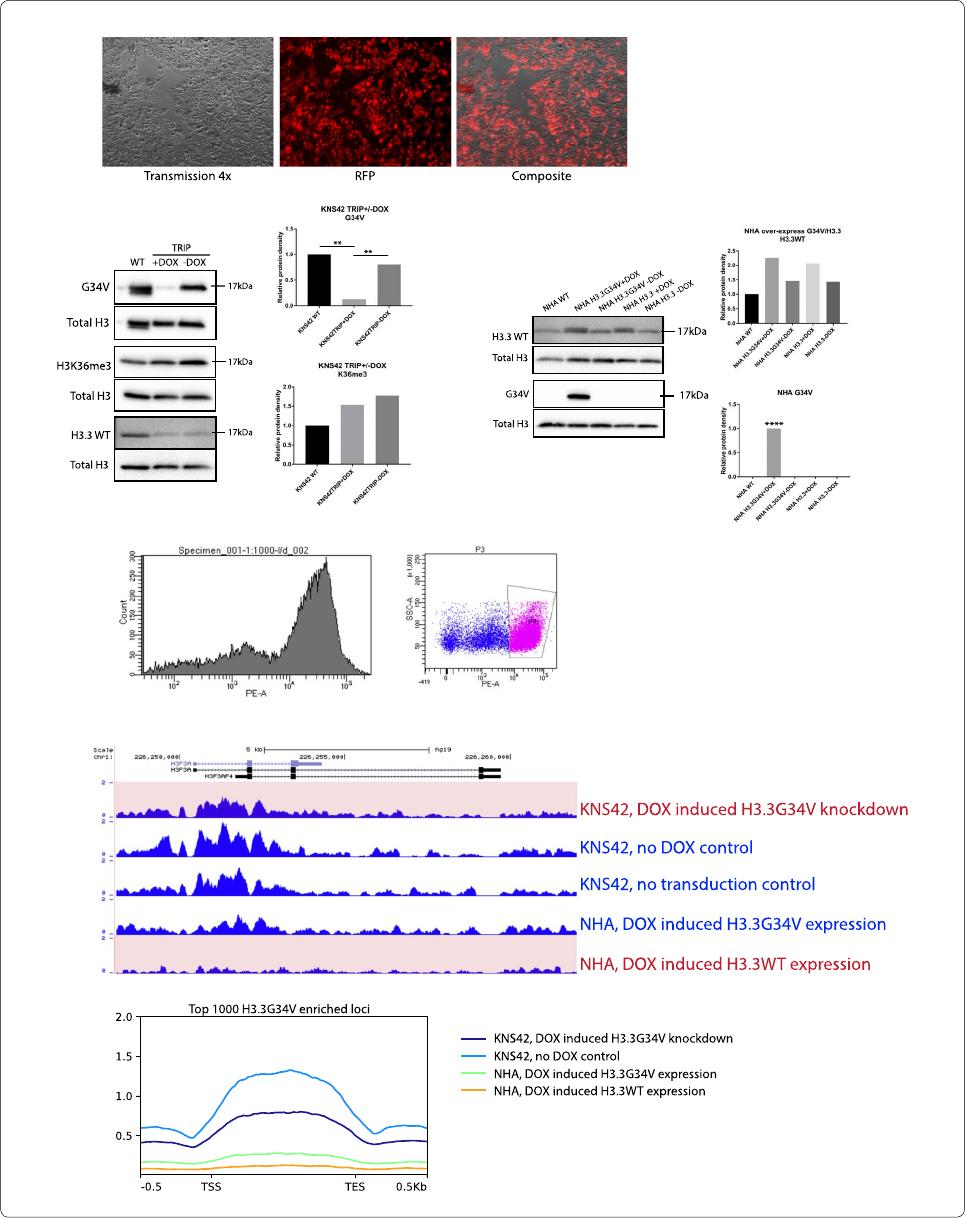
Fig. 3 G34V mutation does not affect global H3K36me3. Increased H3K36me3 is observed at loci with G34V knockdown. a Relative proportion of
H3K36me3 enrichment across gene elements with H3.3G34V expression or knock‑down. b H3K36me3 enrichment at the NLGN2 gene is higher in
KNS42 after G34V knockdown, compared to KNS42 no DOX control and non‑transduced KNS42. However, transduced H3.3G34V into NHAs had
no effect on H3K36me3 enrichment patterns. c Metagene profile of H3K36me3 enrichment. No significant difference in H3K36me3 enrichment
was observed at the 1000 most H3K36me3 enriched loci (top left), nor at the 1000 most H3.3G34V enriched loci (top right) with or without
DOX‑induced H3.3G34V knockdown. No difference H3K36me3 enrichment was also observed at the 1000 loci with the greatest difference in
H3.3G34V enrichment between KNS42 no DOX and DOX‑induced H3.3G34V knockdown (bottom left). In contrast, greater H3K36me3 enrichment
was observed in 1000 loci with the greatest difference in H3K36me3 enrichment with H3.3G34V knockdown, compared to no DOX control (bottom
right). d Heatmap profiles of K36me3 peaks at loci with the top 1000 most difference in enrichment before and after knockdown. Signals from (left)
KNS42 with DOX‑induced G34V knockdown, (middle) KNS42 without G34V knockdown (no DOX control), and (left) the difference between them (Δ,
left minus middle). Positive values indicate that KNS42 with DOX‑induced G34V knockdown has higher K36me3 enrichment compared to no DOX
control
(See figure on next page.)
Page 8 of 13
Huangetal. acta neuropathol commun (2020) 8:219
a
b
c
d

Page 9 of 13
Huangetal. acta neuropathol commun (2020) 8:219
H3.3G34V isassociated withhigher H3K27me3 enrichment
Several studies have shown that H3.3G34V directly
impacts the modification state of adjacent K27 and K36
residues on the mutant H3.3 protein [2]. In line with this,
we observed greater H3K27me3 enrichment in KNS42
cells with H3.3G34V (740,497 peaks total, 11,516 pro
-
moter, 332,437 gene body), compared to KNS42 cells after
H3.3G34V knockdown (457,844 peaks total, 8270 pro
-
moter, 214,405 gene body) (Fig.4a). e greater enrich-
ment of H3.3K27me3 in non-transduced KNS42 and
transduced KNS42 with no DOX control compared to
KNS42 cells with DOX-induced H3.3G34V knockdown
was observed at active enhancers (Fig. 4b). In turn, at
HOXA13 we saw lower enrichment of H3K27me3 in
KNS42 cells with DOX-induced H3.3G34V knockdown,
compared to transduced KNS42 with no DOX control and
non-transduced KNS42, indicating that the H3.3G34V
mutation is associated with higher H3K27me3 enrich
-
ment (Fig.4c). Indeed, at the top 1000 most H3.3G34V-
enriched loci in KNS42 without DOX, we observed that
KNS42 cells without DOX-induced H3.3G34V knock
-
down harbored higher HK27me3 enrichment relative
to other cell lines studied (Fig.4d, top panel). is same
finding was observed at loci with greatest differential
H3.3G34V enrichment between DOX-induced H3.3G34V
knockdown cells and no-DOX controls (Fig. 4d, bot
-
tom panel). Heatmap profiles of the top 1000 most
H3K27me3 enriched loci in KNS42 showed that DOX-
induced knockdown of H3.3G34V results in lower relative
H3K27me3 enrichment, compared to no DOX controls.
H3.3G34V enrichment implicates distinct molecular
pathways
As H3.3G34V mutation is associated with distinct
changes in H3K36me3 and H3K27me3 enrichment pat
-
terns, we sought to determine functional pathways of
gene expression implicated by differential enrichment
patterns of mutant and wild-type H3.3. Functional path
-
ways analysis revealed cellular assembly and organiza-
tion (p = 1.12 × 10
−3
), cellular function and maintenance
(p = 1.18 × 10
−3
), and cell signaling (p = 8.81 × 10
−5
) as
the top molecular functions associated with the gene set
co-enriched in H3.3G34V and H3K36me3. Cell death
and survival (p = 1.12 × 10
−2
), cellular development
(p = 1.25 × 10
−4
), and cellular function and maintenance
(p = 1.25 × 10
−4
), are the top molecular and cellular func-
tions implicated by the gene set co-enriched in H3.3G34V
and K27me3. As expected, the top disease associated
with both these gene sets was cancer (p = 2.11 × 10
−10
).
GO and KEGG analyses were also performed to iden
-
tify functional annotations of genes with the most differ-
ential H3.3G34V, H3.3WT, and H3K36me3 enrichment
between KNS42 with intact H3.3G34V expression and
H3.3G34V knockdown. Cellular metabolism and onco
-
genesis were consistently the top two enriched pathways
in cells expressing H3.3G34V (Additional file 2: Figure
S2), with metabolic pathways implicated as the top cellu
-
lar function of this gene set (−log(p value) = 12.92–21.15,
Additional file3 Figure S3). Cellular neuron projection
morphogenesis and neuron differentiation were also
highly enriched in this gene set, consistent with previous
studies showing genes enriched in H3K36me3 contribute
to in neuronal differentiation and cell proliferation [19].
Discussion
Somatic missense mutations that alter histone H3.3 struc-
ture and function are uniquely common in pediatric
high-grade glioma. Tumors harboring the H3.3G34V/R
mutation are clinically and biologically distinct from wild
type tumors, with poorer progression free and overall
survival, and unique genomic, proteomic, methylomics
and epigenetic profiles relative to wild-type tumors [5,
9]. However, the mechanisms by which these mutations
lead to tumorigenesis are still not completely understood.
While prior studies have attempted to compare the effects
of H3.3G34V invitro, these studies did not employ iso
-
genic cell lines. Here, we genetically modified pediatric
glioma cells and normal astrocytes using a DOX-induci
-
ble construct in order to more accurately determine the
effects of H3.3G34V expression on the glioma epigenetic
landscape that may contribute to tumorigenesis.
Prior studies have shown that unlike the K27 and K36
amino acid residues on the histone H3 N-terminal tail,
the H3G34 residue is not post-translationally modified.
(See figure on next page.)
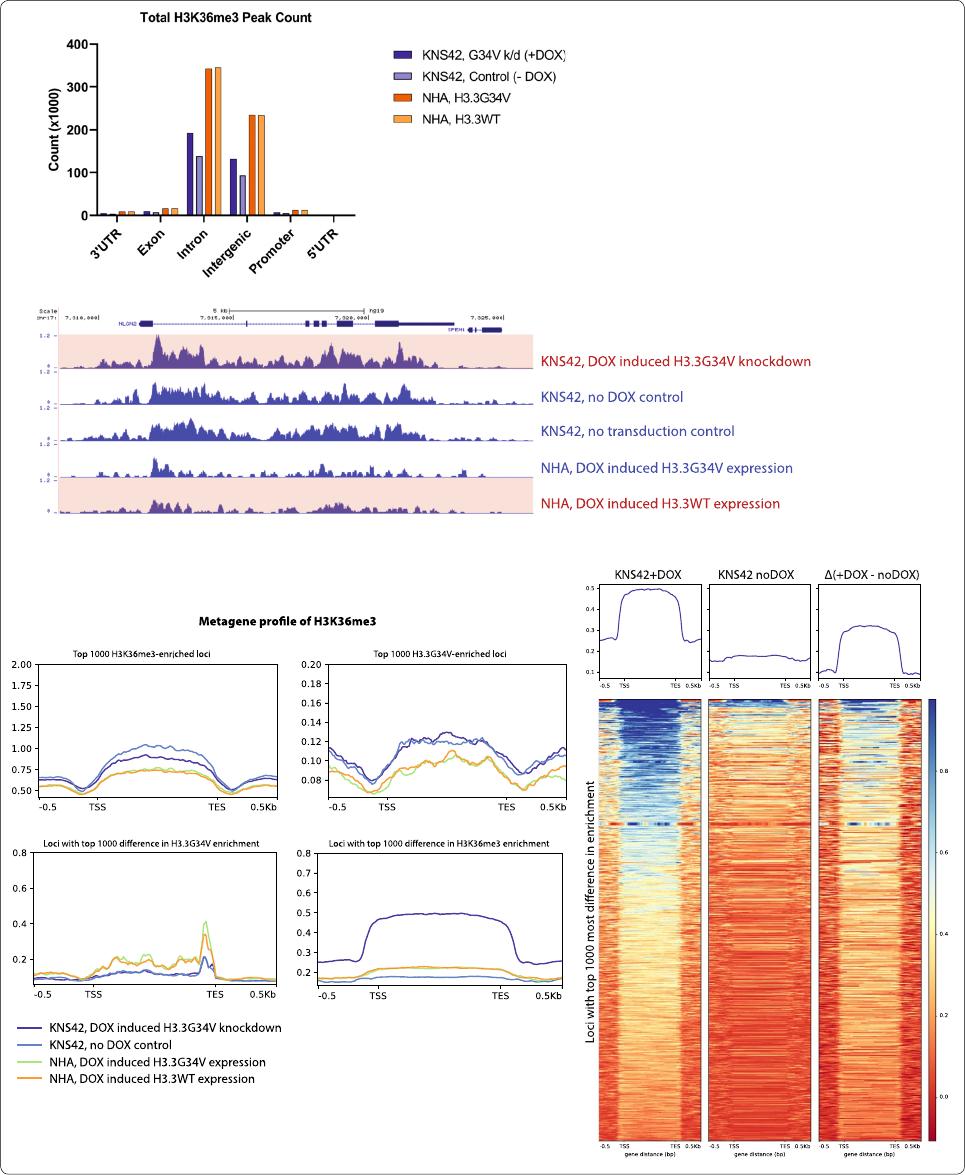
Fig. 4 H3.3G34V is associated with higher H3K27me3 enrichment. a Relative proportion of H3K27me3 enrichment across gene elements
with H3.3G34V expression or knock‑down in KNS42 cells. b Metagene profile of H3K27me3 enrichment at active enhancers (H3K27ac peaks
2.5 kb away from TSS). Higher H3K27me3 was observed in transduced KNS42 without DOX and non‑transduced KNS42 compared to KNS42
with G34V knockdown. c At HOXA13, H3K27me3 enrichment is lower in KNS42 with G34V knockdown, compared to KNS42 no dox control and
non‑transduced KNS42. Blue tracks are cell lines that harbor, or overexpressed, H3.3G34V; red tracks are cell lines that do not harbor, or knockdown,
H3.3G34V. d Metagene profile of H3K27me3 enrichment. H3K27me3 enrichment in the gene body across the top 1000 (top) most G34V‑enriched
genes in KNS42 TRIP no dox control. (bottom) most diff genes in G34V enrichment before and after KD in KNS42 TIRP ± DOX. e Heatmap profiles of
K27me3 peaks at the top 1000 most K27me3 enriched loci. Signals from (left) KNS42 with DOX‑induced G34V knockdown, (middle) KNS42 without
G34V knockdown (no DOX control), and (left) the difference between them (Δ, left minus middle). Negative values in the third column indicate that
KNS42 with DOX‑induced G34V knockdown has lower K27me3 enrichment compared to no DOX control
Page 10 of 13
Huangetal. acta neuropathol commun (2020) 8:219
However, H3G34 does lie in close proximity to H3K36,
which undergoes methylation during transcriptional
elongation. As a result, H3.3G34V/R mutations may
alter accessibility of H3K36 to lysine methyltrans
-
ferases, thereby affecting H3K36 methylation and hence
gene expression. For example, a recent study reported
a
c
d e
b
