Vol.:(0123456789)
1 3
Japanese Journal of Radiology
https://doi.org/10.1007/s11604-020-00972-y
ORIGINAL ARTICLE
Improved delineation ofCT virtual bronchoscopy
byultrahigh‑resolution CT: comparison amongdierent
reconstruction parameters
TakuyaAdachi
1
· HaruhikoMachida
2
· MakikoNishikawa
2
· TakahiroArai
1
· ToshiyaKariyasu
2
·
MasamichiKoyanagi
1
· KenichiYokoyama
2
Received: 27 December 2019 / Accepted: 3 April 2020
© The Author(s) 2020
Abstract
Purpose We compared the maximal recognizable bronchial bifurcation order (MRBBO) in CT virtual bronchoscopy (CTVB)
using ultrahigh-resolution CT (UHRCT) and different reconstruction parameters.
Materials and methods We enrolled 38 patients undergoing noncontrast chest CT by UHRCT and reconstructed CTVB
utilizing 3 different combinations of reconstruction parameters, as classified into Group A (matrix size, 512; slice thickness,
1.0mm), Group B (matrix size, 512; slice thickness, 0.5mm), and Group C (matrix size, 1024; slice thickness, 0.25mm). In
right S1, left S1 + 2, and both S3 and S10, two reviewers counted the number of consecutively identified bronchial bifurca-
tions to compare MRBBO among these groups using Kruskal–Wallis test.
Results In these segments, MRBBO increased from Group A to C. MRBBO was significantly higher in Group C than in
both Groups A and B in all the segments except left S10 (P < 0.05 for all). In left S10, it was significantly higher in Group
C than in Group A (P < 0.05) but comparable between Groups B and C (P = 0.122).
Conclusions MRBBO is higher in CTVB by UHRCT utilizing 1024-matrix size and 0.25-mm thickness than parameters
currently recommended for CTVB (matrix size, 512; slice thickness, 0.5–1.0mm).
Keywords CT virtual bronchoscopy· Maximal recognizable bronchial bifurcation order· Peripheral pulmonary lesions·
Ultrahigh-resolution CT
Introduction
Widespread use of multidetector computed tomography
(MDCT) scanners has increased the incidental detection
of peripheral pulmonary lesions (PPLs) subsequently diag-
nosed by surgical, percutaneous needle, or transbronchial
biopsy. The transbronchial method offers the lowest compli-
cation rate but can require tough insertion of a bronchoscope
and/or a biopsy instrument into the lesions [1].
In transbronchial biopsy, CT virtual bronchoscopy
(CTVB) is commonly used for navigation to assist scope
insertion and thus to improve diagnosis of PPLs because
of its 3-dimensional delineation of the tracheal and bron-
chial lumina as observed by actual bronchoscopy [2–4]. The
recent introduction of an ultrathin bronchoscope (external
diameter, ≤ 3mm) in CTVB navigation has required higher
spatial resolution to improve delineation of small peripheral
bronchi [5, 6]. To address this need and improve in- and
through-plane spatial resolution of CT images in clinical
settings, ultrahigh-resolution CT (UHRCT) scanners have
been introduced [7, 8]. However, we believe their utility for
CTVB has not been reported.
We therefore undertook this pilot study to compare the
maximal recognizable bronchial bifurcation order in CTVB
by UHRCT using different reconstruction parameters and
assessed whether use of UHRCT improved delineation of
CTVB compared to that obtained using standard MDCT.
* Haruhiko Machida
1
Department ofRadiology, Kyorin University Hospital,
6-20-2 Shinkawa, Mitaka, Tokyo181-8611, Japan
2
Department ofRadiology, Faculty ofMedicine, Kyorin
University, 6-20-2 Shinkawa, Mitaka, Tokyo181-8611, Japan

Japanese Journal of Radiology
1 3
Materials andmethods
Study population
We retrospectively identified 88 consecutive adult patients
who underwent noncontrast chest CT using a UHRCT
scanner (Aquilion Precision; Canon Medical Systems,
Tokyo, Japan) with superhigh-resolution (SHR) scan mode
(slice thickness, 0.25mm; number of detector channels,
1792) from April 1 through May 31, 2017 at our institu-
tion. We excluded 50 of the 88 whose image data were
deemed invalid for analysis because of significant CT
image artifacts due to poor breath-hold (n = one), inad-
equate positioning of the upper limb (one), and pulmonary
or bronchial structural distortions due to post-operative
(n = 13), interstitial pneumonia (13), pulmonary emphy-
sema (six), bronchiectasis (five), post-radiotherapy state
(four), non-tuberculous mycobacterial infection (two),
elevated diaphragm (two), pneumonia (one), bronchial
obstruction (one), and traumatic hemopneumothorax
(one). Thus, the final study population comprised 38
patients (17 men, 21 women; aged 24–89years, mean age
63 ± 15years) with mean body weight of 56.6 ± 9.9kg
(range 37.4–77.8kg) and body mass index (BMI) of
22.7 ± 3.4kg/m
2
(range 16.9–30.7kg/m
2
).
Our institutional review board approved this retrospec-
tive study, and we obtained written informed consent from
all patients.
CT scan technique
Patients underwent standard noncontrast routine helical
chest CT scanning covering the entire lungs in a cranio-
caudal direction during breath-hold using the UHRCT
scanner with the SHR scan mode (slice collimation,
0.25mm × 160 rows; number of channels, 1792). Scan
parameters were: tube voltage, 120kV; noise index, 12
Hounsfield units (HU) for the 5-mm reconstruction in fil-
tered back projection by automatic exposure control; heli-
cal pitch, 0.806; rotation time, 0.5s; and x-ray focus size,
0.4 × 0.5mm or 0.6 × 0.6mm. Just before each CT scan-
ning, we checked the maximal tube current displayed on
the CT console and selected the focus size of 0.4 × 0.5mm
unless the tube current exceeded 260mA because the max-
imal limitation of tube current is 260mA for the focus
size of 0.4 × 0.5mm and 310mA for that of 0.6 × 0.6mm.
We recorded the volume CT dose index (CTDI
vol
, meas-
ured in mGy) and dose length product (DLP, measured in
mGy・cm) displayed on the dose report on the CT scanner
for each patient and calculated the mean CTDI
vol
and DLP
for all patients.
CTVB image generation
For each patient, we used adaptive iterative dose reduction
(AIDR 3D Enhanced Strong; Canon Medical Systems) to
reconstruct the UHRCT image datasets with field of view
of 320–375mm and a kernel for mediastinal display (FC03)
utilizing 3 different combinations of reconstruction param-
eters including matrix size (512
2
and 1024
2
) and slice thick-
ness/interval (0.25/0.2, 0.5/0.4, and 1.0/0.8mm) (Table1).
All datasets were transferred to a dedicated worksta-
tion (SYNAPSE VINCENT version 4.6.0007; FUJIFILM
Medical, Tokyo, Japan), on which an experienced radiol-
ogy technologist reconstructed images by: applying an auto-
matic algorithm to extract the region of the bronchial wall
to generate 3-dimensional CTVB; simulating a pulmonary
nodule as a target lesion adjacent to the pleura of the most
apical part in Segment 1a of the right lung (right S1) and
Segment 1 + 2a of the left lung (left S1 + 2) and the most
anterior part of Segment 3b of the right lung (right S3) and
Segment 3b of the left lung (left S3) (both S3) and the most
basal part in Segment 10c of the right lung (right S10) and
Segment 10c of the left lung (left S10) (both S10) in each
patient; applying an automatic function to draw a tracking
line running through the center of the tracheal and bronchial
lumina to the nodule under each combination of reconstruc-
tion parameters; and adjusting the threshold to preserve con-
tinuity of the inner surface through the entire route under
each condition (Fig.1). We classified the CTVB image sets
with the 3 different combinations of reconstruction param-
eters into Groups A to C, with C having the smallest voxel
size (Table1).
CTVB assessment
Using a CTVB navigation mode, the experienced radiology
technologist and a board-certified radiologist observed the
CTVB images along the tracking line toward the simulated
nodules in the right S1, left S1 + 2, and both S3 and S10
using a paging method to confirm the absence of pathology
throughout the route for each patient. The 2 blinded review-
ers then assessed all the CTVB image sets of Groups A to C
in random order, and in consensus, they counted the number
Table 1 Three combinations of reconstruction parameters
Group Matrix size Slice thickness
(mm)
Slice
interval
(mm)
A 512 × 512 1.0 0.8
B 512 × 512 0.5 0.4
C 1024 × 1024 0.25 0.2
Japanese Journal of Radiology
1 3
of consecutively identified bronchial bifurcations (based on
the carina as the first bifurcation) to determine the maximal
recognizable bronchial bifurcation order in the right S1, left
S1 + 2, and both S3 and S10 for each group. The reviewers
confirmed identification of bronchial bifurcation when they
could clearly observe at least 2 bronchial orifices as they
moved back and forth at least 3 times.
Statistical analysis
All continuous variables were expressed as mean ± standard
deviation (SD). We analyzed statistics using commercially
available software (IBM SPSS Statistics, version 23 IBM
SPSS, Armonk, NY, USA). We used Kruskal–Wallis test
to compare the maximal recognizable bronchial bifurcation
order in the right S1, left S1 + 2, and both S3 and S10 among
Groups A, B, and C. We selected Groups A and B as coun-
terparts to Group C because Group C had the smallest voxel
size, and the current recommendation for slice thickness for
CTVB using standard MDCT scanners with 512
2
matrix
size is 0.5–1.0mm [2]. In each segment and group, we used
Spearman’s rank correlation coefficient to assess correla-
tion between the maximal recognizable bronchial bifurcation
order and BMI. A P value less than 0.05 was considered
statistically significant.
Results
We observed a mean CTDI
vol
of 12.8 ± 1.5mGy and mean
DLP of 581.6 ± 93.1mGycm.
The maximal recognizable bronchial bifurcation order
tended to increase from Group A to Group C in the right
S1, left S1 + 2, and both S3 and S10 (Table2 and Fig.2).
The maximal recognizable bronchial bifurcation order was
significantly higher in Group C than in both Groups A
and B in all these segments except left S10 (P < 0.05 for
all); was significantly higher in Group C than in Group A
(P = 0.021) but comparable between Groups B and C in
left S10 (P = 0.122) (Fig.2). All of these values in Group
C were higher by one or more than in Groups A and B.
Figure3 shows the improved delineation of peripheral
bronchi and bronchial orifices at the maximal recogniz-
able bronchial bifurcation order in each patient in Group
C compared with delineation in Groups A and B in CTVB
images obtained using UHRCT. No significant correlation
was found between the maximal recognizable bronchial
bifurcation order and BMI in any segments and groups
(P = 0.320–0.989, ρ = − 0.191–0.188).
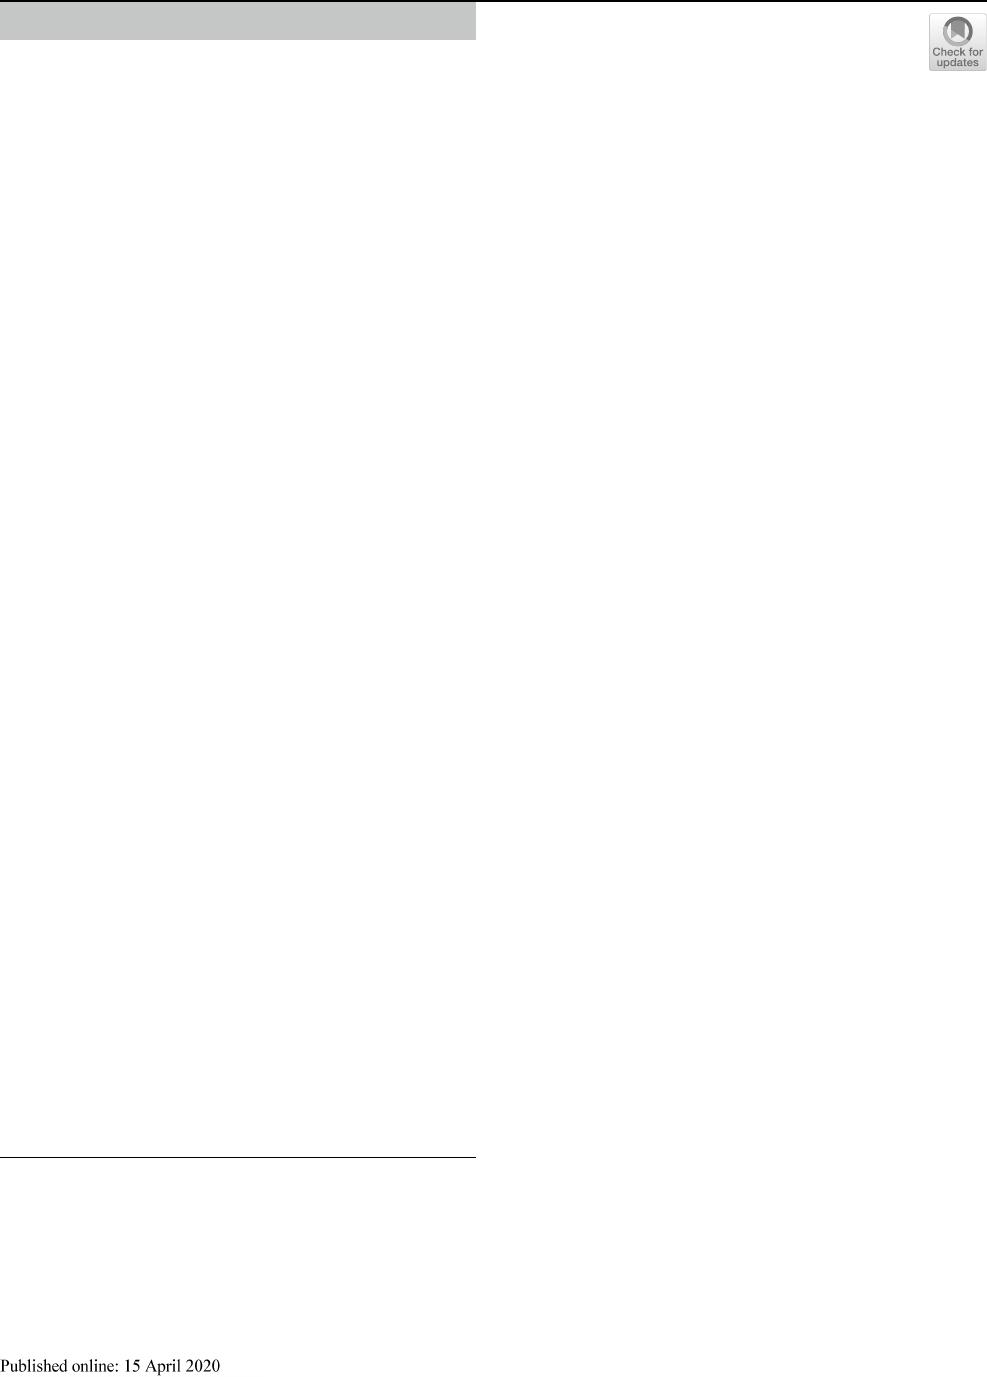
Fig. 1 Process of image generation for computed tomographic (CT)
virtual bronchoscopy (CTVB). A pulmonary nodule (yellow circle)
is simulated as a target lesion adjacent to the pleura of the most api-
cal part in Segment 1 + 2 of the left lung for CTVB on a simulated
chest radiograph, and a tracking line (yellow line) is then automati-
cally drawn running through the center of the tracheal and bronchial
lumina to the nodule on the frontal overlapped view of a volume-ren-
dered bronchial tree (a). The wall region of the tree has been auto-
matically extracted and the simulated chest radiograph reconstructed
from the same CT volume data. Endoscopic view of CTVB before
adjustment of the threshold to preserve continuity of the inner surface
of the bronchial tree through the entire route (b). Endoscopic view of
CTVB after threshold adjustment shows improved continuity (c)
Table 2 Comparison of maximal recognizable bronchial bifurcation
order among Groups A, B and C
Left S1 + 2 Segment 1 + 2a in the left lung, Left S3 Segment 3b in the
left lung, Left S10 Segment 10c in the left lung, Right S1 Segment 1a
in the right lung, Right S3 Segment 3b in the right lung, Right S10
Segment 10c in the right lung
Group A Group B Group C
Right S1 6.7 ± 1.2 7.0 ± 1.3 7.9 ± 1.4
Left S1 + 2 8.6 ± 1.3 8.6 ± 1.3 9.7 ± 1.4
Right S3 8.4 ± 1.3 8.9 ± 1.3 10.0 ± 1.4
Left S3 8.9 ± 1.2 9.6 ± 1.2 10.8 ± 1.2
Right S10 11.6 ± 1.5 12.0 ± 1.7 13.1 ± 1.7
Left S10 8.7 ± 1.6 8.9 ± 1.7 9.8 ± 1.9
Japanese Journal of Radiology
1 3
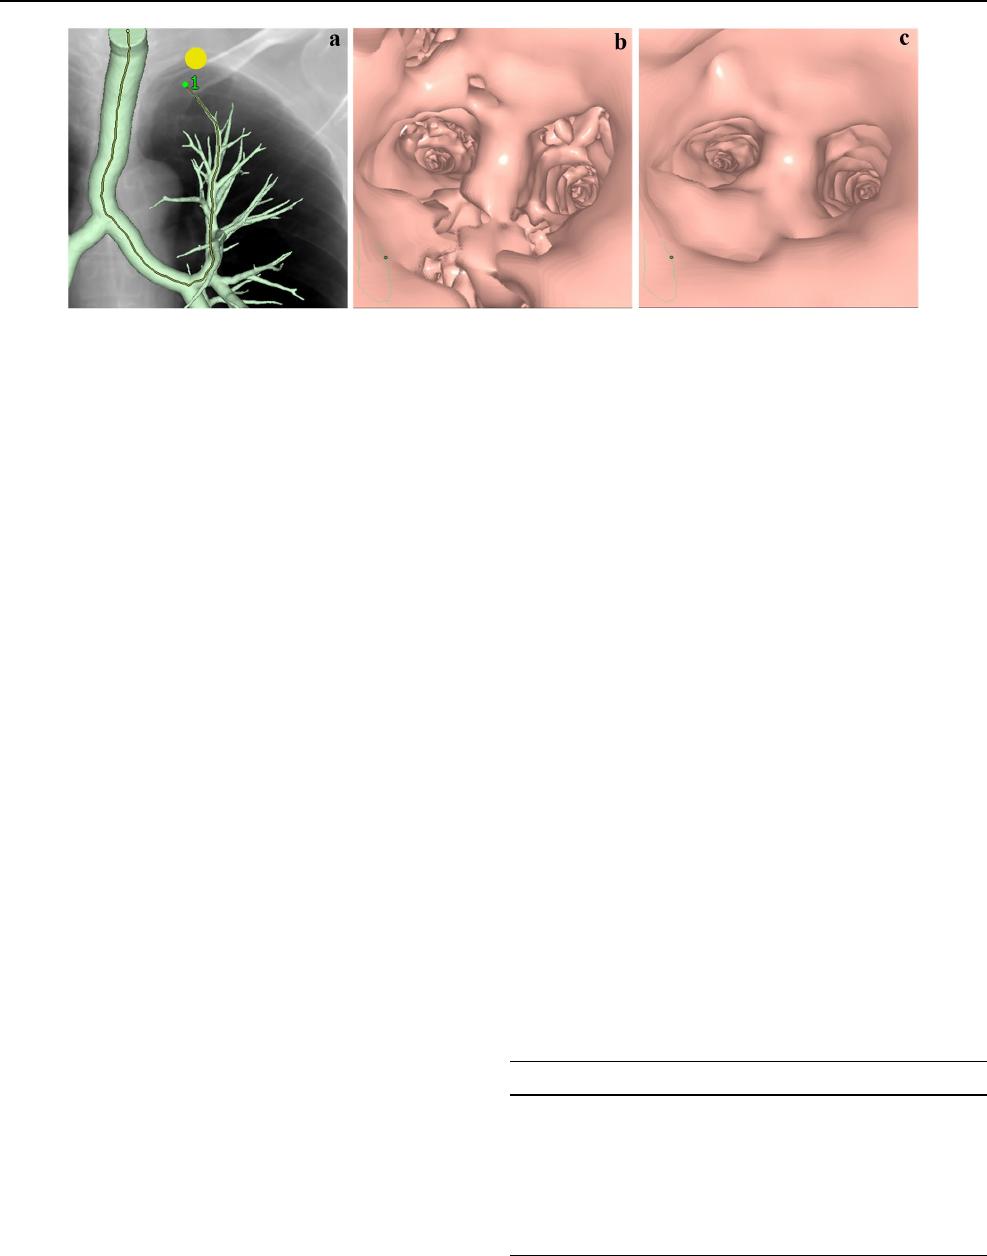
Fig. 2 Bar graphs show the maximal recognizable bronchial bifur-
cation order on computed tomographic (CT) virtual bronchoscopy
(CTVB) obtained using various reconstruction parameters in Seg-
ment 1a of the right lung (right S1), Segment 1 + 2a of the left lung
(left S1 + 2), Segment 3b of the right lung (right S3), Segment 3b
of the left lung (left S3), Segment 10c of the right lung (right S10),
and Segment 10c of the left lung (left S10). In all these segments,
the maximal recognizable bronchial bifurcation order increased from
Group A to Group C. Asterisk indicates statistically significant dif-
ferences by Kruskal–Wallis test between each combination (
*
P < 0.05
and
**
P < 0.01, respectively)
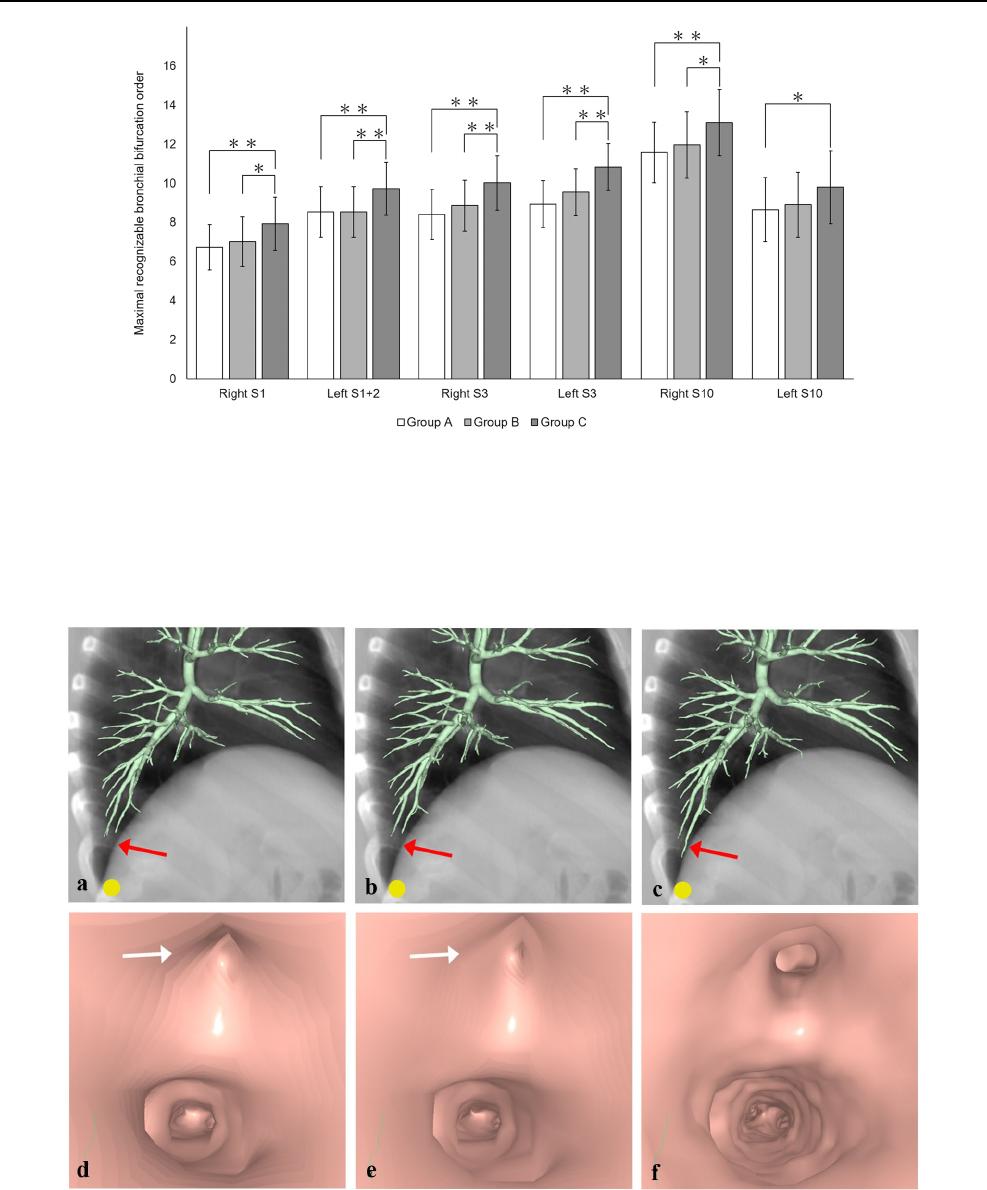
Fig. 3 Computed tomographic (CT) virtual bronchoscopy (CTVB)
for a simulated nodule (yellow circle) adjacent to the pleura of the
most basal part in Segment 10c of the right lung in a 73-year-old
man. On the lateral overlapped view of a volume-rendered bronchial
tree and a simulated chest radiograph reconstructed from the same
CT volume data (a–c), delineation of peripheral bronchi in this seg-
ment (red arrows) improved from Group A (a) to Group B (b) to
Group C (c). On the endoscopic view of CTVB at the 13th bifurca-
tion in the segment (d–f), 2 bronchial orifices are clearly identified in
Group C (f), but one of these orifices appears to be obstructed (white
arrows) in Groups A (d) and B (e). Detailed delineation of the bron-
chial inner surface is also better in Group C (f) than in Groups A (d)
and B (e)

Japanese Journal of Radiology
1 3
Discussion
As expected, we observed the highest maximal recogniz-
able bronchial bifurcation order in CTVB by UHRCT uti-
lizing matrix size of 1024
2
and slice thickness of 0.25mm,
and that order was significantly higher than that obtained
using the values currently recommended for CTVB using
standard MDCT scanners (matrix size, 512
2
; slice thick-
ness, 0.5 or 1.0mm) [2]. The UHRCT scanner used in
our study has been in clinical application since 2017 and
achieved higher spatial resolution (maximal spatial resolu-
tion, approximately 0.15mm or less) than that of standard
MDCT scanners, even with the same voxel size [7–10].
Physical specifications improved by UHRCT included
the SHR scan mode (slice thickness, 0.25mm; number
of channels, 1792) and smaller x-ray tube focus (small-
est, 0.4 × 0.5mm). In fact, delineation of the anatomy of
the temporal bone has been reported more conspicuous
utilizing the improved detector of UHRCT than depic-
tion achieved using standard MDCT, even with the same
voxel size [11]. In addition, UHRCT facilitates the use of
smaller voxel size to decrease partial volume averaging,
so the superiority of CTVB by UHRCT to that utilizing
standard MDCT has been shown in delineating more distal
bronchi while preserving the continuity of the bronchial
inner surface [4, 6].
The maximal recognizable bronchial bifurcation order
by UHRCT ranged from 7.9 ± 1.4 to 13.1 ± 1.7 (median,
10; mean, 10.2 ± 2.4) in Group C, higher than that reported
by standard MDCT [4, 6]. Specifically, in the study by
Asano and colleagues, the median order was 6 using 16-
or 64-detector-row CT with matrix size of 512
2
and slice
thickness of 0.5 to 1.0mm; in the study by Khan and col-
leagues, the mean order was 6.5 ± 0.3 using 16-detector-
row CT with matrix size of 512
2
and slice thickness of
0.75mm. An ultrathin bronchoscope allows more distal
insertion than a larger conventional bronchoscope with
external diameter of approximately 5 to 6mm, and maxi-
mal insertion of the thinner scope to the ninth order has
been reported (median, fifth order) [4]. Thus, use of
UHRCT can better assist this maximal insertion of the
ultrathin bronchoscope. For transbronchial biopsy, diag-
nostic yield can be improved and examination time and
risk of complication reduced by insertion of an ultrathin
bronchoscope to PPLs with the aid of CTVB navigation by
UHRCT employing matrix size of 1024
2
and slice thick-
ness of 0.25mm [1, 4].
The maximal recognizable bronchial bifurcation order
was higher in the left S1 + 2 than in the right S1, pre-
sumably because the bronchial anatomy tends to detour to
the apex more prominently in the left S1 + 2. Image noise
and beam-hardening artifact caused by surrounding bony
structures in this apical area might diminish bronchial
delineation compared with both S10. However, the use of
UHRCT in combination with model-based iterative recon-
struction can improve the maximal recognizable bronchial
bifurcation order in this apical region. We excluded from
analysis a patient with poor breath-hold but did not per-
form electrocardiographically gated chest CT scanning,
which offers higher radiation exposure to patients. Thus,
the maximal recognizable bronchial bifurcation order was
lower in the left S10 than the right S10 and comparable
between Groups B and C only in the left S10, presumably
because bronchial delineation might be more susceptible
to motion artifacts from cardiac pulsation in the left S10.
According to the vendor of our workstation, its automated
tracking function permits the automatic drawing of a track-
ing line into bronchi with inner diameter of at least one
mm. Thus, improvement of this function will even further
increase the maximal recognizable bronchial bifurcation
order in CTVB by UHRCT.
Study limitations
Our study was limited because it was retrospective and
included only a small study population at a single institution,
and we restricted our pilot assessment of maximal recogniz-
able bronchial bifurcation order to only the right S1, left
S1 + 2, and right and left S3 and S10, whereas we selected
the right S1 and left S1 + 2 as the most apical segments, both
S10 as the most basal segments, and both S3 where the bron-
chi run almost parallel to the axial CT plane. We did not use
actual bronchoscopy as a reference to confirm delineation of
bronchial orifices, and insertion of even an ultrathin bron-
choscope to the maximal recognizable bronchial bifurcation
order delineated using CTVB navigation by UHRCT may
not be possible [4]. Confirmation of the clinical utility of
CTVB navigation by UHRCT to assist actual bronchoscopy
and thus transbronchial biopsy may warrant a large-scale
multicenter prospective study. Further, we used the only
workstation at our institution that was capable of generating
CTVB by UHRCT with matrix size of 1024
2
or more, but its
limited capacity to process high-volume data did not permit
reconstruction of UHRCT images with maximal matrix size
of 2048
2
. Our findings may also have been influenced by
the smaller body weight and BMI of our Japanese patients
compared to that of average-sized patients in Western coun-
tries, and the noise index in our study was that commonly
used for routine chest CT at our institution and might be
relatively small. Nevertheless, both the CTDI
vol
and DLP
complied with the criteria for radiation dose to patients for
standard chest CT (CTDI
vol
, 30mGy; DLP, 650mGycm)
according to European guidelines on quality criteria for
CT [12]. The lower radiation dose may have affected our
results by increasing image noise, whereas more advanced

Japanese Journal of Radiology
1 3
reconstruction techniques for further reducing image noise,
such as model-based iterative reconstruction, are applicable.
The 2 blinded reviewers in consensus assessed the CTVB
image sets, which may result in a confirmation bias.
Conclusion
In conclusion, with preserving continuity of the bronchial
inner surface, CTVB by UHRCT using matrix size of 1024
2
and slice thickness of 0.25mm improves delineation of
bronchial bifurcation compared to that achieved using the
values currently recommended for CTVB (matrix size, 512
2
;
slice thickness, 0.5–1.0mm), and its clinical application for
navigation in transbronchial biopsy, particularly using an
ultrathin bronchoscope, may improve clinical management
for patients with PPLs.
Acknowledgements This work was supported by a Grant-in-Aid for
Scientific Research (C) 18K07643, the Japan Society for the Promotion
of Science, Japan.
Funding A Grant-in-Aid for Scientific Research (C) 18K07643, the
Japan Society for the Promotion of Science, Japan.
Compliance with ethical statement
This study was approved by our institutional review board.
Open Access This article is licensed under a Creative Commons Attri-
bution 4.0 International License, which permits use, sharing, adapta-
tion, distribution and reproduction in any medium or format, as long
as you give appropriate credit to the original author(s) and the source,
provide a link to the Creative Commons licence, and indicate if changes
were made. The images or other third party material in this article are
included in the article’s Creative Commons licence, unless indicated
otherwise in a credit line to the material. If material is not included in
the article’s Creative Commons licence and your intended use is not
permitted by statutory regulation or exceeds the permitted use, you will
need to obtain permission directly from the copyright holder. To view a
copy of this licence, visit http://creat iveco mmons .org/licen ses/b y/4.0/.
References
1. Asano F, Aoe M, Ohsaki Y, Okada Y, Sasada S, Sato S, etal.
Deaths and complications associated with respiratory endoscopy:
a survey by the Japan Society for Respiratory Endoscopy in 2010.
Respirology. 2012;17:478–85.
2. Asano F, Eberhardt R, Herth FJ. Virtual bronchoscopic navigation
for peripheral pulmonary lesions. Respiration. 2014;88:430–40.
3. Ishida T, Asano F, Yamazaki K, Shinagawa N, Oizumi S, Moriya
H, etal. Virtual bronchoscopic navigation combined with endo-
bronchial ultrasound to diagnose small peripheral pulmonary
lesions: a randomised trial. Thorax. 2011;66:1072–7.
4. Asano F, Shinagawa N, Ishida T, Shindoh J, Anzai M, Tsuzuku A,
etal. Virtual bronchoscopic navigation combined with ultrathin
bronchoscopy. A randomized clinical trial. Am J Respir Crit Care
Med. 2013;188:327–33.
5. Summers RM, Shaw DJ, Shelhamer JH. CT virtual bronchoscopy
of simulated endobronchial lesions: effect of scanning, reconstruc-
tion, and display settings and potential pitfalls. AJR Am J Roent-
genol. 1998;170:947–50.
6. Khan MF, Herzog C, Ackermann H, Wagner TO, Maataoui A,
Harth M, etal. Virtual endoscopy of the tracheo-bronchial system:
sub-millimeter collimation with the 16-row multidetector scanner.
Eur Radiol. 2004;14:1400–5.
7. Kakinuma R, Moriyama N, Muramatsu Y, Gomi S, Suzuki M,
Nagasawa H, etal. Ultra-high-resolution computed tomography
of the lung: image quality of a prototype scanner. PLoS ONE.
2015;10:e0137165. https ://doi.or g/10.1371/journ al.pone.01371 65.
8. Hata A, Yanagawa M, Honda O, Kikuchi N, Miyata T, Tsukagoshi
S, etal. Effect of matrix size on the image quality of ultra-high-
resolution CT of the lung: comparison of 512 × 512, 1024 × 1024,
and 2048 × 2048. Academic Radiol. 2018;25:869–76.
9. Tanabe N, Oguma T, Sato S, Kubo T, Kozawa S, Shima H,
etal. Quantitative measurement of airway dimensions using
ultra-high resolution computed tomography. Respir Investig.
2018;56(6):489–96.
10. Yanagawa M, Hata A, Honda O, Kikuchi N, Miyata T, Uranishi
A, etal. Subjective and objective comparisons of image quality
between ultra-high-resolution CT and conventional area detec-
tor CT in phantoms and cadaveric human lungs. Eur Radiol.
2018;28(12):5060–8.
11. Yamashita K, Hiwatashi A, Togao O, Kikuchi K, Matsumoto N,
Momosaka D, etal. Ultrahigh-resolution CT scan of the temporal
bone. Eur Arch Otorhinolaryngol. 2018;275:2797–803.
12. Menzel H, Schibilla H, Teunen D, eds. European guidelines on
quality criteria for computed tomography. Luxembourg: European
Commission, 2000. Publication No. EUR 16262 EN
Publisher’s Note Springer Nature remains neutral with regard to
jurisdictional claims in published maps and institutional affiliations.
