Eutectic Growth: Selection of Interlamellar Spacings
V. SEETHARAMAN and R. TRIVEDI
Critical experimental studies in a model transparent organic system have been carried out to estab-
lish the interlamellar spacing selection criterion for directionally solidified eutectic alloys. It is
shown that the spacing selection is not very sharp and a finite distribution of spacing is observed for
a given velocity. The width of the distribution is found to increase as the velocity is decreased. This
band of spacings is shown to lie within the stable zone predicted by the lamellar stability theory, and
the average spacing lies slightly above the value which corresponds to the minimum undercooling
condition. A number of velocity change experiments were also carded out in which the initial spac-
ing was either larger or smaller than the final spacing. For both these conditions, the average eutec-
tic spacing is found to drift toward the spacing value which is slightly larger than the smallest stable
spacing for the final velocity. All experimental results show that the stable range of eutectic spac-
ings is much smaller than that discussed by Jackson and Hunt.
I. INTRODUCTION
THE
growth of eutectic and eutectoid structures has
received considerable theoretical and experimental atten-
tion since these fine periodic microstructures give rise to
improved mechanical properties. [~-7] Furthermore, eutectic
or near-eutectic alloys can be directionally solidified to ob-
tain
in situ
composite structures. Two important parameters
of eutectic structures, which can be controlled experimen-
tally, are the relative volume fractions of the two phases
and the interlamellar spacing. The volume fractions are
controlled to some extent by the composition of the alloy, f8J
whereas the eutectic spacing is controlled by the imposed
growth rate.
Jackson and Hunt, in their already classic paper, tT] devel-
oped a detailed theoretical model to relate eutectic spacing
with the growth rate for directionally solidified alloys.
They solved the diffusion equation by assuming that the
lamellar fronts are locally flat and they considered the
average curvature of the lamellae only for determining
the average capillary undercooling at the solid-liquid inter-
face. Furthermore, they assumed that the diffusion distance
ahead of the interface is much larger than the interlamellar
spacing so that the periodic diffusion field can be character-
ized by the solution of the Laplace equation. Under these
assumptions, the relationship between the undercooling,
AT, at the solid-liquid interface and the eutectic spacing, h,
was obtained as
AT = Kl,kV + KJ,k,
[1]
where V is the growth rate. Kl and K2 are constant param-
eters for a given system and are defined in the Appendix.
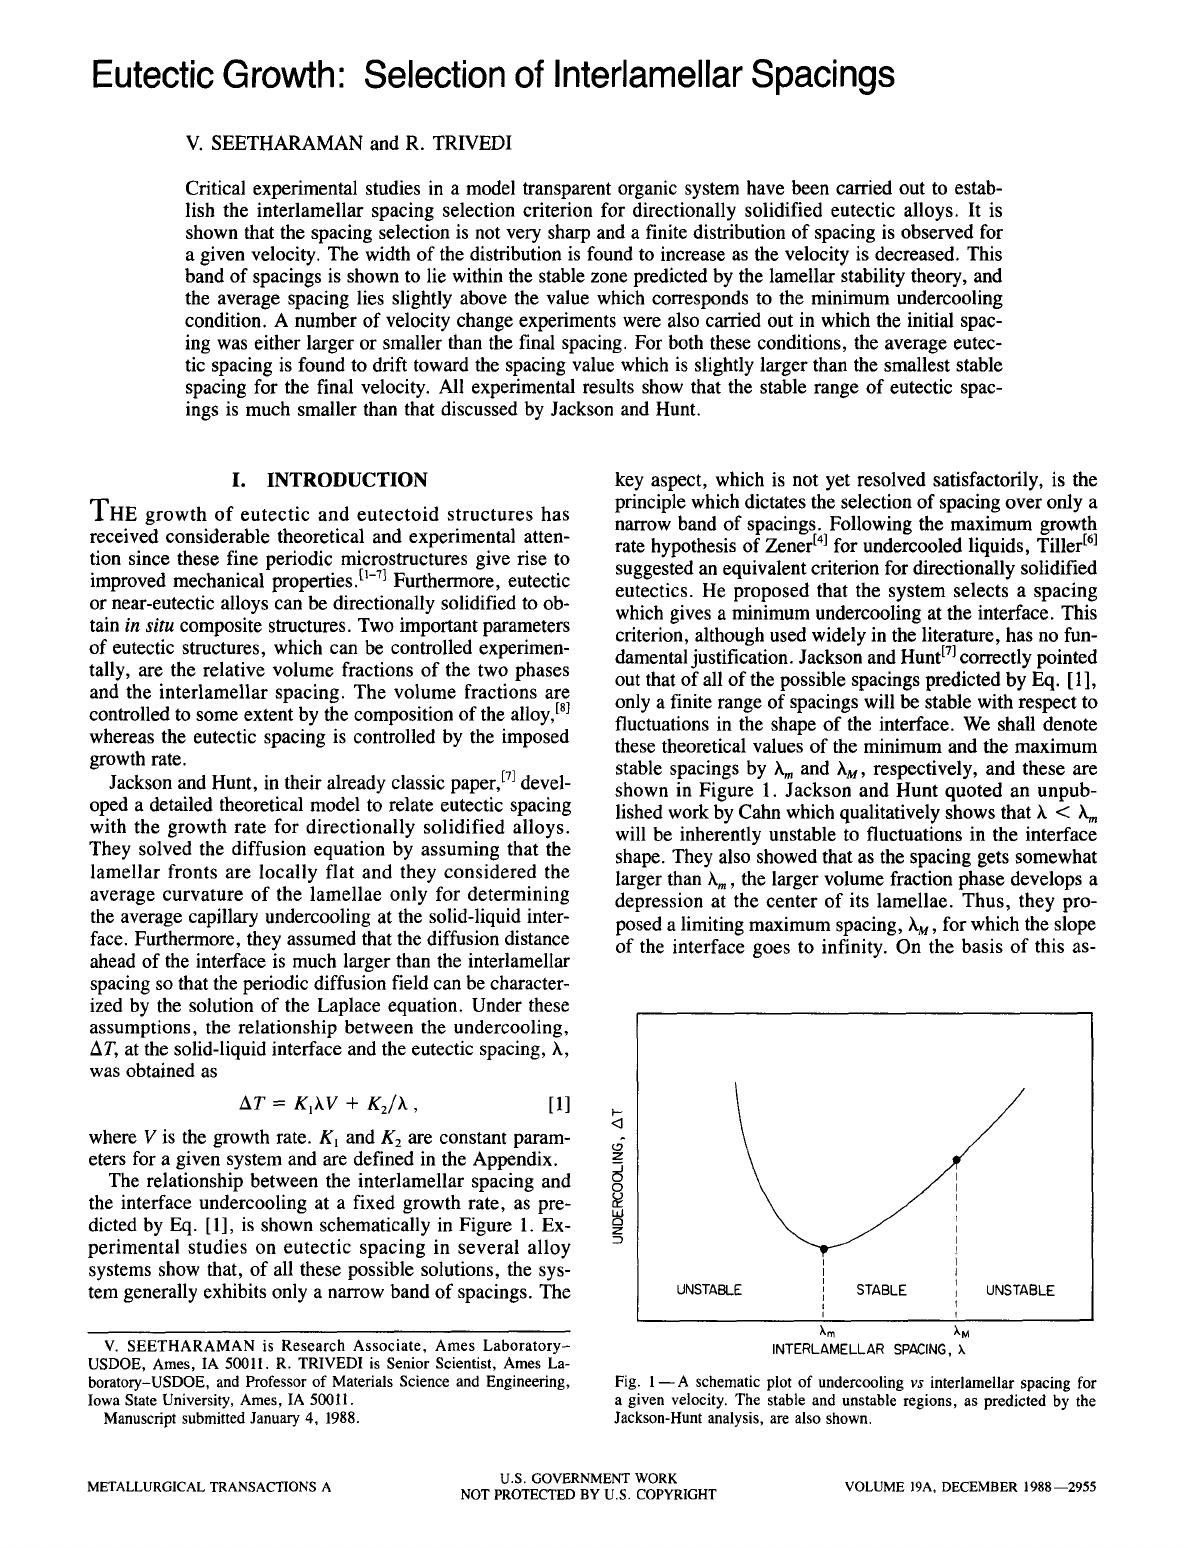
The relationship between the interlamellar spacing and
the interface undercooling at a fixed growth rate, as pre-
dicted by Eq. [1], is shown schematically in Figure 1. Ex-
perimental studies on eutectic spacing in several alloy
systems show that, of all these possible solutions, the sys-
tem generally exhibits only a narrow band of spacings. The
V. SEETHARAMAN is Research Associate, Ames Laboratory-
USDOE, Ames, IA 50011. R. TRIVEDI is Senior Scientist, Ames La-
boratory-USDOE, and Professor of Materials Science and Engineering,
Iowa State University, Ames, IA 50011.
Manuscript submitted January 4, 1988.
key aspect, which is not yet resolved satisfactorily, is the
principle which dictates the selection of spacing over only a
narrow band of spacings. Following the maximum growth
rate hypothesis of Zener t41 for undercooled liquids, Tiller trl
suggested an equivalent criterion for directionally solidified
eutectics. He proposed that the system selects a spacing
which gives a minimum undercooling at the interface. This
criterion, although used widely in the literature, has no fun-
damental justification. Jackson and Hunt E71 correctly pointed
out that of all of the possible spacings predicted by Eq. [1],
only a finite range of spacings will be stable with respect to
fluctuations in the shape of the interface. We shall denote
these theoretical values of the minimum and the maximum
stable spacings by hm and hM, respectively, and these are
shown in Figure 1. Jackson and Hunt quoted an unpub-
lished work by Cahn which qualitatively shows that h < h m
will be inherently unstable to fluctuations in the interface
shape. They also showed that as the spacing gets somewhat
larger than hm, the larger volume fraction phase develops a
depression at the center of its lamellae. Thus, they pro-
posed a limiting maximum spacing, hM, for which the slope
of the interface goes to infinity. On the basis of this as-
<3
~4
Z
s
I I
I I
I I
UNSTABLE I
STABLE Jl
UNSTABLE
I ,
Xm
~'M
INTERLAMELLAR SPACING, k
Fig. 1- A schematic plot of undercooling
vs
interlamellar spacing for
a given velocity. The stable and unstable regions, as predicted by the
Jackson-Hunt analysis, are also shown.
U.S. GOVERNMENT WORK
METALLURGICAL TRANSACTIONS A NOT PROTECTED BY U.S. COPYRIGHT VOLUME 19A, DECEMBER 1988--2955
sumption, they were able to derive simple analytical results
which related h,, and hM with the growth rate as follows:
Vh 2 = K2/K J,
and [2]
vx], = K3, [31
where
K 3
is a constant parameter which depends on the
properties of the system only. The expression for
K 3
is
given in the Appendix. The range of stable eutectic spac-
ings is shown schematically in Figure 1.
The basic ideas of eutectic stability, first proposed by
Jackson and Hunt, have subsequently been examined by a
number of detailed stability analyses of eutectic inter-
faces. 19-161 The most extensive theoretical studies by Langer
and coworkers I14A5'161 show that the smallest stable spacing
corresponds to the minimum undercooling value. These
theoretical models of eutectic stability do not predict a
unique spacing value for a given growth rate. Datye and
LangertlSJ pointed out that the system might drift toward the
lower marginal stability point, given by
hm.
This sugges-
tion is somewhat analogous to that for the dendrite tip
selection where the experimental studies show that the den-
drite tip radius assumes the marginally stable radius based
on the isothermal or the isoconcentrate interface model. It
should be pointed out that the dendrite tip selects the largest
stable radius value, whereas the minimum undercooling
criterion predicts that the eutectic system will select the
smallest stable spacing value. It is not very clear as to why
these two different systems will drift in different directions.
Also, there is no proper justification for the marginal sta-
bility criterion. One of the current thoughts t~7'~8'~91 on the
dendrite growth problem is that the anisotropy of the inter-
facial energy controls the stable dendrite tip radius. For
eutectic growth, anisotropy effects do not appear to be im-
portant, at least for the case of nonfaceted eutectic phases.
One would thus expect that a range of eutectic spacings,
h,, < h < kin,
is possible. We shall now examine some of
the experimental studies which give some insight into the
actual observed spacings.
The variations in average eutectic spacing with growth
rate have been measured in many eutectic systems, and all
the results show that
Vh 2
= constant for low growth rates.
The values of the constants for different systems have been
summarized by Kurz and Sahm. t2~ These experimental re-
suits have often been interpreted as the justification for the
minimum undercooling principle. It is not well appreciated
in the literature that the largest stable spacing also gives a
similar result; see Eqs. [2] and [3]. The specific value of
the theoretical constants will, however, depend on whether
the spacing is established close to Am or h M. Often, the
system parameters are not known precisely and this makes
it difficult to interpret unambiguously where the operating
point of the eutectic spacing lies. For lead-tin and alu-
minum-copper systems, the system parameters have been
measured independently and accurately. In these systems
the average spacing is found to be close to but slightly
larger than
hm.t2~-241
A more detailed study on eutectic spac-
ings in the Pb-Sn system has been carded out by Jordan and
Hunt, t241 who observed a range of eutectic spacings for a
given velocity. This range is quite narrow at high veloci-
ties, although it is significantly larger at low velocities. In
this regard it is worthwhile to note the experimental studies
by Kurz and coworkers 12s-28~ on faceted-nonfaceted eutec-
tics in which the eutectic spacing oscillates between
hm
and hM.
The above experimental studies clearly indicate that
there is no sharp selection criterion for eutectic spacing.
It is then puzzling as to why the average eutectic spac-
ings tend to be closer to
hm
rather than midway between hm
and hM. In order to examine the eutectic spacing selection
problem in more detail, we have carried out critical experi-
mental studies in a transparent eutectic system. Initially,
steady-state eutectic lamellar structures were examined to
characterize precisely the distributions of spacings at differ-
ent velocities. These studies allowed us to characterize the
variations in the average, the smallest, and the largest spac-
ing with the growth rate. Subsequently, dynamical studies
were carried out to see how these observed distributions
evolve with time. Specifically, we have approached a given
velocity by initially stabilizing the eutectic spacings at a
smaller spacing
(i.e.,
higher velocity) or at a larger spacing
(i.e.,
lower velocity). In both cases, the spacing is found
to drift toward
hm
and stabilize at values slightly larger
than
h m .
A small hysteresis effect is found for the average
spacing value. In all cases spacings close to hM have been
found to drift toward the
h m
value, indicating that the range
of stable eutectic spacing is significantly smaller than that
proposed by Jackson and Hunt. [71
II. EXPERIMENTAL PROCEDURES
A. Materials and Cell Preparation
Experimental studies were carried out in carbon tetra-
bromide (CBr4)-hexachloroethane
(C2C16)
system which is
a transparent organic analog for nonfaceted, lameUar eutec-
tic structures. The equilibrium phase diagram for this sys-
tem has been determined by several authors.I29-321 Although
there are some discrepancies among these diagrams, par-
ticularly with respect to the maximum solid solubility of
C2C16 in CBr4 (c~ phase), there is a reasonably good agree-
ment on the following features: eutectic temperature =
356 K; eutectic composition = 8.4 wt pct
C2C16;
melting
point of CBr4 = 364.8 K, and melting point of
C2C16 :
459.6 K. Pure carbon tetrabromide solidifies with a face-
centered cubic structure with a lattice constant of 8.82/k.
It undergoes a transition to a monoclinic phase at 321.4 K.
Pure hexachloroethane also solidifies into a cubic form with a
lattice constant of 7.51/~ and undergoes a solid state transi-
tion to a triclinic phase at 344.3 K. Additional values of the
thermal and physical properties of the a and fl phases have
been measured by Kaukler. f321 Only the value of the inter-
diffusion coefficient has not been measured independently.
The commercial grade carbon tetrabromide was purified
by the vacuum sublimation process. This consisted of heat-
ing carbon tetrabromide at approximately 330 K under a
pressure of 100 mm Hg and allowing its vapors to condense
at -230 K. In contrast, the hexachloroethane could be sub-
limed at atmospheric pressure and at 320 K and then con-
densed at 290 K. These purified materials were mixed,
melted, and filled in specially fused glass cells which had
two narrow openings for filling the cell with the alloy.
Since the vapor pressures of both CBr4 and C2C16 are quite
appreciable at the eutectic temperature, it was necessary to
2956--VOLUME 19A, DECEMBER 1988 METALLURGICAL TRANSACTIONS A
carry out the melting and filling operations in a specially
constructed glass apparatus. In this apparatus a net positive
pressure of argon was applied to force the liquid alloy into
the glass cell and fill it completely. Soon after the filling,
the cells were removed and cooled quickly to ambient tem-
perature in order to prevent macrosegregation of the com-
ponents during the solidification of the alloy. The two small
openings in the cell were then sealed with an epoxy.
B. Directional Solidification Experiments
Directional solidification experiments were carried out
by using an apparatus which is described in detail by Mason
and Eshelman.I33J It consisted of a temperature gradient
stage, drive mechanism, and the measuring and recording
systems. The glass cell was held between the hot and cold
chambers of the temperature gradient stage. The tempera-
tures of these chambers were adjusted such that the portion
of the sample in the hot chamber was molten and that in the
cold chamber was frozen. Directional solidification of the
sample was induced by moving the cell from the hot cham-
ber to the cold chamber by means of a computer controlled
high precision ground lead screw mechanism. An optical
microscope and camera system were mounted such that the
solid/liquid interface present in the gap between the hot and
cold chambers could be viewed and recorded continuously.
The temperature gradient at the interface was measured
from the temperature profile obtained from a calibrated,
low inertia thermocouple which was placed inside the cell.
The solidification velocity was monitored with the help of a
linear variable differential transformer coupled with an elec-
tronic differentiator. 134]
The directional solidification experiments on CBr 4-
8.4 wt pet
C2CI 6 were
conducted using a temperature gra-
dient, G = 3.6 K/mm, and at velocities ranging from 0.1
to 20/zm/s. Since CBr4 tends to break down (particularly
in the presence of
C2C16) at
high temperatures to yield
bromine, it was necessary to keep the hot chamber tempera-
tures quite low (388 K), and this placed an upper limit on
the temperature gradient. At G = 3.6 K/ram, the eutectic
interface remained flat at a macroscopic level only at ve-
locities below 2.0/~m/s. At velocities above this value the
eutectic interface exhibited a tendency to assume a cellular
morphology. In view of this transition from planar to cellu-
lar morphology of the eutectic interface all the lamellar
spacing data presented in this paper were restricted to the
velocity range of 0.1 ~< v ~ 2.0/xm/s.
All the experiments were conducted with a constant cell
thickness of 150/xm. At this thickness level, the convection
effects in the liquid have been found to be negligible.t351 At
the same time, this thickness would minimize the curva-
ture of the solid/liquid interface in the vertical plane. This
thickness, however, would influence the kinetics of spacing
adjustment and this will be discussed by examining sev-
eral cases with different sample thickness to lamellar spac-
ing ratios.
Two sets of solidification studies were carried out in
these experiments. In the first set, the sample was initially
held at Vo = 0 for at least one hour and then the velocity
was quickly changed to the desired value, V, and held at
this velocity until the steady state growth conditions were
obtained. A steady state condition was considered to be
present when the interface position, as observed under the
microscope, did not change with time over a sufficiently
large period of time, so that the interface velocity was equal
to the externally imposed velocity.
In the second set of experiments, the eutectic was ini-
tially grown at V = Vo for sufficiently long times to insure
steady state growth and then the velocity was rapidly
changed to V and held at this value until the steady state
growth conditions were reestablished. Several combina-
tions of V 0 and V were examined such that the spacings
either increased or decreased as the velocity was changed
from V0 to V. These experimental conditions are shown in
Table I. For each experiment the average value and the dis-
tribution of the interlamellar spacings were measured during
the transient as well as the steady state growth conditions.
III. RESULTS
A. Steady State Growth
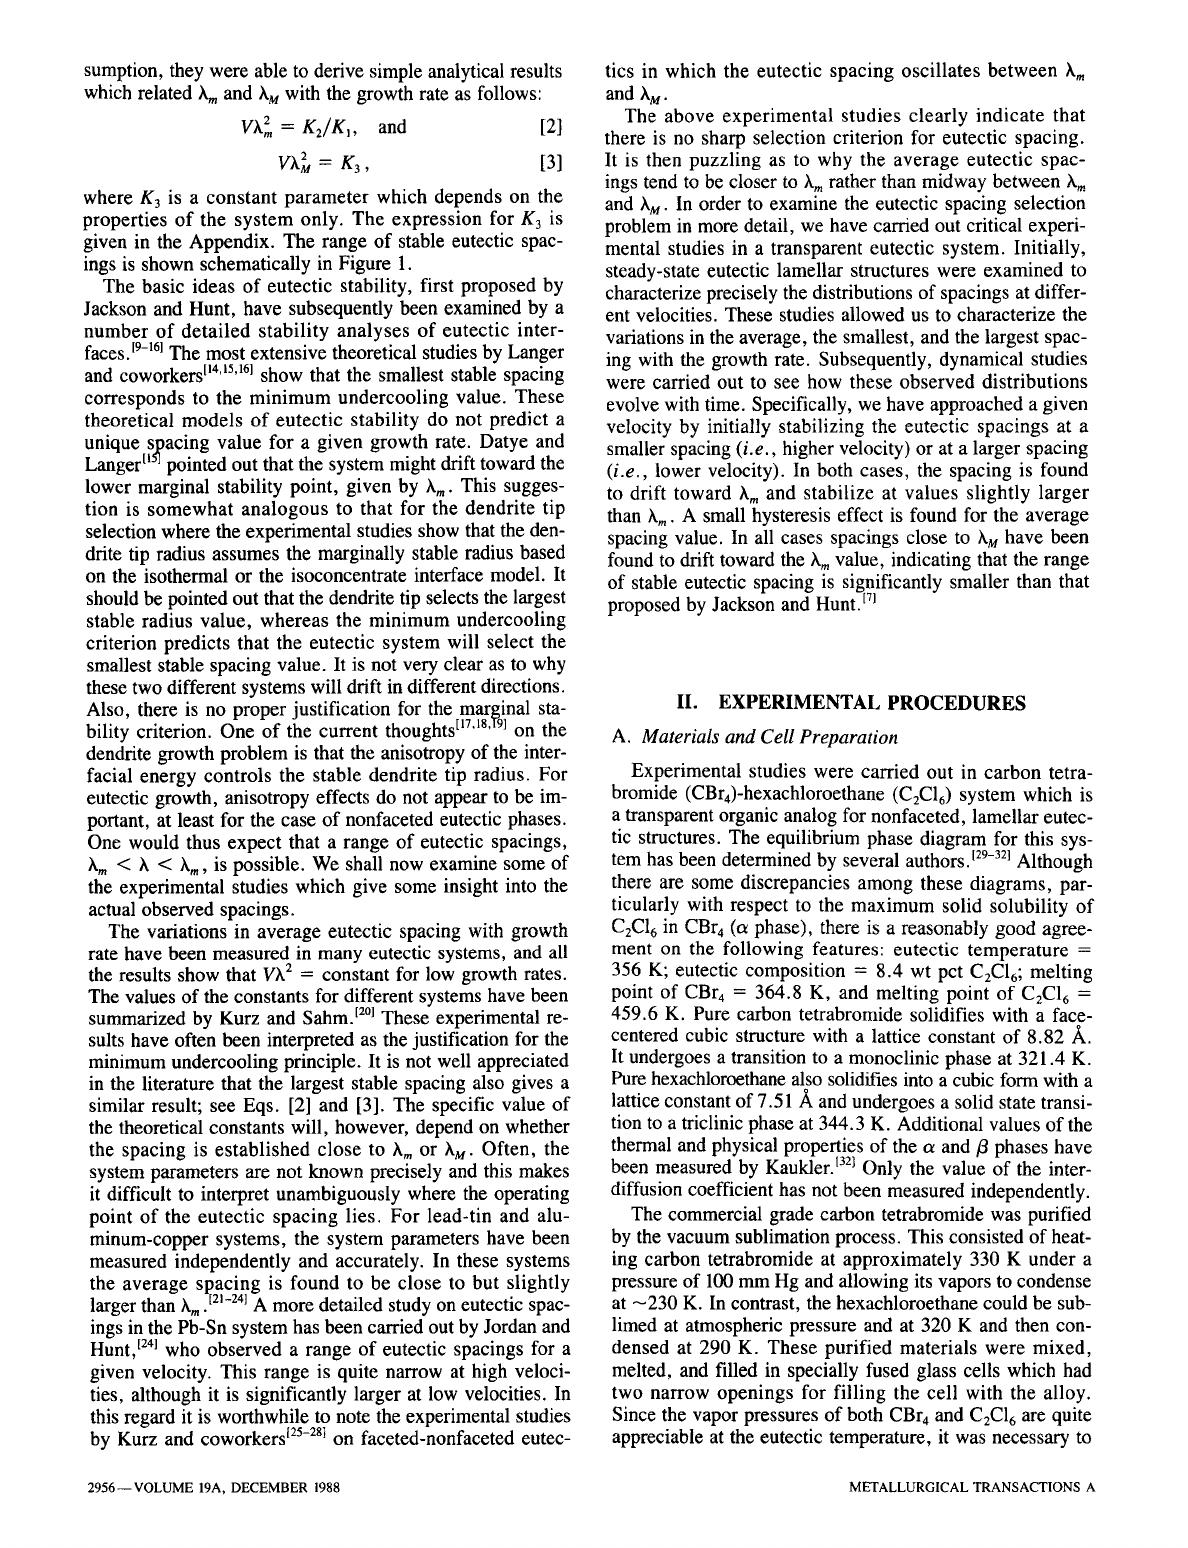
Figure 2 shows the typical steady state microstructures
obtained during the directional solidification of the eutectic
at a constant temperature gradient and different growth
velocities. It can be seen that the solid-liquid interface re-
mained planar at a macroscopic level at all the three veloc-
ities. However, at a microscopic level, an increase in the
positive curvature of the a-phase/eutectic interface was ob-
served at high velocities. These micrographs also demon-
strate the pronounced decrease in the interlamellar spacing
with an increase in the growth velocity.
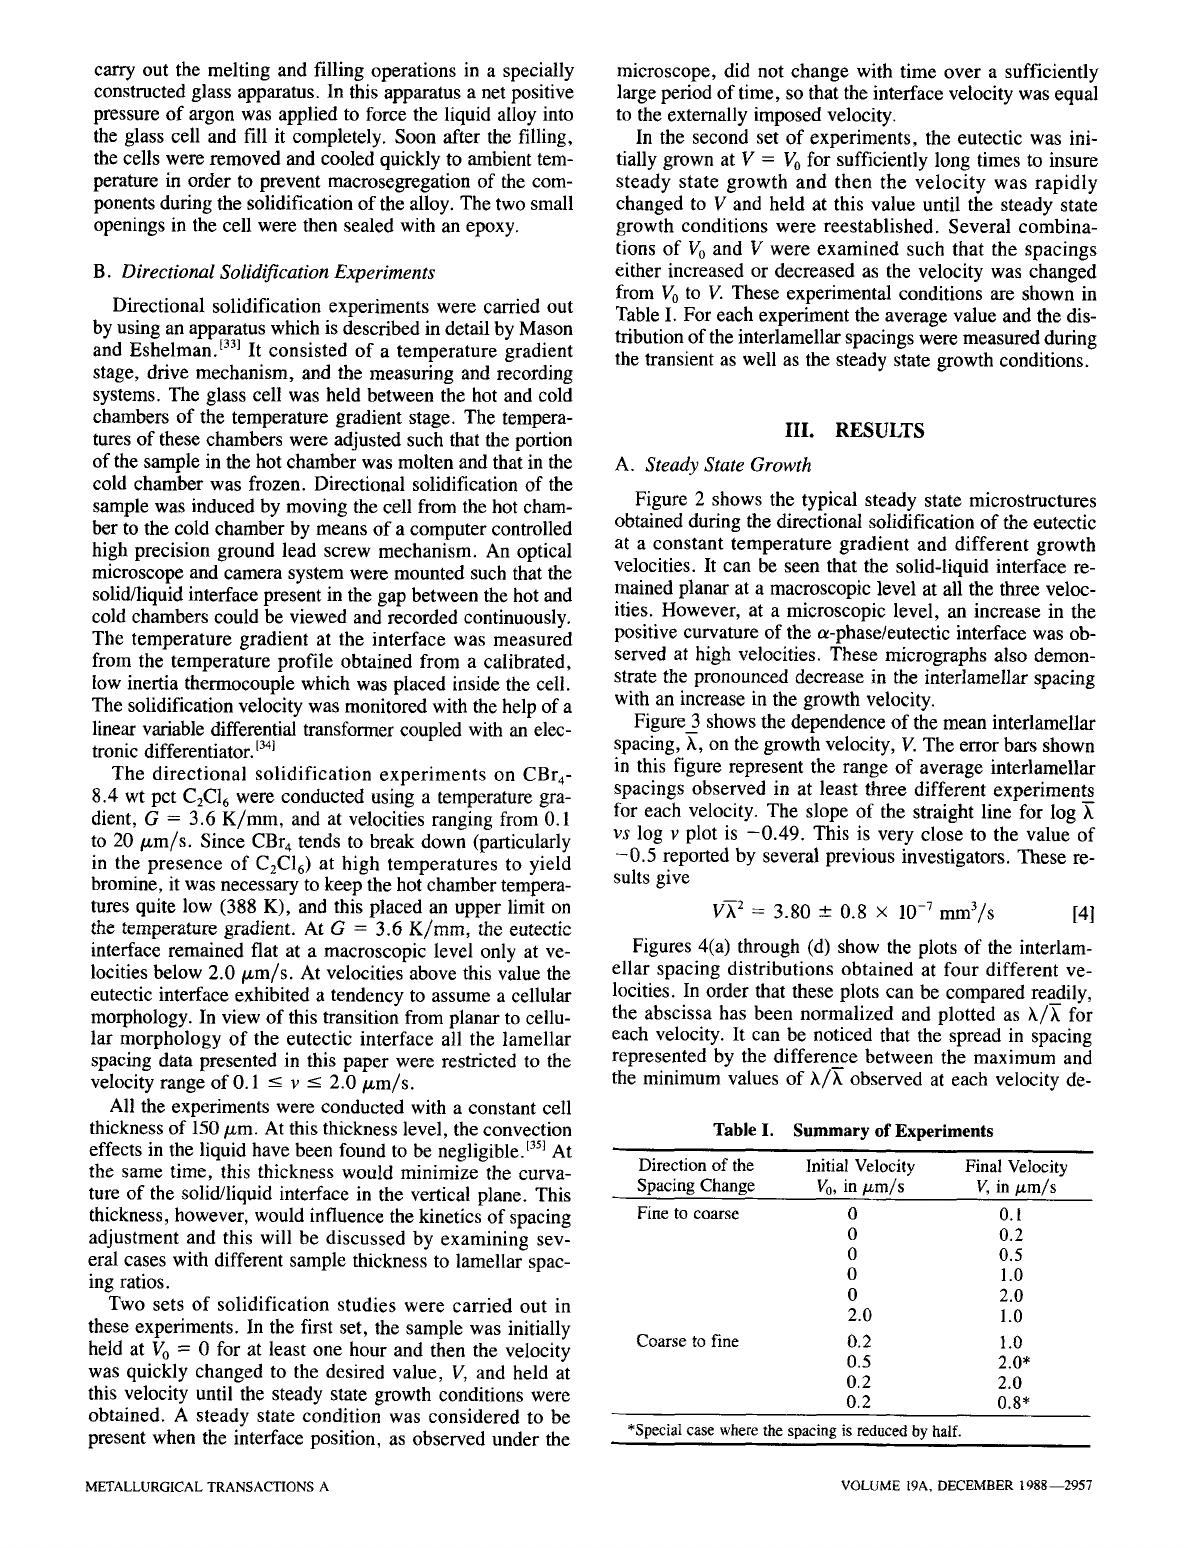
Figure3 shows the dependence of the mean interlamellar
spacing, h, on the growth velocity, V. The error bars shown
in this figure represent the range of average interlamellar
spacings observed in at least three different experiments
for each velocity. The slope of the straight line for log
vs
log v plot is -0.49. This is very close to the value of
-0.5 reported by several previous investigators. These re-
suits give
V~ 2 : 3.80 • 0.8 • 10 -7 mm3/s [4]
Figures 4(a) through (d) show the plots of the interlam-
ellar spacing distributions obtained at four different ve-
locities. In order that these plots can be compared readily,
the abscissa has been normalized and plotted as h/h for
each velocity. It can be noticed that the spread in spacing
represented by the difference between the maximum and
the minimum values of )~/h observed at each velocity de-
Table I. Summary of Experiments
Direction of the Initial Velocity Final Velocity
Spacing Change V0, in/zm/s V, in/zm/s
Fine to coarse 0 0.1
0 0.2
0 0.5
0 1.0
0 2.0
2.0 1.0
Coarse to fine 0.2 1.0
0.5 2.0*
0.2 2.0
0.2 0.8*
*Special case where the spacing is reduced by half.
METALLURGICAL TRANSACTIONS A VOLUME 19A. DECEMBER t988 2957

(a)
(b)
(c)
Fig. 2--Steady-state eutectic optical microstructures of directionally
solidified CBr4-8.4 wt pct CzCI6 alloys at different velocities: (a) V =
0.2/~rn/s, (b) V = 0.5/zm/s, and (c) V = 1.0/xm/s.
E
::L
I00
I0
.... I ........
I ' ' '
slope : -0.49
,,,,I , ,,
, ,,,,L ,
, ,
0.1 0 5 1.0 50
V,
/xrn/s
Fig. 3--Variation in the average interlamellar spacing with velocity.
creases with an increase in the velocity. Secondly, the plots
are distinctly asymmetric and have pronounced tails at
higher values of
h/-h. Thus it is necessary to measure the
following four experimentally observed spacing parameters
for each velocity: (i) the minimum observed spac:,g, h~an,
(ii) the maximum observed spacing, hmax, (iii) the average
spacing, h, and (iv) the most probable spacing, hmp. A
summary of these parameters, measured for different ve-
locities, is given in Table II.
Figure 5 shows the variations in hm~x and
hmi n
with the
growth velocity. Both the sets of data can be fitted with
straight lines of different slopes. The straight line corre-
sponding to the log
h~, vs log V plot has a slope of -0.50,
while that corresponding to log
hma x VS
log V has a slope
of -0.60.
B. Time Dependent Evolution of Eutectic Lamellae
In order to understand the distributions in the lamellar
spacings observed at steady state growth conditions, it is
essential to examine the manner in which the interlamellar
spacings evolve during the growth of the eutectic structure.
For this purpose, the interface was initially held at V = 0
for one hour and then the velocity was quickly increased to
the desired value. The microstructures obtained at and
slightly behind the solid-liquid interface were examined
from the very'early stages of growth and continued until
the steady state conditions were established. Figure 6 il-
lustrates typical microstructures observed as a function
of time at a velocity of 0.5/zm/s. When the cell was ini-
tially stationary, the solid/liquid interface was found to be
planar and the solid consisted of a single phase structure
only. When the imposed velocity was changed from zero to
0.5/zm/s, the single phase interface was found to move for
a few minutes before the eutectic lamellae were nucleated.
It is interesting to note that these lamellae were initially nu-
cleated at one edge of the cell and then the lamellar struc-
ture propagated very rapidly along the solid-liquid interface
toward the other edge (Figure 6(a)). Although the finely-
spaced, two-phase structure observed at early times was
rather ill-defined, it quickly developed into a periodic array
(Figure 6(b)). Subsequently, some of the lamellae were
eliminated and this led to a substantial increase in the inter-
lamellar spacing (Figures 6(c) and (d)). This elimination
process occurred quite randomly, leading to a continuous
increase in the interlamellar spacing with time. Figure 7
shows the increase in the average lamellar spacing with
time for different growth velocities. The important features
indicated in this graph are (i) the time required to 'nucleate'
the eutectic structure decreased with an increase in the ve-
locity, (ii) initially the lamellar spacing increased very
rapidly at all velocities but very soon the process of elimi-
nation of the lamellae became very slow, leading to a very
gradual increase in the lamellar spacing with time until
steady state spacings were established. If r is defined as
the time required to achieve an average spacing equal to
0.9 times the steady-state spacing, then ~" was found to de-
crease with the increase in velocity.
C. Dynamic Response of LameUar Spacings
It is now well established that the steady state primary
spacings of cellular and dendrite structures at any given ve-
locity are dependent on the previous solidification his-
tory. [36'37'381 In contrast, the cell or dendrite tip radii are
found to be independent of the path by which the final ve-
locity was reached. In view of this, it is germane to verify
whether the eutectic interlamellar spacings and their dis-
tribution obtained at any growth velocity are influenced
significantly if the initial velocity, V0, differs from zero.
2958--VOLUME 19A, DECEMBER 1988 METALLURGICAL TRANSACTIONS A

Fig. 4--Frequency distributions of the lamellar spacings observed at different velocities: (a) 0.2, (b) 0.5, (c) 1.0, and (d) 2.0/xm/s.
Accordingly, several directional solidification experiments
were designed and performed, as shown in Table I. In these
experiments, the sample cell was solidified at a specific
value of V0 mentioned above until the steady state growth
was achieved at that velocity. Then the cell velocity was
quickly changed from V0 to V and the directional solidifica-
tion was continued until steady state growth conditions
were re-established. The interlamellar spacings of the eu-
tectic structure were monitored continuously throughout
these experiments.
Table II. Experimental Values of Characteristic
Parameters for the Lamellar Spacing Distribution
V
(/~m/s) hm,, (/xm) hma x (/xm) X (/zm) hmp (/zm)
0.2 38.4 67.5 48.1 47.6
0.5 21.3 32.0 25.9 25.5
1.0 15.5 23.6 19.0 18.4
2.0 12.3 15.0 13.6 13.3
In one set of experiments, the steady-state eutectic spac-
ings were examined for V = 1/xm/s. For this study, three
different initial velocities, namely V0 = 0, 2.0, and 0.2/xm/s,
were chosen. The first two velocities will give a smaller
initial spacing and the third one a larger initial spacing
compared to the steady-state spacing at V = 1 /xm/s.
Figure 8(a) shows the changes in the average lamellar spac-
ing with time after the velocity was changed from V0 to
V = 1 /zm/s. The frequency distributions of the inter-
lamellar spacings for these three conditions are plotted in
Figure 8(b). Since a slightly larger average spacing was ob-
served for V0 = 0.2/xm/s, where the initial spacing was
larger, two additional experiments were carried out under
identical conditions to examine the reproducibility of these
results. Also, these experiments were extended over three
hours since the spacing was observed to drift to a smaller
value at an extremely slow rate. All these experiments showed
the spacing to remain slightly larger than that for the V0 =
0 case. The frequency distributions, however, were nearly
identical except that the peaks were slightly displaced to
METALLURGICAL TRANSACTIONS A VOLUME 19A, DECEMBER 1988~2959

I00
5O
E
::k
x"
10
_I I I~ I I I I I I I i I I I
"~ 9 X max
5 tl tl i i L i i i LL[ L I I
O. I 1.0 5.0
V, Fm/s
Fig. 5- Variations in the experimentally observed minimum and maxi-
mum lamellar spacings with different velocities.
(a)
(b)
60
50
40
2O
I I I I I I I I I I t "/z"
I0
=
-- -- -
V= 0 5/~m/s
9 • It ~VV = 2 p.m/s
I I I I I I I I 1
I//
O( I0 20 30 40 50 60 70 80 90 I00 I000
Fig. 7--Time evolution of the average interlamellar spacings during the
solidification of the eutectic at different velocities.
sequently, another set of experiments was carried out with
V0 = 0 and 0.2/im/s, and V = 2.0/zm/s. In this case,
d/-h
= 11. The results of these experiments are shown in
Figures 9(a) and 9(b). A small hysteresis effect was still
found to be present in this case.
If the hysteresis effect is present due to the kinetic diffi-
culty in creating new lamellae, one may not observe the
hysteresis effect if special values of V 0 and V were chosen
such that the initial spacing is twice the final steady-state
spacing. In this case, a reduction in spacing by half can
occur by nucleating fl-phase lamellae at the center of all
~-phase lamellae. Two different sets of such experiments
were carried out, as indicated in Table I. The results are
shown in Figures 10(a) and 10(b). Note that the spacing dis-
tribution curves superpose to some extent and the average
spacings do not differ significantly. It should be pointed out
that two different mechanisms for the creation of additional
lamellae were observed in these two experiments and these
mechanisms are described elsewhere in detail, t4~
(c)
(d)
Fig. 6--Evolution of larnellar structures during the directional solidifica-
tion
of the eutectic alloy at a velocity of 0.5/~m/s. The times measured
from the instant at which the velocity was changed from zero to 0.5/~m/s
are (a) II.33 rain, (b) II.67 rain, (c) 12.33 rain, and (d) 16 rain.
different average spacing values. In Figure 8(b), only one
distribution is shown to keep the clarity of the figure. The
small differences in the average spacings observed in our
experiments could be due to the fact that the spacing reduc-
tion on a finer scale requires faults which may not form in a
thin sample, t391 In our experiments the final value of
d/'h
was about 7.6, where d is the thickness of the sample. Con-
IV. DISCUSSION
We shall first discuss our results on interlamellar spac-
ings observed under steady-state conditions. Next, we shall
consider our dynamical experiments to examine the mecha-
nism which is responsible for the interlamellar spacing
selection.
The experimental results, for the case in which the veloc-
itywas increased from zero to the required value, show that
Vh 2 =
constant. The value of the constant is given in
Eq. [4]. In order to compare our steady-state results with
the theoretical model of Jackson and Hunt, the values of the
physical constants for the CBr4-C2C16 are required. The val-
ues off~ and f~ were determined from the micrographs
shown in Figure 2. We obtained f~ = 0.72, which is the
same result as that reported by Kaukler. t32] The values of
capillary constants and the contact angles have been mea-
sured by Kaukler, ml and they are given in Table III. The
only unknown value is the interdiffusion coefficient, D, in
the liquid phase.
Our experimental results for the minimum spacing
vs
ve-
locity show that
VX2mm
= 2.67 X 10 -7 mmS/s. [5]
2960--VOLUME 19A, DECEMBER 1988 METALLURGICAL TRANSACTIONS A

(a)
(a)
(b)
Fig. 8--(a) Changes in the average interlamellar spacings with time at a
growth velocity of 1 /zm/s for V0 = 0, 0.2, and 2.0 p.m/s. The times
were measured from the instant at which the velocity was changed from
V0 to V = 1 p.m/s. (b) Frequency distributions in the lamellar spacings
observed during steady state growth at V = 1 /.~m/s for different initial
velocities of 0, 0.2, and 2.0/.Lm/s.
Because of the transparent nature of the system, the elimi-
nation of spacings less than h m could be observed as a func-
tion of time. Thus, if we now consider only the observed
minimum spacing it should correspond to the smallest
stable spacing predicted by the eutectic stability theory, t~SJ
Thus, comparing Eqs. [2] and [5], we obtain
K2/K 1
=
2.67
x 10 -7
mm3/s. [6]
(b)
Fig. 9--(a) Changes in the average lamellar spacing with time, and
(b) the lamellar spacing distribution for the steady-state velocity of
2.0 p.m/s when the initial velocities were 0 and 0.2/xm/s.
Substituting the expressions for K~ and
K 2
from the Ap-
pendix, and using the values of the physical constants given
in Table III, the unknown value of D was determined to be
D = 8.27 • l0 -l~ mE/s [7]
With all the values of the physical constant known, we
can now compare our experimental results with the theo-
retical predictions of Jackson and Hunt, given by Eq. [1].
METALLURGICAL TRANSACTIONS A VOLUME 19A, DECEMBER 1988--2961

Table III. Numerical Values of the Physical
Constants for the CBr4-C2CI6 Eutectic System
f, = 0.72
0, = 65 deg
0t~ = 55 deg
m, = 1.482 K/wt pct
m s = 2.164 K/wt pct
C0= ll.lwtpct
F, = 8.0 • 10 -8 mK
F~ = 11.4 x 10 -8 mK
P(f,~
= 0.72) = 0.025
(a)
(b)
Fig. lO--(a) Changes in the average lamellar spacing with time for two
special cases in which the velocity was decreased by a factor of four to
change the spacing by half. The results for the increase in velocity from
the initial zero velocity are also shown for comparison. (b) The steady-
state lamellar spacing distribution for the two cases in which the final
steady-state velocity was the same.
Figure 11 shows the theoretical relationship between the
undercooling and the interlamellar spacing for different ve-
locities. The values of the minimum and the maximum
stable spacings, given by Eqs. [2] and [3], were also cal-
culated. These values are listed in Table IV, and they are
Fig. 11--Theoretically predicted variations in the interface undercool-
ing, AT, with the lamellar spacing, h, for different velocities. The experi-
mentally observed ranges of lamellar spacings at different velocities are
indicated by the hatched regions, and the mean values are shown by the
solid circle.
indicated on Figure 11 by the pairs of vertical arrows. The
experimentally observed range of spacing and the average
value of the spacings at each velocity are also shown in
the figure.
The average values of spacings are found to be much
closer to the minimum marginal stability values, and these
are significantly smaller than the maximum marginal stabil-
ity values. Furthermore, the distribution in spacings at a
given velocity is somewhat narrow at higher velocities, and
it becomes broader as the velocity is decreased. These re-
suits are similar to those reported by Jordan and Hunt t241 for
the Pb-Sn eutectic system.
All the experimentally observed spacings fall within the
stable region predicted by the Jackson-Hunt model. How-
ever, the experimental spacings constitute only a small
subset of the theoretically stable set of spacings. Further-
more, this subset lies very close to the minimum undercooling
value so that the deviation of the average spacing from that
corresponding to the minimum undercooling is small. Fig-
ure 12 shows the theoretical stable range of spacings as a
function of velocity. Experimental results are also plotted
for comparison. It should be noted that the line representing
the average spacing is nearly parallel to the theoretical line
for the minimum stable spacing. Consequently, the average
spacing, X, can be described as X
= ~)hm,
where ~b is a
constant, t251 The value of 4) = 1.2 describes the results in
the CBr4-C2C16 system.
The key point that we must address here is the experi-
mental observation of the selection of only a small band of
spacings from a larger stable band predicted by the theory.
Table IV. The Theoretical Values of VA 2 and
VA 2, as Predicted by the Jackson-Hunt Theory
f, Vh2
(~m3/s)
Vh~
(~m3/s)
0.5 194.5 2170
0.72 284 --
0.9 1072 2222
2962--VOLUME 19A, DECEMBER 1988 METALLURGICAL TRANSACTIONS A

Fig. 12--A comparison of the experimental results on the interlamellar
spacing variation with velocity with the theoretical values for the two
marginally stable spacings.
Specifically, we would like to examine the reason for the
formation of a range of spacings and understand why this
range of spacings lies close to the minimum undercooling
value. Both these aspects are interrelated, and they will
now be discussed by examining the results of our dynami-
cal studies.
The experiments discussed above had a zero initial ve-
locity, which was then increased rapidly to the desired
value, V. The initial spacing, dictated by the nucleation
considerations, was extremely fine, and it increased with
time, as shown in Figure 7. This coarsening continued until
the spacing entered the stable region. Since the spacing ap-
proached the stable region from h < h,,, they became
stable just above the minimum undercooling point. Once
the lamella with h <
h m
is eliminated, the local spacing
that is created would be larger than
h m .
Thus a range of
spacings less than
h m
will give rise to a range of spacings
above
h m
as the lamellar terminations occur.
The results of dynamical studies in which the initial spac-
ing was larger than the final value will now be discussed.
These studies show that the spacing decreases rapidly first,
but then it approaches the steady-state value at very low
rates. Figure 8(a) shows that the final spacing change is sig-
nificantly slower so that the eutectic spacing does not attain
a constant value even after a long time. This very slow rate
of spacing reduction gives an apparent hysteresis effect
which, we believe, is due to the finite thickness of our sam-
pies. Experimental studies for the special case of spacing
reduction by half show that the average spacing approaches
the same distribution irrespective of the direction in which
the spacing change occurred. Since the mechanisms of
spacing reduction were found to be the same for both cases,
we conclude that the small hysteresis effect observed in
these experiments is due to the small ratio of the sample
thickness to the lamellar spacing.
In order to examine the effect of sample thickness on the
eutectic spacing change, experiments were carried out with
larger sample thickness values. In these experiments sev-
eral grains of eutectics were observed which resulted in a
poor resolution of structure so that it was difficult to mea-
sure the spacing precisely. In order to check the effect of
sample thickness, an analogous experiment has been car-
ded out in a metallic system t41] which shows identical spac-
ing distributions irrespective of whether the initial spacing
was larger or smaller than the steady-state spacing.
One of the aims of this study was to examine the range
of stable spacings discussed by Jackson and Hunt.IT1 All
our experimental results show that the actual spacing dis-
tribution is always close to the hm value. Figure 13 sche-
matically summarizes experimental observations. The open
points represent the initial average spacings, whereas the
filled points show the corresponding final average spac-
ings. It is observed that all the final average spacings were
always slightly above the minimum stable spacing value.
Furthermore, the results of the velocity change from 0.5 to
2.0 ~m/s, represented schematically in Figure 13 as open
and filled circles, show that the initial spacing distribution
for this case was within the stable zone of the final ve-
locity as predicted by the Jackson-Hunt criterion. Thus, if
the theoretical range of stable spacings is valid, then no
change in spacing would be expected. However, as seen in
Figure 10(a), a significant decrease in spacing occurred as
the velocity was changed. Thus, the hM value discussed by
Jackson and Hunt I7] is significantly larger than the actual
hM
value exhibited by the system. We thus conclude that the
criterion of infinite interface slope of the major phase is not
a proper criterion to predict the largest stable spacing. It is
quite probable that the interface becomes unstable when the
slope is finite but exceeds some critical value. A similar
conclusion has been reached by Magnin and
Kurz [26]
for the
growth of irregular eutectics. They showed that the spacing
becomes unstable when the minor phase lamella develops
a small depression whose center is slightly above the line
joining the two triple point junctions of that lamella. De-
tailed experimental studies in the CBr4-C2C16 system by the
authors I4~ have also shown that the larger eutectic spacings
become unstable before the slope of the major phase inter-
face with liquid becomes infinity. Thus, a more rigorous
stability analysis is still needed to characterize precisely the
value of hM.
Fig. 13--A schematic diagram which summarizes the results of the dy-
namical experiments. Various initial spacings are represented by the open
points, and the final spacings are given by the corresponding filled points.
METALLURGICAL TRANSACTIONS A VOLUME 19A, DECEMBER 1988--2963

V. CONCLUSIONS
The theoretical model of eutectic growth, based on diffu-
sional considerations, shows that the lamellar structures
have infinite solutions for a given velocity. It is now well-
established in the literature that, of all these solutions, only
a band of spacings is stable with respect to fluctuations in
the shape of the interface (or in the local spacings). Experi-
mental studies on the variation in the average eutectic spac-
ing with velocity show that this average value lies very
close to the minimum undercooling value. Therefore, it has
been suggested that the eutectic spacing is unique at a given
velocity and this unique value is governed by the minimum
undercooling criterion. Since there is no fundamental basis
for such an optimization principle, we carried out critical
experiments to determine carefully the spacing selection
mechanisms. This study was partly influenced by the ex-
perimental studies of Jordan and Hunt who showed that the
eutectic spacing is not unique but that a band of spacings
exists at a given velocity. We have confirmed their results
in the CBr4-C2C16 system. Furthermore, we have examined
the distribution of spacings at different velocities. We have
shown that average spacing is closer to the minimum under-
cooling value. It is also shown that such spacing distribu-
tions, for a sample of large thickness, are independent of
the direction of the spacing change for a given final veloc-
ity. Dynamical experiments were carried out in which the
initial spacings were larger than the steady-state spacing,
but were within the stable range predicted by Jackson-
Hunt. I71 A sharp reduction in spacing was observed which
shows that the stable range of eutectic spacings is signifi-
cantly smaller than that discussed by Jackson and Hunt.
APPENDIX
Values of system parameters in the Jackson-Hunt model
The values of the constants Kl and K2, in Eq. [ 1 ], are
given by
K, = -~Co P /f~,ft3 O ,
and
t[-F~
Sin 0~ F0 Sin 0p]
K2 = 2~ - --- +
L f~m~ f~m~ I
where 1/m = (1/m~) + (1/m~), in which m~ and m~ are
the magnitudes of the liquidus slopes for the oL and/3
phases, respectively, at the eutectic temperature, f~ and f0
are the volume fractions of the a and 13 phases, respec-
tively. D is the interdiffusion coefficient in liquid, Co the
equilibrium concentration difference between the/3 and the
o~ phase at the eutectic temperature, F, and F~ are the capil-
lary coefficients, and 0~ and 00 are the equilibrium angles
with respect to the planar interface at the triple point junc-
tion. P is a function of volume fraction, and its value is
given by P = E~=l 1/(n'lr) 3 Sin2(mrf~).
For the largest stable spacing, h M, given by Eq. [3], the
value of the constant K3 is given by:/vl
K 3 = a(1 + b sin 0)~:',
when s c' = F~ Sin O,~D/PCom,~ and the constants a and b
are functions of the volume fractions of the two phases.
Table IV in the text shows that the numerical value of K3 is
not very sensitive to the volume fraction changes.
ACKNOWLEDGMENTS
This work was carried out at Ames Laboratory which is
operated for the United States Department of Energy by
Iowa State University under contract no. W-7405-ENG-82.
This work was supported by the Office of Basic Energy
Sciences, Division of Materials Sciences. Appreciation is
expressed to W. Kurz and J.T. Mason for many valuable
discussions and for their comments on the manuscript.
REFERENCES
1. R. Elliott:
Eutectic Solidification Processing,
Butterworth's, Lon-
don, 1983.
2. C.A. Adam: in
Science and Technology of Undercooled Melt, P. R.
Sahm, H. Jones, and C. M. Adam, eds., Martinus Nijhoff, Dedrecht,
1986.
3. W.H. Brandt:
J. Appl. Phys.,
1945, vol. 16, p. 139.
4. C. Zener:
Trans. AIME,
1946, vol. 167, p. 550.
5. M. Hillert:
Jernkontorets Ann.,
1960, vol. 144, p. 520.
6. W.A. Tiller:
Liquid Metals and Solidification,
ASM, Metals Park,
OH, 1958, p. 276.
7. K.A. Jackson and J.D. Hunt:
Trans. AIME,
1966, vol. 236,
p. 1129.
8. E R. Mollard and M.C. Flemings:
Trans. AIME,
1967, vol. 239,
p. 1526.
9. S. Strassler and W. R. Schneider:
Phys. Cond. Matter,
1974, vol. 17,
p. 153.
10. D.T.J. Hurle and E. Jakeman:
J. Cryst. Growth,
1968, vol. 3,
p. 574.
11. H.E. Cline:
J. Appl. Phys.,
1982, vol. 53, p. 5898; 1968, vol. 242,
p. 1613.
12. G.E. Nash:
J. Cryst. Growth,
1977, vol. 38, p. 155.
13. R.E Sekerka:
J. Cryst. Growth,
1971, vol. 10, p. 239.
14. J.S. Langer:
Phys. Rev. Lett.,
1980, vol. 44, p. 1023.
15. V. Datye and J. S. Langer:
Phys. Rev. B,
1981, vol. 24, p. 4155.
16. V. Datye, R. Mathur, and J. S. Langer:
J. Stat. Phys.,
1982, vol. 29,
p. 1.
17. D. Meiron:
Phys. Rev. A,
1986, vol. 33, p. 2704.
18. J.S. Langer and D. C. Hong:
Phys. Rev. A,
1986, vol. 34, p. 1462.
19. D.A. Kessler and H. Levine:
Phys. Rev. A,
1987, vol. 36, p. 4123.
20. W. Kurz and P. R. Sahm:
Gerichtet Erstarrte Eutektische Werkstoffe,
Springer-Verlag, Berlin, 1975.
21. M. Tassa and J. D. Hunt:
J. Cryst. Growth,
1976, vol. 34, p. 38.
22. J.N. Clark and R. Elliott:
Met. Sci. J.,
1976, vol. 10, p. 101.
23. J.N. Clark and R. Elliott:
Metall. Trans. A,
1976, vol. 7A, p. 1197.
24. R.M. Jordan and J. D. Hunt:
Metall. Trans.,
1971, vol. 2, p. 3401.
25. D.J. Fisher and W. Kurz:
Acta Metall.,
1980, vol. 28, p. 777.
26. P. Magnin and W. Kurz:
Acta Metall.,
1987, vol. 35, p. 1119.
27. H. Jones and W. Kurz:
Z. Metallk.,
1981, vol. 72, p. 792.
28. D.J. Fisher and W. Kurz: in
Solidification and Casting of Metals,
Metals Soc., London, 1978, p. 57.
29. J.D. Hunt and K. A. Jackson:
Trans. AIME,
1966, vol. 236, p. 843.
30. H.S. Chen and K. A. Jackson:
J. Cryst. Growth,
1971, vol. 8,
p. 184.
31. W.F. Kaukler and J.W. Rutter:
Mat. Sci. Engg.,
1984, vol. 65,
p. LI.
32. W. E Kaukler: Ph.D. Thesis, University of Toronto, Toronto, ON,
Canada, 1981.
33. J.T. Mason and M. A. Eshelman: IS-4906, Ames Laboratory, Ames,
IA, 1986.
34. M.A. Eshelman: Ph.D. Thesis, Iowa State University, Ames, IA,
1987.
35. K. Somboonsuk: Ph.D. Thesis, Iowa State University, Ames, IA,
1984.
36. K. Somboonsuk and R. Trivedi:
Acta Metall.,
1985, vol. 33,
p. 1051.
37. M.A. Eshelman, V. Seetharaman, and R. Trivedi:
Acta Metall.,
1988, vol. 36, p. 1165.
38. V. Seetharaman, M.A. Eshelman, and R. Trivedi:
Acta Metall.,
1988, vol. 36, p. 1175.
39. H.E. Cline:
Mat. Sci. Eng.,
1984, vol. 65, p. 93.
40. V. Seetharaman and R. Trivedi: in
Solidification Processing of Eu-
tectic Alloys,
D. Stefanescu and G.J. Abbaschian, eds., AIME,
Warrendale, PA, 1988.
41. R. Trivedi, J.T. Mason, and W. Kurz: unpublished work. 1987.
2964--VOLUME 19A, DECEMBER 1988 METALLURGICAL TRANSACTIONS A
