Article
DOI: 10.1557/jmr.2019.299
ADVANCES IN BATTERY TECHNOLOGY: MATERIAL INNOVATIONS IN DESIGN AND FABRICATION
Annealing of LiCoO
2
films on flexiblestainlesssteel for thin
film lithium batteries
Yibo Ma
1
, Mu Chen
1
, Yue Yan
1,a)
, Youxiu Wei
1
, Weiming Liu
1
, Xiaofeng Zhang
1
, Jiaming Li
1
,
Ziyi Fu
1
, Jiuyong Li
1
, Xuan Zhang
1
1
Beijing Engineering Research Center of Advanced Structural Transparencies for the Modern Traffic System, Beijing Institute of Aeronautical Materials,
Beijing 100095, China
a)
Received: 27 June 2019; accepted: 18 September 2019
The LiCoO
2
films were directly deposited on stainless steel (SS) using medium-frequency magnetron sputtering,
and the effects of annealing paramete rs, such as ambiences, temperatures, holding times, and heating rates,
were systematically compared based on surface morphologies, crystal structures, and electrochemical
properties. The results demonstrate that an aerobic atmosphere with 3.5 Pa is the most important parameter to
maintain the performance of LiCoO
2
films. The in fluence of the annealing temperature (>550 °C) ranks second
because the formed (101) or (104) planes of LiCoO
2
facilitate Li
+
migration. A short holding time of 20 min and
a moderate heating rate of 3 °C/min are selected to reduce the oxidation or inter-diffusion between the LiCoO
2
films and the SS substrate. Finally, the optimal annealing process is confirmed and corresponds to the initial
discharge capacity of 37.56 lA h/(cm
2
lm) and the capacity retention of 83.81% at the 50th cycle.
Introduction
Researchers now pay more attention to all-solid-state thin film
lithium batteries (TFLBs) due to their potential applications
such as main power in identification cards, metal–oxide–
semiconductors, and flexible electronic paper displays [1].
The fabrication of LiCoO
2
films as cathodes in TFLBs is
a successful choice due to their excellent electrochemical
properties and maturity of manufacturing [2]. Compared to
the traditional hard substrates, such as Si or mica, TFLBs on
stainless steel (SS) are flexible; that is, they can be charged/
discharged in a bending state [3] and, thus, can be applied in
wearable devices [4, 5]. Since the as-grown LiCoO
2
films
prepared by magnetron sputtering (MS) at room temperature
are in an amorphous state, a post-annealing process is indispens-
able to obtain crystalline LiCoO
2
. Traditional post-annealing
methods for LiCoO
2
films include tube furnace heating [6], rapid
thermal annealing [7, 8, 9, 10, 11], in situ heating [12], two-step
heating [13], and plasma-assisted treatment [14, 15]. In this
article, annealing is performed in the tube furnace due to the
uniform temperature distribution and low cost.
The deposition of LiCoO
2
films by MS is always in an
anoxic state; in order to keep the ideal stoichiometric ratio of
Co:O and an ideal layered structure, an aerobic environment is
required in the post-annealing process. But the SS substrate is
inevitably oxidized and the oxidation layer formed on both
sides of SS increases the battery internal resistance [16, 17, 18].
These oxidation layers need to be polished before battery
assembly. However, the shortcomings do not obscure the
potential of SS as a substrate. SS can directly act as current
collectors, and thereby simplify the manufacturing process and
reduce the material cost [19]. Compared with flexible sub-
strates such as Cu or Al foil, SS has better chemical stability, is
more suitable for annealing at a high temperature, and is easily
compatible with flexible electronic devices [20, 21].
Failures in LiCoO
2
films, such as delaminations, wrinkles,
or cracks, often occur after post-annealing. The cracks cause
short circuits when the solid electrolyte and lithium anode are
deposited subsequently during TFLB fabrication. So it is
obvious to optimize annealing parameters of the LiCoO
2
films
to improve the discharge capacity or cycle life of TFLBs. In
addition, some annealing works on LiCoO
2
in Table I in-
troduce the following four annealing parameters [6, 8, 21, 22,
23, 24, 25, 26, 27, 28]. First, both pure oxygen and air
environments are preferred annealing ambiences. Second,
a low annealing temperature (,600 °C) can reduce film cracks
or by-products; however, insufficient heating (,400 °C) leads
ª Materials Research Society 2019 cambridge.org/JMR 1
j Journal of Materials Research j www.mrs.org/jmr
FOCUS ISSUE
Downloaded from https://www.cambridge.org/core. La Trobe University, on 27 Oct 2019 at 05:00:57, subject to the Cambridge Core terms of use, available at https://www.cambridge.org/core/terms. https://doi.org/10.1557/jmr.2019.299
to poor crystallization, which results in poor cycle ability. Last,
a time-saving method is adopted to reduce the interface side
reaction for holding time and heating rate. All of the articles
mentioned in Table I is beneficial to the optimal annealing of
LiCoO
2
films on flexible SS. However, each article only
discusses one annealing parameter, while a reasonable anneal-
ing process considering the combined effects of four annealing
parameters is performed here.
This article introduces a systematic investigation of the
effects of the post-annealing process on LiCoO
2
films grown by
MS. The effects of annealing ambiences, temperatures, holding
times, and heating rates are compared in terms of composi-
tions, surface morphologies, crystal structures, and charge/
discharge performances. Then, an optimum annealing process
for LiCoO
2
films is obtained and this work provides compre-
hensive support for the annealing of LiCoO
2
films.
Results and discussion
Annealing atmosphere
The compositions of these LiCoO
2
films ann ealed u nder
different atmospheres are detected by X-ray photoelectron
spectroscopy (XPS). The contaminated carbon (C 1s,284.8
eV) in Fig. 1(a) is used to c alibrate the positions of other
elements. In Fig. 1(b), Li signals at the binding en ergy of 60.9
eV represent LiC
6
[27], which is a compound with surface-
contaminated carbon; this p roduct exists in other annealing
conditions too. However, Li signals under rough v acuum exist
in the form of Li
2
CO
3
at 55.6 eV, and Li
2
CO
3
may be formed
by the reaction between Li
2
O precipitated from film and H
2
O
and CO
2
in air. The other Li signals are LiOH at 54.2 eV,
formed by the reaction between Li
2
Oprecipitatedfrom
LiCoO
2
and H
2
O in air [24]. Figure 1(c) expresses the same
Co s ignal s of Co 2p
3/2
(BE 5 77 9.9 eV) and Co 2p
1/2
(BE 5
796.4 eV) in any an nealing atmosphere, and the correspond-
ing products are Co
3
O
4
and CoO impurity phases [29, 30].
The peaks of O 1s signals for different samples are also the
same in Fig. 1(d). One peak corresponds to LiCoO
2
at 531.1
eVandtheotherisCo
3
O
4
at 529.4 eV, with the removal of Li
element d uring annealing, and th e signal of Co
3
O
4
increases
[31, 32]
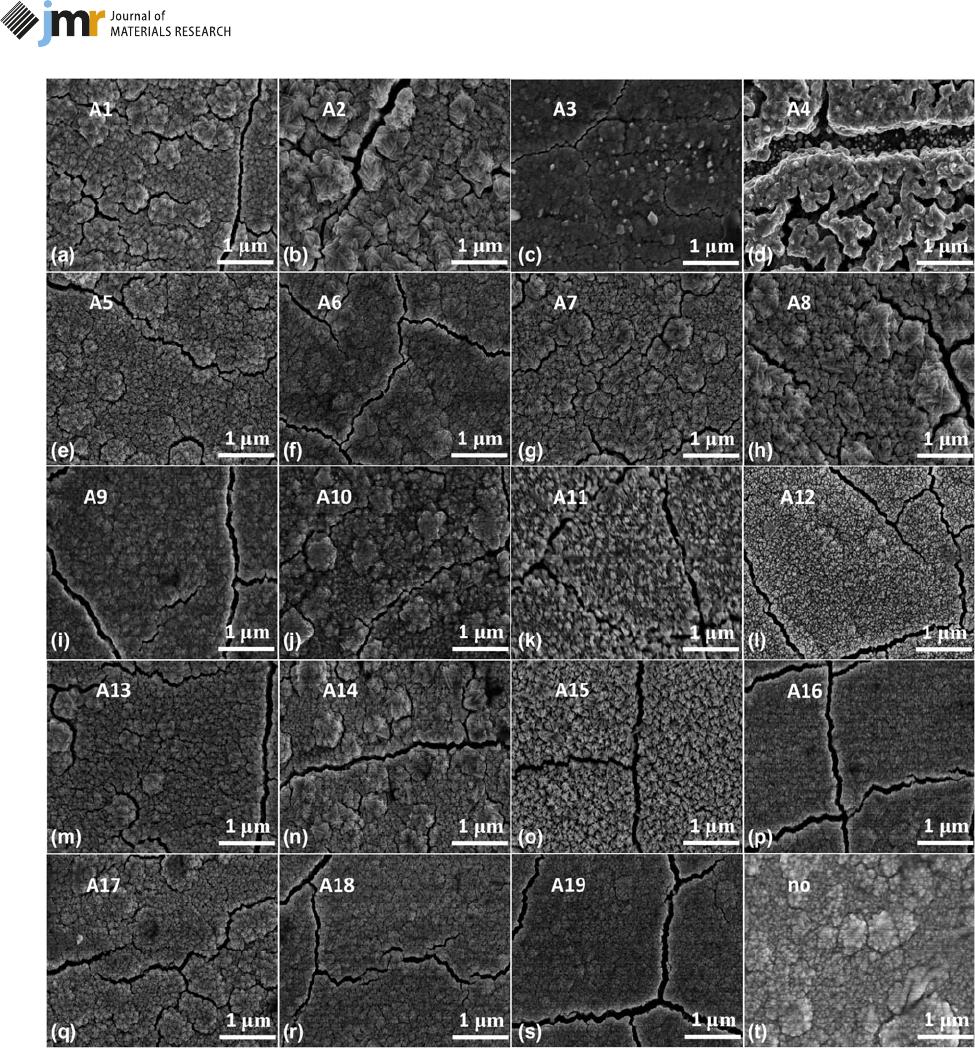
The SEM images of the annealed LiCoO
2
films are shown
in Fig. 2. The surface of any annealed LiCoO
2
films [as shown
in Figs. 2(a)–2(s)] exhibits the network cracks, and the
average width of the crack is ;100 n m. Particularly, sample
A4 annealed under pure vacuum [Fig. 2(d)] expresses more
obvious c rack topography with a width more than ;400 nm.
In fact, all the cracks are introduced by the thermal stress
(r
thermal
) during the cooling down process, and r
thermal
is
calculated by the difference in thermal expansion coefficient
between the LiCoO
2
film and SS according to formula (1) [33,
34, 35]. Once the thermal stress exceeds the load limitation,
more interface cracks are generated to release the excessive
thermal stress [21, 36, 37]. For example, r
thermal
in the
LiCoO
2
film annealed at 650 ° C is equal to 0.78 GPa
(compressive stress); the film’ sstressis0.18GPalargerthan
that of the sample annealed at 500 °C. Especially, the un-
annealed film is uniformly continuous without any cracks, but
several large particles with diameter of ;500 nm distribute on
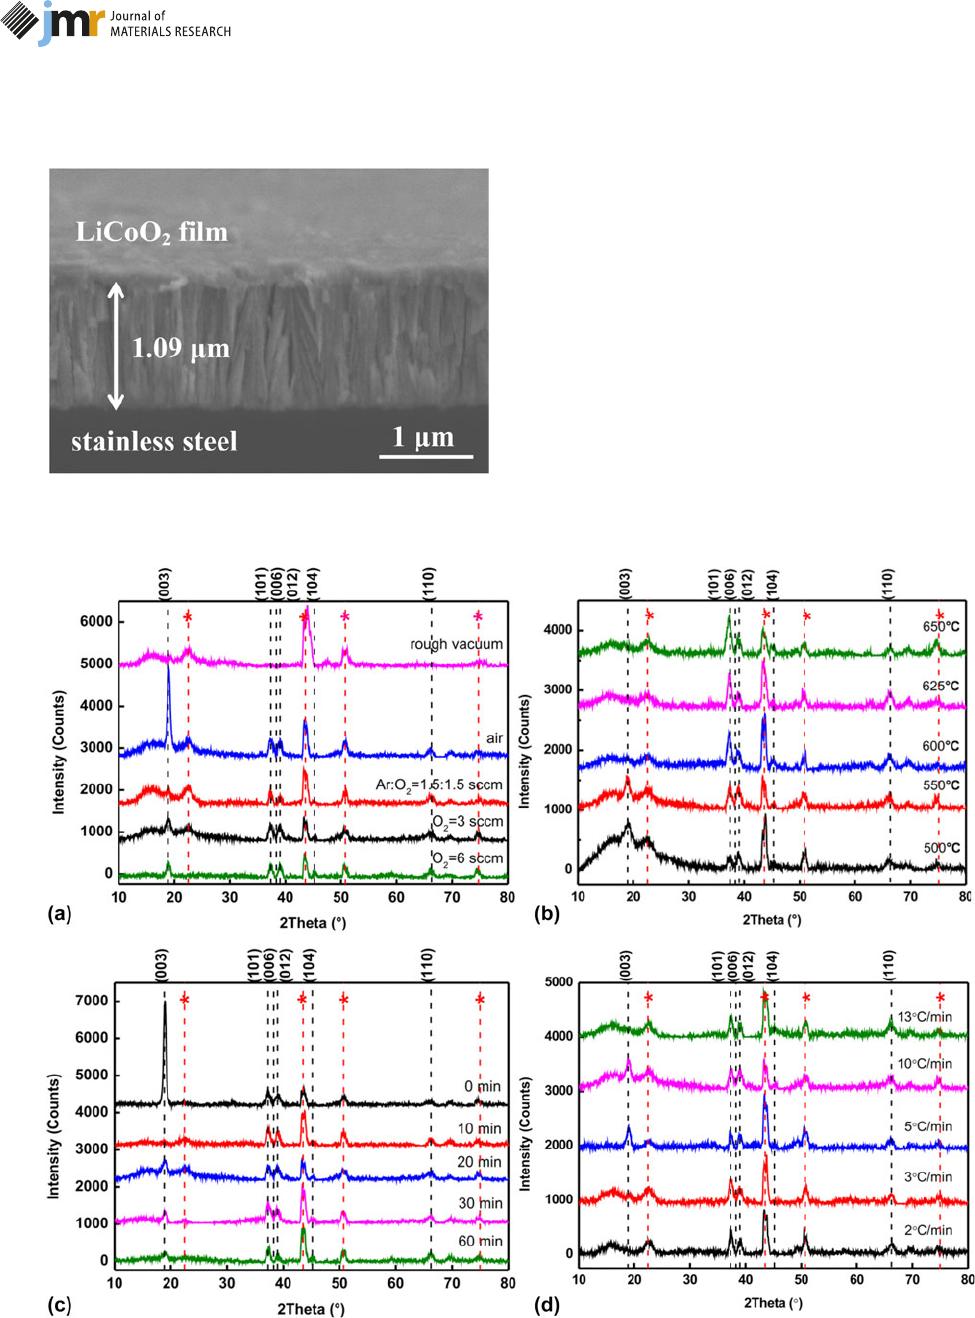
the surface according to Fig. 2(t). Moreover, Fig. 3 shows
a cross-sectional image of the LiCoO
2
films on SS; the
annealed LiCoO
2
films possess the traditional columnar
crystal structure and the film thickness is ;1.09 lm, consistent
with the measured thickness of 1.1 lm using a profilerTencorP
7, KLA (keeping looking ahead) Co., Chandler, Arizona.
r
thermal
¼ Y
LiCoO
2
=1 m
LiCoO
2
a
LiCoO
2
a
SS
ðÞDT ; ð1Þ
where the thermal expansion coefficient of LiCoO
2
a
LiCoO
2
ðÞis
1.3 10
5
K
1
, a
SS
is 1.8 10
5
K
1
, and Young’s modulus
Y
LiCoO
2
ðÞand Poisson’s ratio m
LiCoO
2
ðÞof LiCoO
2
are 191 GPa
and 0.24, respectively [38].
All the LiCoO
2
films annealed in pure oxygen ambiences,
such as A1, A2, and A5 in Figs. 2(a), 2(b), and 2(e), form
triangular-shaped grains and the average grain size is
;100 nm. This triangular shape is probably due to the strong
(001) preferential plane [39]. For the LiCoO
2
film annealed
under air (A3) in Fig. 2(c), grains are uniformly granular
shaped and the average size also approaches 100 nm. However,
sample A4 annealed in rough vacuum shows loosely packed
worm-like particles and large amounts of voids or cracks
[Fig. 2(d)]. These are not typical morphologies of the crystal-
lized LiCoO
2
structure.
TABLE I: Previous annealing parameters for LiCoO
2
thin films.
Annealing parameters Type or range Function Reference
Annealing atmosphere Ar/O
2
mixture, air, O
2
, Ar,
rough vacuum
Influencing the film composition. Pure O
2
—better LiCoO
2
performance;
pure Ar—dehydrated LiCoO
2
; Air—poor LiCoO
2
performance
[3, 13, 21]
Annealing temperature 400–750 °C T . 700 °C—Li is missing, Co
3
O
4
impurity phase, and a serious side
reaction occurs; T , 400 °C— a spinel type (LT-LiCoO
2
);
T 5 550 °C–600 °C—an ideal layered structure
[13, 14, 15, 16]
Holding time 0–120 min Determining the crystal structure [6, 17]
Heating rate 1–600 °C/min Controlling the interface side reactions [5, 18, 19]
Article
ª Materials Research Society 2019 cambridge.org/JMR 2
j Journal of Materials Research j www.mrs.org/jmr
Downloaded from https://www.cambridge.org/core. La Trobe University, on 27 Oct 2019 at 05:00:57, subject to the Cambridge Core terms of use, available at https://www.cambridge.org/core/terms. https://doi.org/10.1557/jmr.2019.299
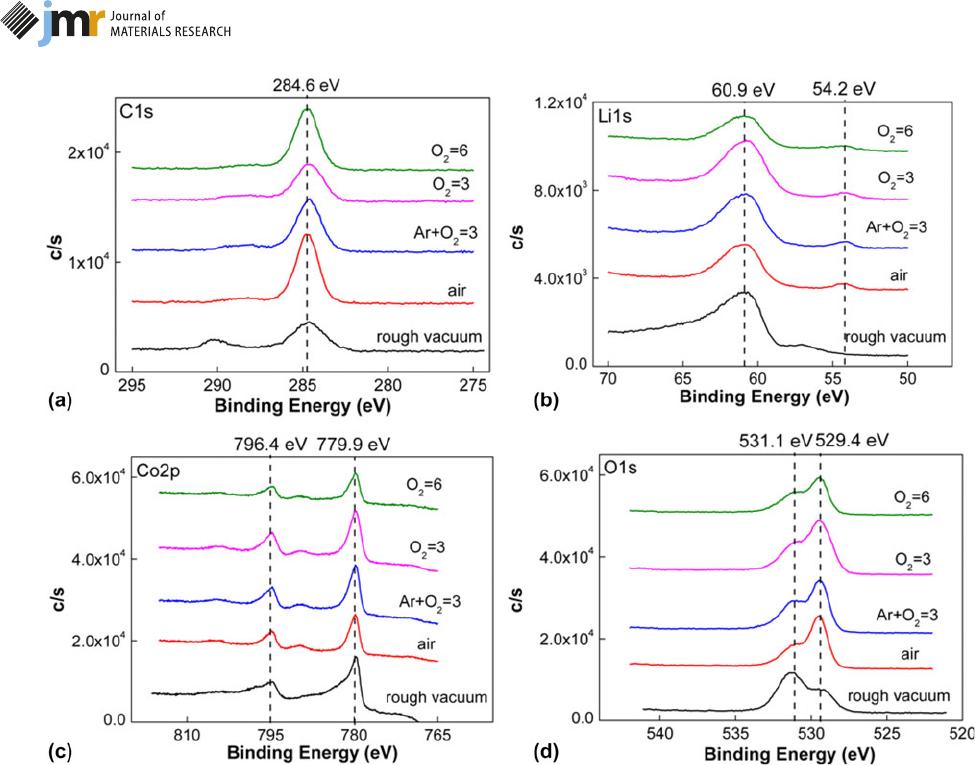
Figure 4(a) presents the XRD patterns of the LiCoO
2
films
annealed at various atmospheres. The diffraction peaks are
located at 2h 5 19.2°, 37.3°, 39.0°, 45.3°, and 66.1°, corre-
sponding to the (003), (101), (012), (104), and (110) crystal
planes of the LiCoO
2
film [7]. Here, (003) stands for a layered
structure and (104) identifies a basic unit Co–O–Co in the
layered LiCoO
2
structure. Additional four positions particularly
marked by the asterisk (*) stand for MoNi
4
(PDF 65-5480)
from SS during the annealing process [21]. The sample
annealed in air shows (003) preferred plane especially; the
other samples are polycrystalline. The relative intensity of the
(003) peak gradually increases and the intensity of the (104)
peak begins to appear with the enhancement of O
2
content,
which declares that the oxygen-rich environment contributes to
LiCoO
2
crystallization. Due to the formation of oxygen
vacancies during the annealing process, the increase in oxygen
vacancies is against the formation of dense (003) grains, but
tends to form (101) and (104) grains. So the efficient oxygen
content in the annealing environment is necessary because
excess oxygen atoms on the LiCoO
2
surface are first taken away
and then a large number of oxygen atoms at the grain
boundary position are driven into the film surface to form an
oxide layer, causing an increase in oxygen vacancies inside the
films.
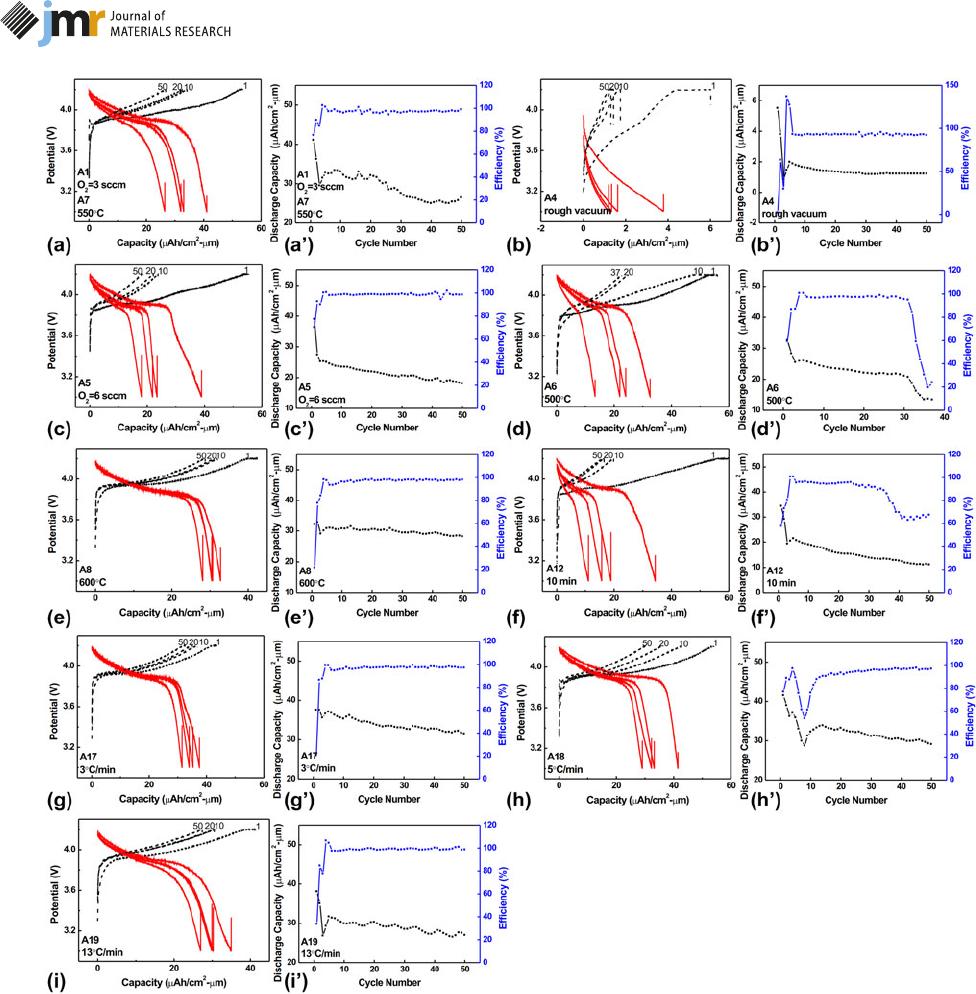
It should be mentioned that the initial open-circuit
potential is ;2.8 V when the LiCoO
2
half-cells are assembled.
Charge/discharge curves and cycle performance are presented
in Fig. 5. The annealed LiCoO
2
films show the same trend: the
discharge capacity decays abruptly during the initial four cycles
and then decreases slowly, which is testified by the columbic
efficiency values. In the case of two samples annealed in O
2
5 3
sccm and O
2
5 6 sccm, the discharge curves in Figs. 5(a) and
5(c) show a typical discharge platform in the range of 3.8–4.0
V, and the discharge capacity decreases with ;0.1 lA h/(cm
2
lm) per cycle as shown in Figs. 5(a9) and 5(c9), the sample
treated with O
2
5 3 sccm has the 1st discharge capacity of
41.06 lA h/(cm
2
lm) and the 50th capacity retention ratio of
64.34%, and the sample treated with O
2
5 6 sccm has the
corresponding values of 38.96 lA h/(cm
2
lm) and 46.25%.
However, the discharge curve slopes down without any
plateaus in Fig. 5(b) for the sample annealed under rough
vacuum, its 1st discharge capacity is only 5.51 lA h/(cm
2
lm),
Figure 1: Surface composition of LiCoO
2
films under different annealing atmospheres: (a) C 1s, (b) Li 1s, (c) Co 2p, and (d) O 1s signals. Atmosphere types are
added next to the curves.
Article
ª Materials Research Society 2019 cambridge.org/JMR 3
j Journal of Materials Research j www.mrs.org/jmr
Downloaded from https://www.cambridge.org/core. La Trobe University, on 27 Oct 2019 at 05:00:57, subject to the Cambridge Core terms of use, available at https://www.cambridge.org/core/terms. https://doi.org/10.1557/jmr.2019.299
and the 50th discharge capacity is 1.21 lAh/(cm
2
lm); this low
capacity can be explained by decomposing of the formed LiCoO
2
to an Li-deficient phase (Li
0.62
CoO
2
) or to the spinel hetero-
phase due to the lack of oxygen during annealing. The presence
of the above phases makes LiCoO
2
capacity to attenuate fast
during charging in a wide range of voltages (3.6–4.2 V) [24].
Furthermore, the LiCoO
2
films annealed in Ar/O
2
mixed gas or
air atmosphere are unable to charge to 4.2 V because an unstable
secondary phase of LiCoO
2
forms and this disturbs Li
1
migration. In addition, the formation of the Co
3
O
4
impurity
phase during the annealing process also deteriorates the electro-
chemical properties of LiCoO
2
[22, 40]. According to the above
charge/discharge curves, the annealing atmosphere of pure O
2
is
confirmed prior to the other process parameters.
Annealing temperature (T)
The effects of different T on the surface topographies are
shown in Figs. 2(f)–2(j). Sample A6 that annealed at 500 °C
contains uniformly granular grains with a small size of ;30 nm
Figure 2: SEM images of the LiCoO
2
films annealed with different atmospheres, temperatures, holding times, and heating rates from (a) to (s), and (t) represents
an un-annealed LiCoO
2
film.
Article
ª Materials Research Society 2019 cambridge.org/JMR 4
j Journal of Materials Research j www.mrs.org/jmr
Downloaded from https://www.cambridge.org/core. La Trobe University, on 27 Oct 2019 at 05:00:57, subject to the Cambridge Core terms of use, available at https://www.cambridge.org/core/terms. https://doi.org/10.1557/jmr.2019.299
as shown in Fig. 2(f); LiCoO
2
grains become triangular once
the T reaches 550 °C and the corresponding grain size increases
to ;50 nm as shown in Fig. 2(g). Moreover, the average
LiCoO
2
grain size increases by ;35 nm for every 50 °C
increment between 550 and 650 °C. Some micro-cracks with
a length of 200–500 nm appear as the T increases. Thermal
stress in sample A6 (500 °C) is compressive and the stress value
is 0.66 GPa, 0.13 GPa less than that in A10 (650 °C). This
excessive stress may be released in the form of micro-cracks.
Figure 4(b) presents the XRD diagrams of the LiCoO
2
films
annealed at different T.Allofthesefilms are crystallized and
a hexagonal phase with a space group of R
3m is obtained. The
(003) plane disappears when the T exceeds 550 °C, while the other
peaks exist in the range of 500–650 °C. In addition, the intensities
of (101) and (104) peaks relative to substrate signals increase
slightly with the elevated T, which indicates the LiCoO
2
films
tend to be crystallized in (101) and (104) facets and the
crystallization degree becomes better on a SS substrate [12,
19]. The preferred textures block Li
1
diffusion s ince no Li
1
channel is accessible on the film surface [41]. Especially, the
Figure 3: SEM image of the fractured cross section of the LiCoO
2
film grown
on SS substrate, annealed at 550 °C under a pure oxygen environment.
Figure 4: XRD patterns of LiCo O
2
films annealed at different (a) annealing atmospheres, (b) temperatures, (c) holding times, and (d) heating rates. Crystal patterns
in LiCoO
2
are marked with the black dashed line and substrate signals are marked by the red dotted line. Different annealing conditions are added next to the
curves.
Article
ª Materials Research Society 2019 cambridge.org/JMR 5
j Journal of Materials Research j www.mrs.org/jmr
Downloaded from https://www.cambridge.org/core. La Trobe University, on 27 Oct 2019 at 05:00:57, subject to the Cambridge Core terms of use, available at https://www.cambridge.org/core/terms. https://doi.org/10.1557/jmr.2019.299
sample annealed at 650 °C shows a slight splitting at the (104)
peak position, which indirectly reflects that the grain is
distorted here, and the Li
1
lacking phase may occur due to
severe evaporation of Li
1
atoms when T is too high [21, 29].
Moreover, Jeon et al. point out that the interface side reaction
between LiCoO
2
films and SS occurs using XRD di agrams of
different T.WhenT increases to 700 °C, the reflections of
Fe
2
O
3
,Fe
3
O
4
,andCoCrO
4
compounds are observed [12, 21].
An AES spectrum and an auger depth pro file in Fig. 6 are
used to indicate the inter-diffusion between LiCoO
2
and SS
[42]. Using SS as substrates, elements from both LiCoO
2
and SS
can diffuse into each other. The LiCoO
2
films become semi-
conducting due to Fe, Cr doping [17, 18], while SS is lightly
oxidized by O atoms from LiCoO
2
. Figure 6(a) shows the AES
spectrum obtained from the LiCoO
2
film surface. It consists of
Li, Co, and O at the surface. The auger peak of Li1 (39 eV) is
particularly affected by Fe
4
(50 eV) and Co
4
(57 eV), and the Li
element signal cannot be deducted from Co and Fe during
post-data processing. An auger depth profile of the annealed
LiCoO
2
films is shown in Fig. 6(b); it clearly shows that the
stoichiometric ratio of Li:Co:O is stable at ;1:1:2 in the LiCoO
2
film zone. Fe, Cr elements also have a steady concentration in
the SS substrate zone. However, Li, Co, O, Fe, and Cr in the
transition zone between LiCoO
2
and SS vary with the
Figure 5: The (a)–(i) charge/discharge curves and corresponding (a‘)–(i‘) cycle performance of LiCoO
2
films annealed at different atmospheres, temperatures,
holding times, and heating rates, and these annealing parameters are marked at the lower left corner.
Article
ª Materials Research Society 2019 cambridge.org/JMR 6
j Journal of Materials Research j www.mrs.org/jmr
Downloaded from https://www.cambridge.org/core. La Trobe University, on 27 Oct 2019 at 05:00:57, subject to the Cambridge Core terms of use, available at https://www.cambridge.org/core/terms. https://doi.org/10.1557/jmr.2019.299
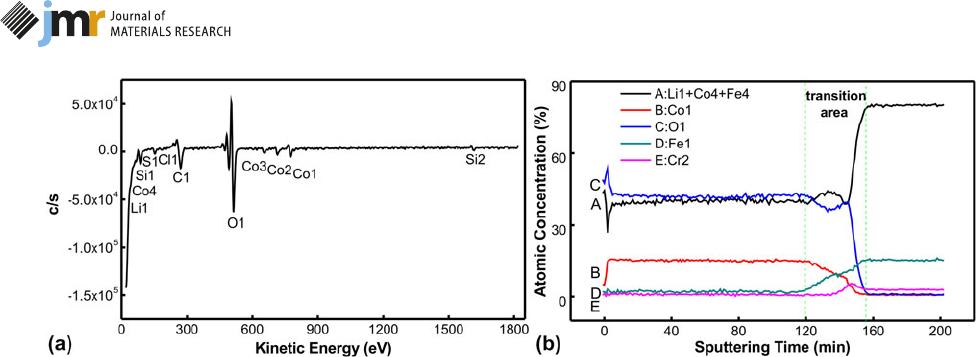
sputtering depth. The content of Li
1
1 Co
4
1 Fe
4
has
a complex diversification; the decline curve in the initial stage
is mainly caused by Li, Co reduction; and the latter sharp
increment is caused by the Fe content from SS. The Co
1
atomic
content decreases linearly from 15 to 0% with the increased
sputtering depth. The O
1
signal decreases slowly from 41 to
37% at the initial 2/3 stage and then decays to nearly 0. Fe
1
and
Cr
2
increase linearly from 2% to 15% and 0% to 4% with
sputtering depth, respectively.
So the diffusion of impurity from the SS substrate into
LiCoO
2
is the main reason for the destruction of the compo-
sition of LiCoO
2
and it also reduces LiCoO
2
discharge capacity.
The films obtained at 500 °C in Fig. 5(d) express a short
discharge platform near the 3.8 V position, which may
correspond to an unexpected Li
x
Co
2
O
4
phase, whose structure
falls between the ideal layered structure and the ideal spinel
structure [13]. In addition, cycle stability of the sample at
500 °C only lasts 37 times because the large LiCoO
2
surface
roughness results in uneven current density distributions,
which may lead to lithium dendrite and short circuits. The
1st and 37th discharge capacities are 32.53 lA h/(cm
2
lm) and
13.37 lA h/(cm
2
lm), respectively. This short-circuit is figured
out according to its columbic efficiency in Fig. 5(d9). The half-
cell assembled by the sample A6 can only cycle 37 times
normally; it stays in a charge state but do not discharge when
reaching the cutoff voltage at the 38th cycle. In addition, the
columbic efficiency of this half-cell remains at 97% for 31
cycles and it decays to 24% from the 31st cycle to 38th cycle.
The formation of lithium dendrite may cause short-circuits
because the declination of columbic efficiency along with the
cycle numbers reflects the formation of lithium dendrite [5].
Furthermore, both the short discharge platform and limited
cycle life indicate that 500 °C cannot meet the perfect
crystallization of LiCoO
2
films. It is necessary to increase T
or extend the holding time further. As T increases to 550 or
600 °C, the initial discharge capacity is equal to 41.06, 32.05 lA
h/(cm
2
lm) separately, and the highest discharge capacity
retention ratio equals to 64.34%, 87.69% at the 50th cycle, as
shown in Figs. 5(a), 5(a9), 5(e), and 5(e9). Particularly, the
LiCoO
2
films annealed at T . 625 °C have the discharge
capacity of ;0; this may be a result of the LiCoO
2
component
destruction caused by inter-diffusion or severe side reactions.
Holding time and heating rate
The interface diffusion between LiCoO
2
and SS is inevitable
during the annealing process. This partially changes the LiCoO
2
composition and impairs the discharge capacity of the LiCoO
2
cathodes severely. However, the interface diffusion can be
controlled by tuning the holding time and heating rate. The
surface particles on the sample A11 without heat preservation (0
min) in Fig. 2(k) are in an irregular shape and are packed-up
together. While the sample A12 annealed at 550 °C, holding for
10min[asshowninFig.2(l)]formsaregulargranulargrain
shape, but the average grain size is smaller than 30 nm. Besides,
thegrainshapetransformsintoatriangleshapewhentheholding
time exceeds 30 min and the grain size becomes more uniform
with the extended holding time, as shown in Figs. 2(m) and 2(n).
ThesampleA15withthelongestholdingtimeof;120 min
[Fig. 2(o)] corresponds to an average grain size of 100 nm.
Especially, the selected heating rate range (2–13 °C/min) corre-
sponding to Figs. 2(p)–2(s) have no obvious effect on the LiCoO
2
surface morphologies, all of which are uniform and loosely
packed, and the average crack width is ;100 nm [30].
The lattice orientation of LiCoO
2
films annealed with
different holding times and heating rates is given in Figs. 4(c)
and 4(d) individually. Both holding time and heating rate
mostly affect the intensities of the (003) diffraction peak. For
example, the samples with no holding time (0 min) or with
higher heating rates (5 °C/min and 10 °C/min) express distinct
(003) grains, and the intensity of the (003) peak attenuates as
the holding time increases or the heating rate decreases.
In the case of the films grown at different holding times
and diverse heating rates, there exists a holding time or
Figure 6: (a) AES spectrum of LiCoO
2
films surface and (b) auger depth profile of the LiCoO
2
films grown on SS. Different element types are marked with letters A,
B, C, D, and E.
Article
ª Materials Research Society 2019 cambridge.org/JMR 7
j Journal of Materials Research j www.mrs.org/jmr
Downloaded from https://www.cambridge.org/core. La Trobe University, on 27 Oct 2019 at 05:00:57, subject to the Cambridge Core terms of use, available at https://www.cambridge.org/core/terms. https://doi.org/10.1557/jmr.2019.299
a heating rate that corresponds to the best capacity. For the
sample annealed in 10 min in Figs. 5(f) and 5(f9), the discharge
capacity at 1st/50th is equal to 34.31/11.08 lA h/(cm
2
lm),
respectively. Once the holding time exceeds more than 30 min,
the discharge curves quickly reach 3.9 V with cycle numbers.
Battery internal resistance increases with holding time possibly;
the reason for the increased impedance is the loss of Co and the
dislodged structures of LiCoO
2
, and black traces of LiCoO
2
material on the separator in the literature support the claim
[32]. In Figs. 5(g) and 5(g9), the LiCoO
2
sample with a ramping
rate of 3 °C/min has the 1st discharge capacity of 37.56 lAh/
(cm
2
lm) and capacity retention of 83.81% at the 50th cycle,
and the sample annealed with 5 °C/min has the equivalent
values of 41.48 lA h/(cm
2
lm) and 70.07%, as shown in
Figs. 5(h) and 5(h9). The sample annealed with 13 °C/min in
Figs. 5(i) and 5(i9) has the 1st discharge capacity of 38.07 lAh/
(cm
2
lm) and capacity retention of 70.82% at the 50th cycle.
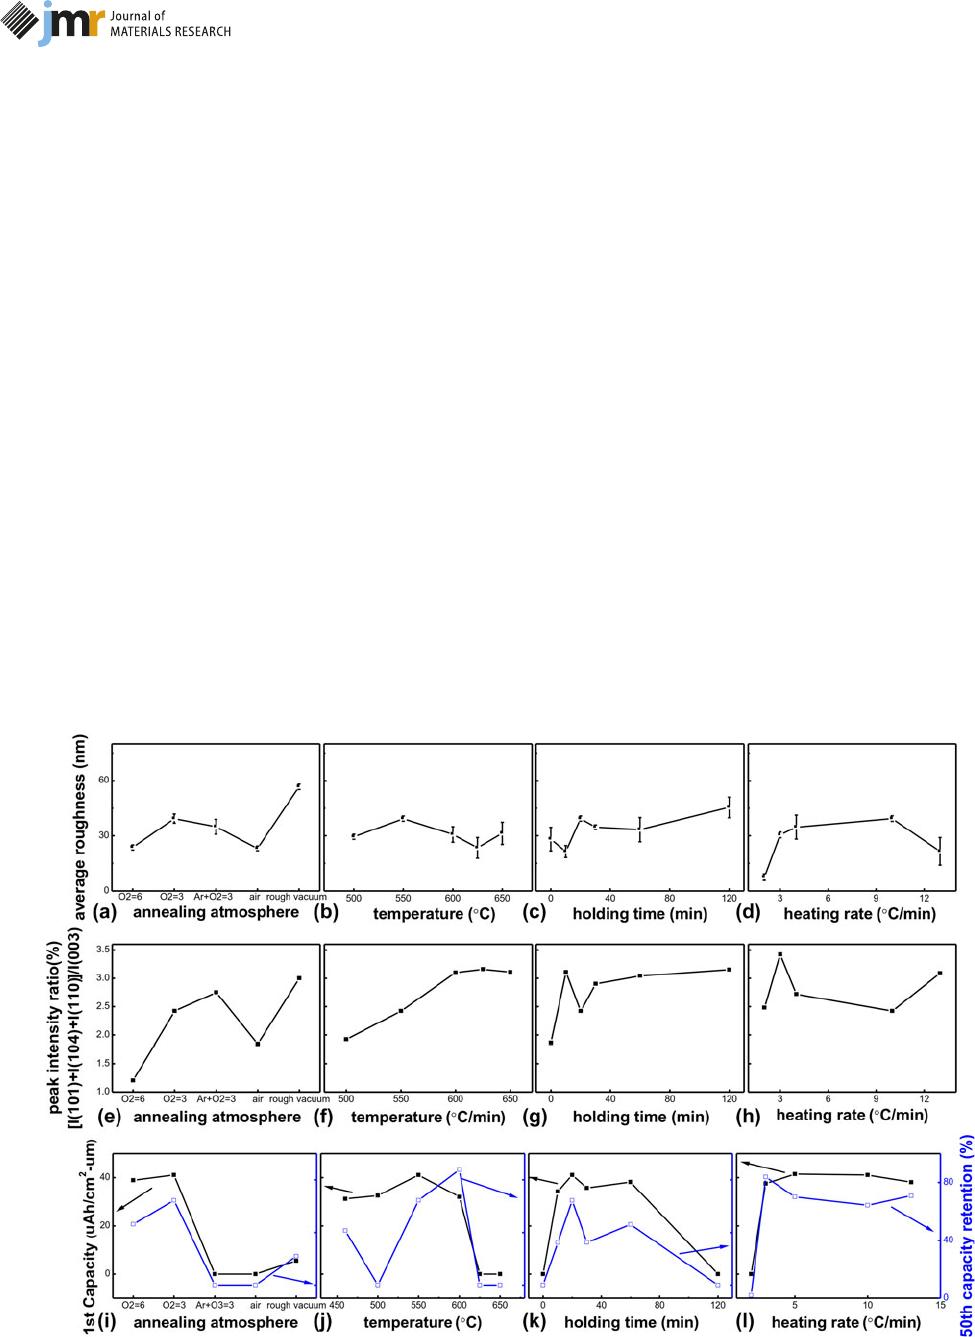
Comparison of the parameters
Since the properties of the LiCoO
2
films strongly correlate with
their compositions, morphologies, and structures, it is neces-
sary to take the synthetic effects into account. Figure 7
summarizes several important parameters: surface roughness,
peak intensity ratio [I
(101)
1 I
(104)
1 I
(110)
]/I
(003)
, the 1st
discharge capacity, and capacity retention rate at the 50th cycle
for selection of the optimum annealing process.
In Figs. 7(a)– 7( d), the average roughness of all the
annealed LiCoO
2
films lies between 10 and 60 nm; this
roughness can be acceptable because the separator thickne ss
(30 lm) is thicker than the roughness. Annealing atmosphere
has the most obvious impact on roughness. The sample
annealed under rough vacuum has the largest roughness of
56.68 6 12.69 nm; the high roughness corresponds to
a large activation area, but more likely leads to battery failure.
The other annealing conditions lead to an average roughness
of ;30 nm.
The value of c/a lies among 4.95–5.00 and reflects the layer
spacing for Li
1
transfer; however, the peak intensity ratio of
[I
(101)
1 I
(104)
1 I
(110)
]/I
(003)
lies between 1.20 and 3.42 with
varied annealing processes, as shown in Figs. 7(e) and 7(f).
Generally, the (101) and (104) planes facilitate de-intercalation
of Li
1
and correspond to a high initial discharge capacity; the
(003) plane can maintain structure stability during the Li
1
transfer process and a long cycle life can be achieved [43, 44,
45], so the ratio of [I
(101)
1 I
(104)
1 I
(110)
]/I
(003)
can reflect the
comprehensive electrochemical performance of LiCoO
2
cath-
odes directly. The maximum c/a value of 4.98 and maximum
Figure 7: Summary of the influences of annealing atmospheres, temperatures, holding times, and heating rates on (a)–(d) surface roughness, (e)–(h) peak
intensity ratio [I
(101)
1 I
(104)
1 I
(110)
]/I
(003)
, and (i)–(l) the 1st discharge capacity (solid point) and the 50th capacity retention ratio (hollow point).
Article
ª Materials Research Society 2019 cambridge.org/JMR 8
j Journal of Materials Research j www.mrs.org/jmr
Downloaded from https://www.cambridge.org/core. La Trobe University, on 27 Oct 2019 at 05:00:57, subject to the Cambridge Core terms of use, available at https://www.cambridge.org/core/terms. https://doi.org/10.1557/jmr.2019.299
ratio [I
(101)
1 I
(104)
1 I
(110)
]/I
(003)
of 3.42 are preferred for the
LiCoO
2
crystal structure.
Electrochemical performance of the LiCoO
2
filmsisthe
combined effect of the film’s composition and structure. The 1st
discharge capacity and 50th capacity retention are two key
indicators for LiCoO
2
annealing works, and their change trends
arerelatedtothechangeruleoftheratioof[I
(101)
1 I
(104)
1
I
(110)
]/I
(003)
. In Figs. 7(i)–7(l), the normal value of the 1st
discharge capacity is at 32.05–41.48 lAh/(cm
2
lm), which is
lower than the theoretical value of 69 lAh/(cm
2
lm) [46]; this is
mainly caused by the diffusion and contamination from SS
substrates. The 50th capacity retention varies between 32.28 and
87.69%; some annealed samples can be confirmed to behave
a long cycle life according to the index of 80% capacity retention.
An optimum annealing process (pure O
2
, 550 °C, 20 min, and
3 °C/min) for large-scale LiCoO
2
filmsisproposedthrough
comparison with these characteristic values (as shown in Fig. 7),
corresponding to the initial discharge capacity of 37.56 lAh/(cm
2
lm) and capacity retention at the 50th cycle of 83.81%.
Conclusions
The crystal LiCoO
2
cathode on a flexible SS has been successfully
obtained by annealing with a traditional tube furnace. According
to the different annealing conditions, a pure oxygen annealing
atmosphere is confirmed first because the LiCoO
2
composition
ratio is the basis. T is the second important factor for an ideal
layered form of LiCoO
2
cathode because T can directly change the
crystal structures. After T ensures LiCoO
2
crystallization, the
holding time needs to be chosen to be as short as possible to limit
the SS oxidation and inter-diffusion, and it is equivalent to cutting
down the holding time or accelerating the heating rate to optimize
the LiCoO
2
annealing process.
In the end, LiCoO
2
films annealed at 550 °C for 20 min
under pure oxygen (O
2
5 3 sccm, 3.5 Pa) and with a heating rate
of 3 °C/min show the optimum electrochemical performance in
our system. The initial discharge capacity is 37.56 lAh/(cm
2
lm)
and the capacity retention at the 50th cycle is 83.81%.
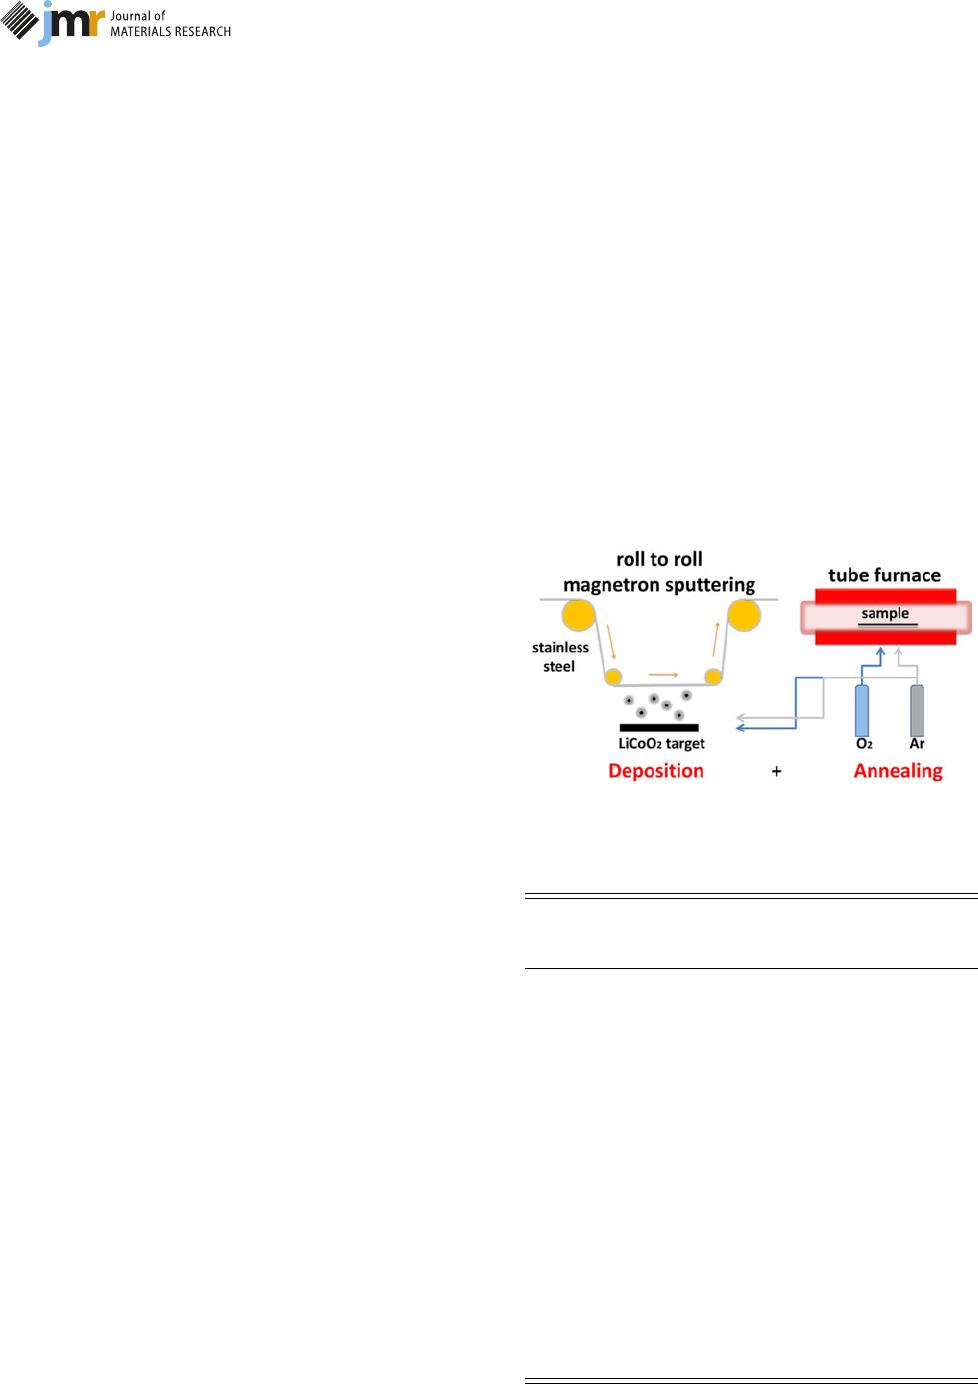
Experimental
LiCoO
2
film deposition and annealing
A roll of SS (SUS304) with dimension of 2.0 0.5 m was, first,
wiped with ethanol to remove surface contaminants and release
residual stress. The nominal thickness equaled to 0.03 mm and
the density was 7.93 g/cm
3
. The preparation and annealing
process are shown in Fig. 8; the LiCoO
2
films were fabricated
by MS with a power density of 4 W/cm
2
and the working
pressure during the whole deposition was 1.0 Pa. A uniform
film thickness of 1.1 lm was achieved by controlling the
dynamic deposition rate and deposition time. In fact, the film
thickness actually equals to 1.09 lm by calibration of the cross-
section image, and the deposited LiCoO
2
film had an areal
loading of 0.28 mg/cm
2
. The as-grown LiCoO
2
films were
annealed according to the annealing parameters shown in
Table II. Among them, the annealing experiment marked with
A1 acted as reference and the other experiments changed only
one parameter once based on A1.
Half-cell assembly and electrochemical
performance test
The half-cells were assembled with an Li foil as a counter-
electrode and 0.5 M LiPF
6
in an EC and DMC mixture solvent
(volume ratio is 1:1). The used polyethylene (PE) separator was
purchased from Linyi Gelon New Battery Material Co., Ltd.,
Shandong, China. This separator was prepared by a dry stretching
method, the holes on its surface were elliptical shapes with the long
Figure 8: Schematic diagram of LiCoO
2
film deposition and annealing.
TABLE II: LiCoO
2
film thermal treatment parameters.
Category
Batch
number
Annealing
atmosphere
(sccm)
Annealing
temperature
(°C)
Holding
time
(min)
Heating
rate (°C/
min)
Reference A1 O
2
=3 550 20 10
Annealing
atmosphere
A2 Ar:O
2
=
1.5:1.5
550 20 10
A3 Air 550 20 10
A4 Rough
vacuum
550 20 10
A5 O
2
=6 550 20 10
Annealing
temperature
A6 O
2
5 3 500 20 10
A7 O
2
5 3 550 20 10
A8 O
2
5 3 600 20 10
A9 O
2
5 3 625 20 10
A10 O
2
5 3 650 20 10
Holding
time
A11 O
2
5 3 550 0 10
A12 O
2
5 3 550 10 10
A13 O
2
5 3 550 30 10
A14 O
2
5 3 550 60 10
A15 O
2
5 3 550 120 10
Heating rate
A16 O
2
5 3 550 20 2
A17 O
2
5 3 550 20 3
A18 O
2
5 3 550 20 5
A19 O
2
5 3 550 20 13
Article
ª Materials Research Society 2019 cambridge.org/JMR 9
j Journal of Materials Research j www.mrs.org/jmr
Downloaded from https://www.cambridge.org/core. La Trobe University, on 27 Oct 2019 at 05:00:57, subject to the Cambridge Core terms of use, available at https://www.cambridge.org/core/terms. https://doi.org/10.1557/jmr.2019.299

side of ;80 nm and width of ;30 nm, and its average thickness
was confir med to be 30 6 2 lm. Additionally, the electrolyte
amount was strictly controlled by a pipettor (MicroPette, 100–500
lL, Dragon Laboratory InstrumentsLtd.,Beijing,China),and
a total of 200 lL electrolyte were controlled for each half-cell. The
charge/discharge test was preceded on a LAND machine
(CT2001A, Wuhan LANDHE Electronic Co., Ltd., Wuhan, China)
using a constant current density of 16 lA/cm
2
between 3.0 and
4.2 V in a glove box. Especially, the initial discharge capacity and
the capacity retention rate at the 50th cycle were chosen as
selection standards for the charge/discharge performance.
Film characterization
Film crystal structure was investigated using a grazing incidence
X-ray mode diffractometer (XRD-SmartLab, Rigaku Co., Tokyo,
Japan; Cu K
a1
radiation, k 5 0.15405 nm, an X-ray tube voltage
of 40 kV, a tube current of 15 mA) in order to minimize
interference from substrates. The measurement procedure fixed
the incident angle at 5° with respect to substrate surface and
restricted scanning interval of 10° # 2h # 80°. And then, the
original XRD data were made by background correction and K
b
stripping. The surface morphology of each annealed LiCoO
2
film
was probed by using a field emission scanning electron micro-
scope (FESEM; SU 8010, Hitachi, Ltd., Tokyo, Japan), and the
surface roughness was detected by using an atomic force
microscope (AFM-Dimension Edge, Bruker Co., Karlsruhe,
Germany); a tapping mode and five measurement positions were
selected to calculate average roughnessanditsstandarddeviation.
X-ray photoelectron spectroscopy (XPS; SXM PHI Quantera SXM,
ULVAC PHI, Inc., Kanagawa, Japan) was adopted to analyze
surface element types and valence states. Testing conditions were
as follows: a hemispherical energy analyzer and monochromatic
Al target were chosen to detect C, Li, Co, O element signals; the
X-ray beam had a spot size of 200 lmandwasfixed with an
incident angle of 45°. The binding energy positions of different
elements were calibrated by the contaminated carbon position
(C 1s,284.8eV),andthepeakfitting procedure was performed
by a nonlinear fitting method. At the same time, the AES
measurements were performed on the annealed LiCoO
2
films by
using the scanning auger microscope (Phi-700, ULVAC-PHI, Inc.,
Kanagawa, Japan). The electron gun sets a high voltage of 5 kV
and an incident angle of 30°. The analytical chamber vacuum is
lowerthan5.2 10
7
Pa, the sputtering gun uses Ar
1
,andthe
sputtering rate is 14 nm/min for SiO
2
.
Acknowledgments
The authors gratefully acknowledge the financial support of
the National Natural Science Foundation of China (Grant Nos.
21603204 and 51702305).
References
1. Y.S. Yoon, C.H. Park, and J.H. Kim: Lattice orientation control of
lithium cobalt oxide cathode film for all-solid-state thin film
batteries. J. Power Sources 226, 186 (2013).
2. H. Castaneda: The impedance response of different mechanisms
for LiCoO
2
/acetylene carbon electrodes in alkaline solutions under
polarization conditions. Electrochim. Acta 112, 562 (2013).
3. J.F. Ribeiro, R. Sousa, J.A. Sousa, L.M. Goncalves, M.M. Silva,
L. Dupont, and J.H. Correia:Flexiblethin-film rechargeab le lithium
battery. In Transducers (IEEE, Barcelona, Spain, 2013); p. 2233.
4. ID TechEx Ltd.: Flexible, printed and thin film batteries 2019–2029
(2018). Available at: https://www.giiresearch.com/report/ix314818-
flexible-printed-thin-film-batteries.html (accessed September 03, 2019).
5. H.S. Lee, S. Kim, K-B. Kim, and J-W. Choi: Scalable fabrication
of flexible thin-film batteries for smart lens applications. Nano
Energy 53, 225 (2018).
6. Z.M. Yang, G.J. Xing, J. Yang, C.H. Mao, and J. Du: Effects of
annealing temperature on structure and electrochemical properties
of LiCoO
2
cathode thin films. Rare Met. 25, 189 (2006).
7. Y.S. Yoon, S.H. Lee, S.B. Cho, and S.C. Nam:Influence of two-
step heat treatment on sputtered lithium cobalt oxide thin films. J.
Electrochem. Soc. 158, A1313 (2011).
8. H.K. Kim and Y.S. Yoon: Characteristics of rapid-thermal-
annealed LiCoO
2
cathode film for an all-solid-state thin film
microbattery. J. Vac. Sci. Technol., A 22, 1182 (2004).
9. H.Y. Park, S.C. Nam, Y.C. Lim, K.G. Choi, K.C. Lee, G.B. Park,
J.B. Kim, H.P. Kim, and S.B. Chao: LiCoO
2
thin film cathode
fabrication by rapid thermal annealing for micro power sources.
Electrochim. Acta 52, 2062 (2007).
10. K.F. Chiu, H.H. Hsiao, G.S. Chen, and H.L. Liu: Structural
evolution and stability of RF sputter deposited Li
x
Mn
2y
O
4
thin
film cathodes. J. Electrochem. Soc. 151, A452 (2004).
11. W.S. Kim: Characteristics of LiCoO
2
thin film cathodes according
to the annealing ambient for the post-annealing process. J. Power
Sources 134, 103 (2004).
12. S.W. Jeon, J.K. Lim, S.M. Lim, and S.M. Lee: As-deposited
LiCoO
2
thin film cathodes prepared by rf magnetron sputtering.
Electrochim. Acta 51, 268 (2005).
13. P.Fragnaud,R.Nagarahan,D.M.Schleich,andD.Vujic:Thin-film
cathodes for secondary lit hium batteries. J. Power Sources 54, 362 (1995).
14. Y.S. Kang, H. Lee, Y.M. Kang, P.S. Lee, and J.Y. Lee:
Crystallization of lithium cobalt oxide thin films by radio-
frequency plasma irradiation. J. Appl. Phys. 90, 5940 (2001).
15. Y.S. Kang, H. Lee, S.C. Park, P.S. Lee, and J.Y. Lee: Plasma
treatments for the low temperature crystallization of LiCoO
2
thin
films. J. Electrochem. Soc. 148, A1254 (2001).
16. British Stainless Steel Association: Heat tint (temper) colors on
stainless steel surfaces heated in air (2016). Available at: https://
www.bssa.org.uk/topics.php?article5140 (accessed September 03,
2019).
Article
ª Materials Research Society 2019 cambridge.org/JMR 10
j Journal of Materials Research j www.mrs.org/jmr
Downloaded from https://www.cambridge.org/core. La Trobe University, on 27 Oct 2019 at 05:00:57, subject to the Cambridge Core terms of use, available at https://www.cambridge.org/core/terms. https://doi.org/10.1557/jmr.2019.299
