
Vol.:(0123456789)
1 3
Theoretical and Applied Genetics
https://doi.org/10.1007/s00122-020-03727-5
ORIGINAL ARTICLE
Genetic diversity ofEthiopian sorghum reveals signatures ofclimatic
adaptation
T.Menamo
1
· B.Kassahun
1
· A.K.Borrell
2
· D.R.Jordan
2
· Y.Tao
2
· C.Hunt
3
· E.Mace
2,3
Received: 18 May 2020 / Accepted: 6 November 2020
© Springer-Verlag GmbH Germany, part of Springer Nature 2020
Abstract
Key message A large collection of Ethiopian sorghum landraces, characterized by agro-ecology and racial-group,
was found to contain high levels of diversity and admixture, with significant SNP associations identified for environ-
mental adaptation.
Abstract Sorghum [Sorghum bicolor L. (Moench)] is a major staple food crop in Ethiopia, exhibiting extensive genetic
diversity with adaptations to diverse agroecologies. The environmental and climatic drivers, as well as the genomic basis of
adaptation, are poorly understood in Ethiopian sorghum and are critical elements for the development of climate-resilient
crops. Exploration of the genome–environment association (GEA) is important for identifying adaptive loci and predicting
phenotypic variation. The current study aimed to better understand the GEA of a large collection of Ethiopian sorghum
landraces (n = 940), characterized with genome-wide SNP markers, to investigate key traits related to adaptation to tem-
perature, precipitation and altitude. The Ethiopian sorghum landrace collection was found to consist of 12 subpopulations
with high levels of admixture (47%), representing all the major racial groups of cultivated sorghum with the exception of
kafir. Redundancy analysis indicated that agroecology explained up to 10% of the total SNP variation, and geographical
location up to 6%. GEA identified 18 significant SNP markers for environmental variables. These SNPs were found to be
significantly enriched (P < 0.05) for a priori QTL for drought and cold adaptation. The findings from this study improve our
understanding of the genetic control of adaptive traits in Ethiopian sorghum. Further, the Ethiopian sorghum germplasm
collection provides sources of adaptation to harsh environments (cold and/or drought) that could be deployed in breeding
programs globally for abiotic stress adaptation.
Introduction
Sorghum (Sorghum bicolor L.[Moench]) is a staple food
crop for smallholder farmers in semiarid regions world-
wide, feeding over 500 million of the world’s most resource
poor (Reddy and Patil 2015). In Ethiopia, sorghum ranks
second after maize in total production (FAOSTAT 2017).
Sorghum, a tropical C4 cereal, is hypothesized to have been
first domesticated in Ethiopia around 8000years ago (House
1985), with a second domestication event thought to have
occurred in West Africa (Mace etal. 2013). It is a versatile
crop used for food, feed, fuel, building materials and alco-
holic beverages (Damon 1962; Paterson etal. 2009). Sor-
ghum is characterized more by diversity than homogeneity
(Blum 2004), with genotypes adapted to different combina-
tions of temperate and tropical climates, high and low alti-
tudes and water stress environments (Maunder 2002; Blum
2004). Specifically, it has developed a range of biochemical,
physiological and morphological adaptation characteristics
Communicated by Hai-Chun Jing.
Electronic supplementary material The online version of this
article (https ://doi.org/10.1007/s0012 2-020-03727 -5) contains
supplementary material, which is available to authorized users.
* E. Mace
1
College ofAgriculture andVeterinary Medicine, Jimma
University, P.O. Box307, Jimma, Ethiopia
2
Queensland Alliance forAgriculture andFood Innovation
(QAAFI), Hermitage Research Facility, University
ofQueensland, Warwick, QLD4370, Australia
3
Department ofAgriculture andFisheries, Hermitage
Research Facility, Agri-Science Queensland, Warwick,
QLD4370, Australia

Theoretical and Applied Genetics
1 3
that contribute to enhancing grain productivity in hot and
dry environments (Borrell etal. 2006, 2020; Paterson etal.
2009). Adaptation to different agroecologies has led to the
evolution of morphologically and geographically distinct
racial groups within cultivated sorghum; bicolor, guinea,
caudatum, kafir and durra, with four of these five basic sor-
ghum types (the exception being kafir) distributed across
Ethiopia (DoggettandHawkes 1991). Durra, the dominant
botanical race in Ethiopia, is known for its adaptation to
drier zones and likely originated in Ethiopia before diffus-
ing westward along the Sahel to West Africa (Harlan and De
Wet 1972). Guinea types are found around the highlands in
southwest Ethiopia (DoggettandHawkes 1991) and exhibit
adaptation to humid zones (Deu etal. 1995; Folkertsma
etal. 2005). Caudatum types are more highly distributed in
the lowland areas of Ethiopia, and bicolor types are distrib-
uted more in high rainfall and highland areas of Ethiopia
(DoggettandHawkes 1991). Inflorescence morphology is a
major component of racial differentiation and agro climatic
adaptation in sorghum, with all five botanical races tradition-
ally identified by mature spikelet types (Harlan and De Wet
1972; House 1985), varying from loose panicle architecture
in guinea types to compact panicle architecture in durra
types (Brown etal. 2011).
Collections of Ethiopian sorghum have been found to
exhibit great genetic diversity (Poehlman 1987; Cuevas and
Prom 2013), and inter-crossable wild and landrace material
has been shown to be a major source of many biotic and
abiotic stress resistance traits (Hajjar and Hodgkin 2007).
However, the natural habitat for wild and landrace sorghum
in Ethiopia is rapidly declining due to increased cultivated
land, urbanization, grazing, introduction of elite varie-
ties and displacement with other crops. A recent study by
Teshome and Feyissa (2013) identified low gene diversity
among a small collection of landraces from East Wollega
and East Shewa in Ethiopia; however, the small sample size
may have contributed to further decreasing the extent of
genetic diversity identified in this study. Ayana etal. (2000)
also reported low genetic variation among 11 wild sorghums
in Ethiopia that were representative of 93 wild sorghum
individuals from five geographical regions of the country.
Another recent study (Adugna 2014) suggested that the
occurrence of drought in some of the major sorghum grow-
ing regions of Ethiopia has reduced the diversity of the crop
over time, with a tendency for farmers in the dry lowlands to
use high yielding improved early maturing sorghum varieties
or shift their production systems to other early maturing crop
species such as tef (Eragrostis tef).
Despite such reports of a potential reduction in diversity
in Ethiopian sorghums, there has been a steady increase
in average grain yield in Ethiopia due to the generation of
improved elite sorghum varieties and improved cultural prac-
tices over the past 10years (FAOSTAT 2017). The continued
exploration and utilization of genetic diversity are a vital
component of maintaining and increasing the rate of genetic
gain made in sorghum breeding programs in Ethiopia. Uti-
lizing genetic diversity also complements related research
and development activities, such as marker–trait association
studies, appropriate sampling procedures for germplasm col-
lection and conservation, and generating core collections
for efficient germplasm management (Moreno-Gonzalez
and Cubero 1993). Additionally, a number of recent studies
have focused on investigating the genetic diversity of culti-
vated Ethiopian sorghum conserved in different countries.
For example, selected Ethiopian accessions maintained by
the USA National Plant Germplasm System (NPGS) have
been genetically characterized using SNP markers (Cuevas
and Prom 2013; Morris etal. 2013; Cuevas etal. 2017),
with studies highlighting the genetically and phenotypically
diverse nature of the Ethiopian sorghum germplasm. These
studies did not, however, explore the patterns of genetic
variability observed in the Ethiopian collections at NPGS
in relation to geographic origin, and associated adaptation
environments. With a changing environment, marked by
increases in average global temperature and erratic pre-
cipitation patterns, an understanding of genetic diversity
distribution relative to environmental variance can provide
opportunities to identify sorghum landraces offering adap-
tive traits for crop improvement (Blum 2010).
Sorghum’s modest diploid genome (~ 730Mbp) compared
with other grass species makes it an ideal system for the
genomic studies of local adaptation (Paterson etal. 2009),
and three recent studies (Lasky etal. 2015; Faye etal. 2019;
Olatoye etal. 2018) have investigated GEA in diverse sor-
ghum populations. These studies identified adaptive loci
and predicted phenotypic variation in West African and
global agroecological zones, indicating that adaptation
to diverse agroecological conditions can be explained by
nucleotide variation. Lasky etal. (2015) identified that such
genome–environment associations reflected local adaptation
at two previously reported genes, Maturity1 and Tannin1
controlling photoperiod sensitive flowering and grain tan-
nins. Specifically, Ma1 was found to be significantly associ-
ated with the minimum temperature of the coldest month
and Tannin1 was found to be significantly associated with
the mean temperature of the warmest quartile. Olatoye etal.
(2018) studied GEA using three climatic variables (annual
mean precipitation, precipitation in the driest quarter and
annual mean temperature) and reported significant cor-
relations with three putative climate-adaptive traits (flow-
ering time, plant height and panicle length). To date, no
GEA studies have been reported in sorghum using altitude.
However, in addition to temperature and precipitation, alti-
tude has been identified as one of the factors determining
the sorghum race pattern distribution in Ethiopia (Stemler
etal. 1977). Another recent study by Wang etal. (2020)
Theoretical and Applied Genetics
1 3
reported that seed mass in sorghum is correlated with prox-
ies of precipitation gradients globally, suggesting that seed
mass is shaped by diversifying selection on drought stress. In
Ethiopia, there are two main cropping seasons: the Belg and
Meher (main) seasons which receive rainfall from February
to June and from June to October, respectively (Reynolds
2008). Some famers prefer late-maturing sorghum lan-
draces (long-cycle landraces), and in such cases, planting
takes place between April and May (to make use of both
rainy seasons), whereas some farmers prefer early maturing
landraces (short cycle landraces), and in these cases, plant-
ing is carried out in July (to make use of the Meher rainy
season) with the subsequent rains or residual soil moisture
(Gebretsadik etal. 2014). However, the genomic basis of
climate adaptation remains poorly understood in Ethiopian
sorghum germplasm. While the Ethiopian Biodiversity Insti-
tute has a large collection of over 10,000 sorghum accessions
from different regions of the country, a large portion of the
genetic diversity in this collection remains uncharacterized.
This study therefore aimed to characterize the extent and
patterns of the genetic diversity across different environ-
ments and to identify genome–environment associations in
Ethiopian sorghum germplasm.
Materials andmethods
Plant materials
A total of 940 diverse sorghum germplasm landraces were
used in this study (Online Resource 1). The genetic material
was obtained from the Ethiopian Biodiversity Institute and
the Ethiopian Institute of Agricultural Research’s Melkassa
Agriculture Research Center in 2015. The collections used
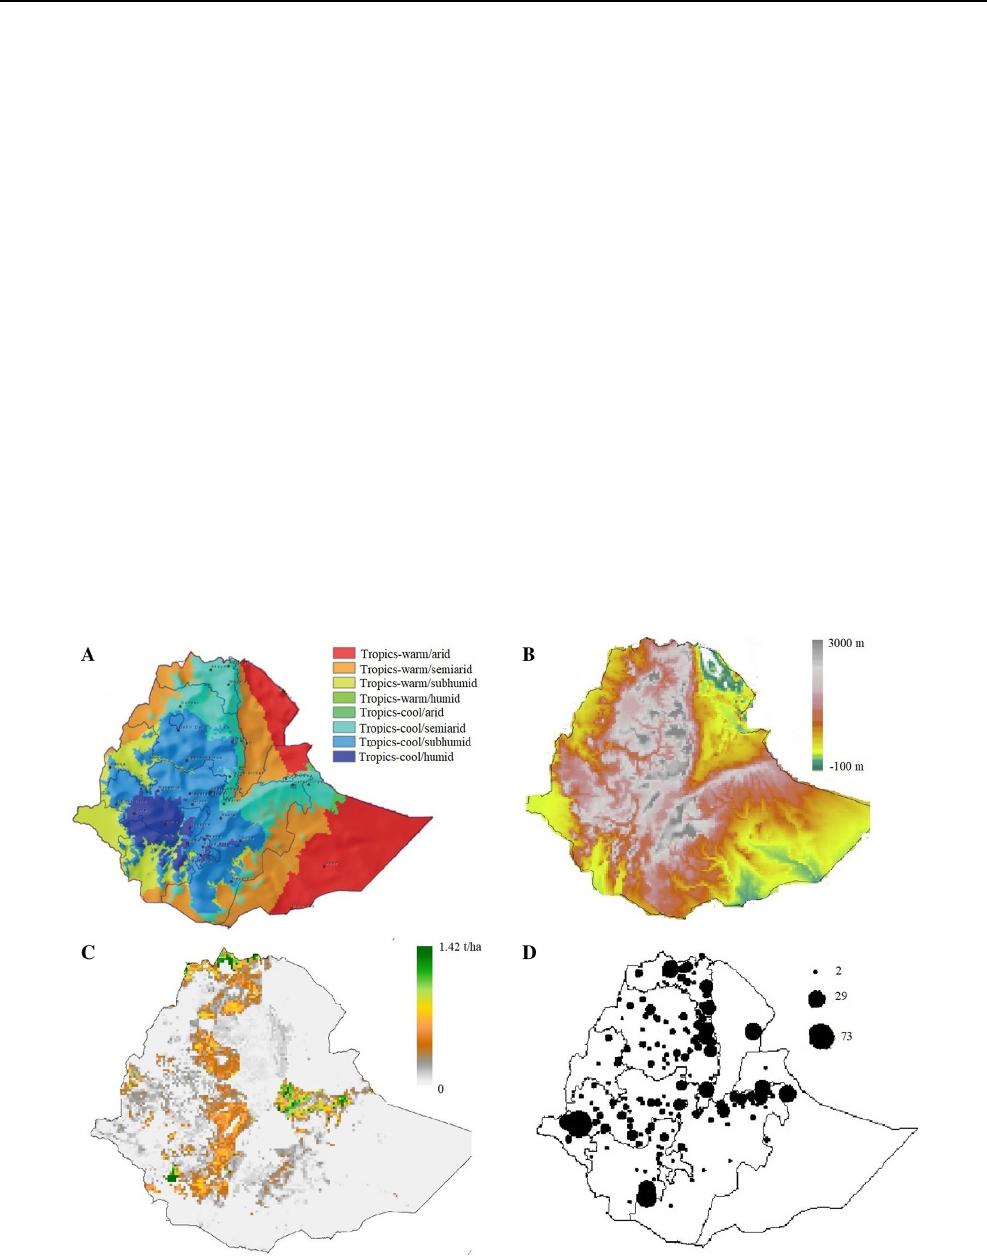
information on agroecologies (Fig.1a), altitudes (Fig.1b)
and sorghum production regions (Fig.1c) to systematically
select representative samples from all relevant regions of
the country (Fig.1d).
Total genomic DNA extraction andgenotyping
Leaf samples of four individual leaves were collected from
15-day-old plants grown in small pots in a greenhouse and
stored at −20°C in 96-well plates for 24h. The leaf sam-
ples were freeze-dried and sent to DArT (www.diver sitya
r rays .com) for DNA extraction. The DNA samples were
then genotyped using a genotyping-by-sequencing (GBS)
Fig. 1 Ethiopian geographical maps indicating a main agroecological
zones based on the Global 16 Class classification system by Amede
etal., (2015), b altitude, c sorghum production areas and d collection
sites of sorghum germplasm samples, with the size of the dots scaled
to indicate the number of samples selected at specific locations

Theoretical and Applied Genetics
1 3
whole-genome profiling method, DArTseq. This involves
complexity reduction of the genomic DNA to remove
repetitive sequences using methylation-sensitive restriction
enzymes prior to sequencing on next-generation sequencing
platforms. The sequence data generated were then aligned to
version v3.1.1 of the sorghum reference genome sequence
(McCormick etal. 2018) to identify SNPs (Single Nucleo-
tide Polymorphisms).
Data analysis
Pairwise linkage disequilibrium (LD) (r2) was calculated
using PopLDdecay (Zhang etal. 2019). The population
structure analysis was performed using LEA (Landscape
and Ecological Association Studies) version 1.8.1 in R
(Frichot and François 2015). The LEA package uses non-
negative matrix factorization (NMF) algorithms which are
based on sparse NMF and least-squares optimization (Fri-
chot etal. 2014) to estimate the subpopulation membership
or admixture for subpopulations. R package tess3r was used
to perform the spatial interpolation of ancestry coefficients
structure onto the Ethiopian geographical maps (Caye etal.
2016).
Redundancy analysis was performed using the varpart
function in R Vegan packages for independent variables of
agroecology and geographical locations. Agroecology vari-
ables were based on Amede etal. (2015) which estimated
agroecological zones in Ethiopia based on the Global 16
Class Classification System (Fig.1a). Accordingly, eight
Ethiopian agroecology zones have been identified: trop-
ics cool/humid, cool/subhumid, cool/semiarid, cool/arid,
warm/humid, warm/subhumid, warm/semiarid and warm/
arid. Sorghum also grown in all these agroecology except
col/arid and warm/humid. Ethiopia has two crop growing
season: Meher and Belg which receive rainfall from June
to October and February to June, respectively. Sorghum is
mainly grown in the Meher season, but farmers use the Belg
season’s rain (e.g., warm/semiarid regions) for late maturity
landraces to increase the duration of the growing period.
Geographical location variables were estimated from the
central point of latitude and longitude of each sample col-
lection, at the level of Woreda (District), depending on the
information available (Online Resource 1).
Principal component analysis (PCA) was undertaken
using DARWIN software version 6.0 (Perrier etal. 2003;
Perrier and Jacquemoud-Collet 2015) from dissimilarity
matrices. Dissimilarity indices (Modalities) were used to
generate dissimilarity matrices (Sokal and Rohlf 1962) for
PCA construction.
In order to identify the racial group classification of the
940 individuals, the SNP data generated in this study were
integrated with the global sorghum diversity panel SNP data,
where racial groups have been previously assigned (Tao
etal. 2020). Specifically, 10 individuals per subpopulation
were selected based on the matrix values of the individuals
in the group membership with coefficients greater than 0.85
and co-analyzed with 1033 individuals from the global sor-
ghum diversity panel. Botanical racial groups were assigned
using PCA (DARWIN, v6.0) based on 25,634 common SNP
markers between the Ethiopian landrace collection and the
global sorghum diversity panel.
Pairwise genome-wide nucleotide diversity (π) was cal-
culated using TASSEL 6 software (Buckler 2007) using the
Nei and Li (1979) model:
𝜋
=
∑
ij
x
i
x
j
𝜋
ij
, where
x
i
and
x
j
are
the respective frequencies of the ith and jth sequences, and
𝜋
ij
is the number of nucleotide differences per nucleotide site
between the ith and jth sequences.
Genome–environment association studies (GEA): three
environmental variables: altitude, annual temperature and
precipitation (averaged from 1960 to 1990), were used in
this study. The altitude variable used was based on the alti-
tude at the central point of the district, as identified in the
passport data. The annual temperature and precipitation
were extracted from 19 WorldClim derived bioclimatic vari-
ables using the R package raster (Hijmans etal. 2015) based
on the latitude and longitude coordinates for each of the geo-
referenced Ethiopian sorghum landraces. GEA was carried
out using Bayesian-information and Linkage-disequilibrium
Iteratively Nested Keyway in the R BLINK package (Huang
etal. 2018). The significance p value threshold was set based
on the Genetic Type I error calculator (GEC) of the P values
(Li etal. 2012) based on the effective numbers of independ-
ent tests.
A priori QTL on significant GEA SNP markers: A priori
previously identified candidate QTLs were identified that
colocated within 2cM of the significant GEA markers
(Mace etal. 2018), based on the LD decay pattern identified
in this study. Singular enrichment analysis was undertaken
using Chi-square with a P value ≤ 0.05 in R software with
the “chisq.test” procedure to identify whether the observed
GEA SNP markers colocating with previously identified
QTL were significantly different to the expected frequency,
based on the assumption of random distribution.
Results
SNP markers andlinkage disequilibrium (LD)
decay analyses
A total of 54,080 SNP markers were identified across the
940 landraces. Following exclusion of markers with > 25%
missing values, a subset of 50,367 SNPs was identified
and missing values inferred using the Beagle 5.0 software
Theoretical and Applied Genetics
1 3
package (Browning etal. 2018). The data set was further fil-
tered to exclude SNPs with MAF < 0.01, leaving a final data
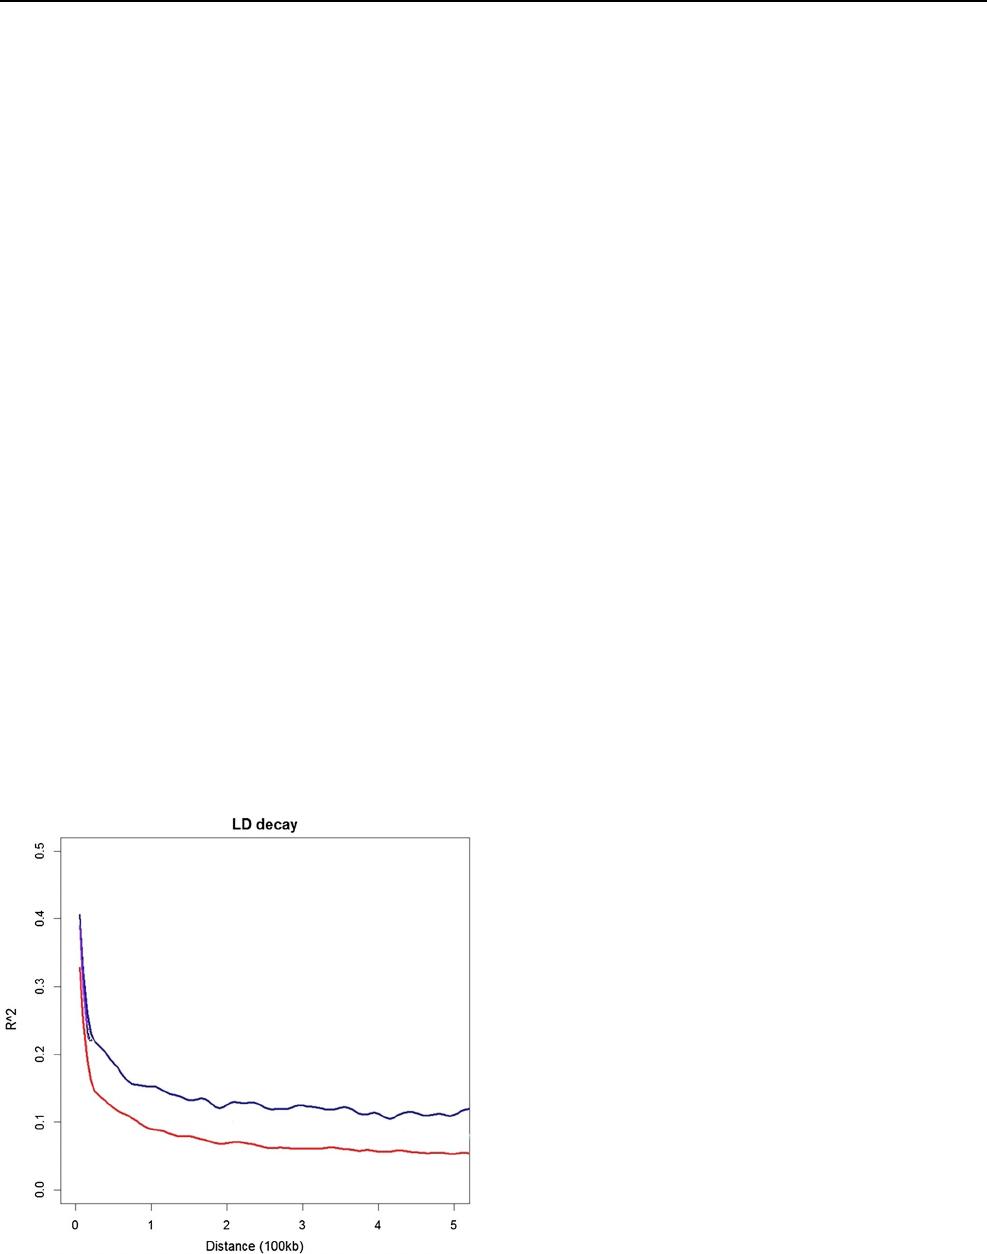
set of 25,634 robust SNP markers. Linkage disequilibrium
analysis identified that the LD decays to background levels
within 200kb (Fig.2) indicating a slower decay rate than the
global diversity panel described by Tao etal (2020).
Population structure
A population structure analysis of the 940 sorghum geno-
types for K ranging from 2 to 15 identified k = 12 as the
optimum number of subpopulations (groups) based on mini-
mizing the cross-entropy of the data (Online Resource 2;
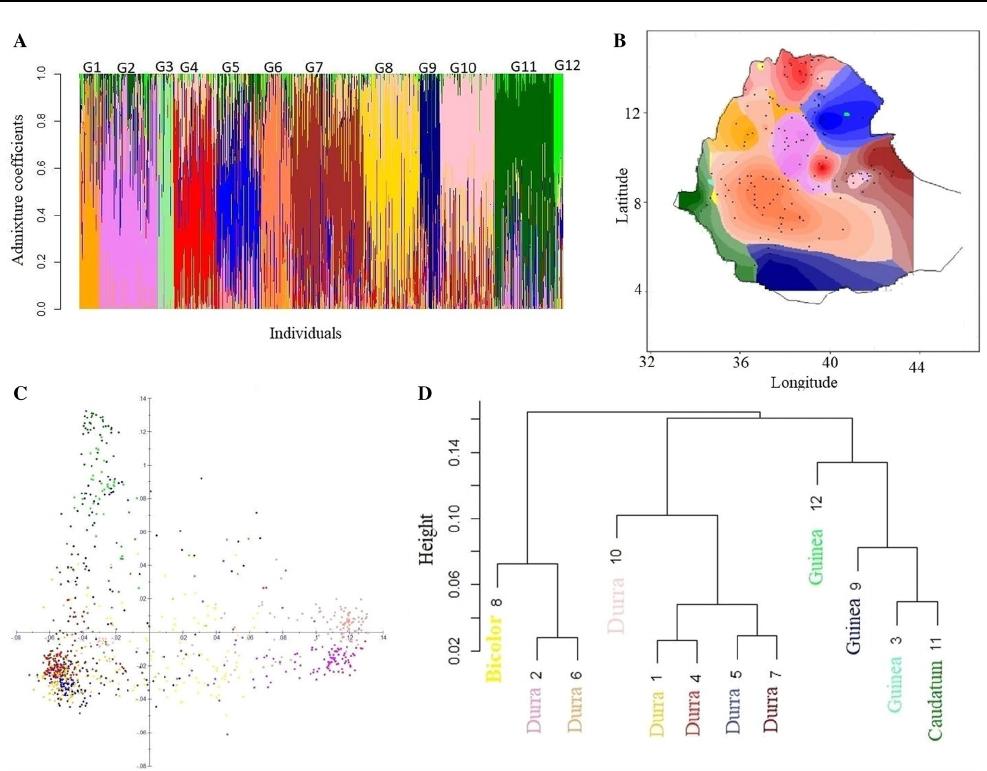
Fig.3a). The LEA results largely supported the population
structure analysis with 53% of the genotypes being assigned
to one of the 12 subpopulations with a high than 0.60 ances-
try membership coefficient.
The spatial interpolation of ancestry coefficients, per-
formed using the tess3r package (Fig.3b), showed the max-
imal local contribution of geographical location in Ethio-
pia to ancestry, with individuals in specific subpopulations
found to colocate in geographic regions. For example, in
subpopulation G11 (dark green), the majority of the indi-
viduals with high membership coefficients were from the
western part of Ethiopia. Individuals containing high mem-
bership coefficients in subpopulations G7 (brown) and G10
(pale pink) were from Eastern Ethiopia; subpopulation G9
(dark blue) from Southern Ethiopia; subpopulation G4 (red)
from Northern Ethiopia; and subpopulations G2 (pink) and
G6 (orange) from Central Ethiopia. Due to the small sample
size and low ancestry coefficients within subpopulations G3
and G12, these two populations are represented as small dots
within G11 and G5, respectively, in Fig.3b.
The genetic variation and structure of the 12 subpopula-
tions of Ethiopian sorghum germplasm were also investi-
gated using a PCA plot. The first two principal components
(PCs) explained 22.5%–9.3% of the SNP variation, respec-
tively (Fig.3c). Subpopulations G2 (pink) and G6 (orange)
were clearly separated from other subpopulations based on
PC1. In contrast, subpopulation G8 (yellow) is distributed
throughout the PCA plot. The remainder of the populations
separated primarily on PC2.
Assigning botanical racial groups
The first two principal components explained 54.9% of
the SNP variation (Online Resource 3), and a selection
scheme used the PCA data to assign the botanical races to
the selected individuals from this study. Overall, the 940
Ethiopian landraces were enriched for durra types. Simi-
lar to the Ethiopian landrace-specific PCA plot (Fig.3c),
subpopulations G2 and G6 were clearly distinct from other
subpopulations, clustering with East African durra types
from the global sorghum diversity panel (Online Resource
4). The Ethiopian highland durra types from the global sor-
ghum diversity panel clustered with subpopulations G1, G4
and G5; the Asian durra types clustered with subpopulation
G10; the guinea botanical type with subpopulations G3, G9
and G12; the caudatum types clustered with subpopulation
G11; and finally the bicolor types with subpopulation G8.
A neighbor-joining tree was constructed for all 12 subpopu-
lations, based on an individual group membership coeffi-
cient > 0.60, using the R packages factoextra and hierfstat.
The genetic variation revealed by the neighbor-joining tree
analysis (Fig.3d) was in-line with the previous analyses and
in particular highlighted the divergence of subpopulations
G2 (durra types), G6 (durra types) and G8 (bicolor types)
from the other subpopulations (Online Resource 3).
Sorghum genetic andagroecology diversity
Genome-wide nucleotide variation was quantified across
landraces and subpopulations to investigate the genetic
diversification in Ethiopian sorghum. The overall SNP
genetic variation (π) per nucleotide was 0.12582 across all
940 Ethiopian sorghum germplasm. A total of 487 geno-
types were selected based on group membership coefficient
matrix > = 0.60 (60%) and geographical information used
to calculate the genetic diversity among the subpopulations.
The nucleotide diversity in SNPs within the subpopulations
ranged from 0.1637 to 0.0310 in subpopulations G8 and
G12, respectively (Table1). Individuals in subpopulations
G1, G4, G5, G7, G9, G10 and G12 were predominantly
Fig.2 LD (r
2
) Decay per Kb between pairs of loci across all chromo-
somes for the Ethiopian landraces (blue) and the sorghum diversity
panel (red) described in Tao etal (2020) (color figure online)
Theoretical and Applied Genetics
1 3
located in the cool semiarid agroecological zones. Individu-
als in subpopulations G2, G3 and G6 were largely located in
cool subhumid agroecological zones, whereas individuals in
subpopulations G8 and G11 were predominantly from warm
subhumid agroecological zones.
Similar to spatial interpolation of ancestry coefficients
(Fig.1b), individuals from subpopulations G2 and G6
(durra botanical races) were located across the majority
of the agroecological zones in Ethiopia; however, some
of the durra subpopulations had specific geographic dis-
tributions. For example, the G10 durra type was located
exclusively in the harsh (cool/semiarid) agroecology,
while the G6 durra type was located in the cool/humid
agroecology, and the G1 durra type was located in the
warm/arid agroecology. Guinea type subpopulations (G3,
G9 and G12) were located in most of the agroecologies of
the country, but primarily in the cool/subhumid followed
by cool/semiarid regions.
To better understand the variance contribution of agro-
ecology and geographical locations to genetic diversity,
sorghum landraces were sampled to include the majority of
the agroecologies, altitude zones and production areas relat-
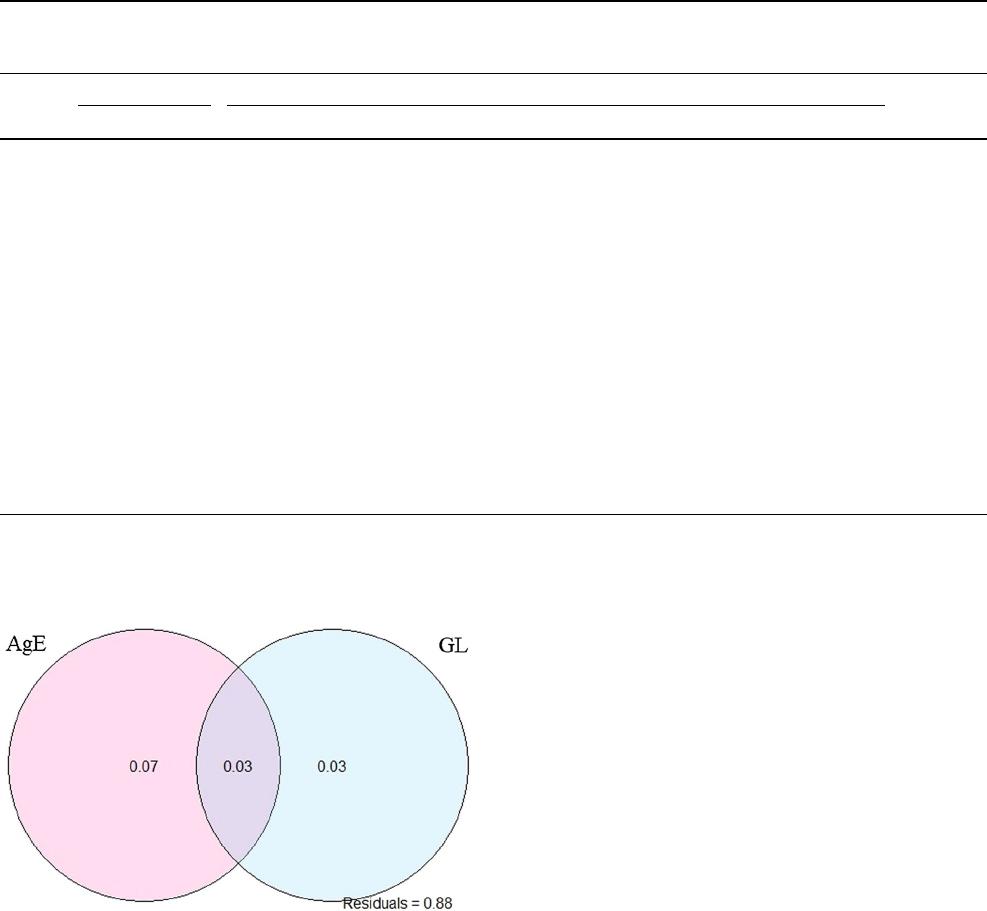
ing to sorghum in Ethiopian districts. Redundancy analysis
was performed to estimate the proportion of SNP varia-
tion explained by agroecology and geographical locations
(Fig.4). This analysis indicated that 13% of SNP variation
was explained by agroecology and geographical location,
broken down as follows agroecology (7%), geographical
locations (3%) and agroecology collinear with geographi-
cal location (3%).
Fig. 3 Population structure in Ethiopian sorghum germplasm using
SNP markers. a Population structure for K = 12. Each vertical line
represents one genotype, and the color composition displays the prob-
ability of belonging to each of the 12 subpopulations. b Interpolated
values of admixture coefficients (K = 12) plotted geographically on
the map of Ethiopia. c A principal component analysis plot (vari-
ance explained by PC1 22.5% and PC2 9.3%). d Neighbor-joining
tree, indicating the genetic distance between the 12 subpopulations.
The color coding used in all plots can be clearly seen in A (G1: light
orange; G2: pink; G3: light green; G4: red; G5: bright blue; G6:
orange; G7: brown; G8: yellow; G9: dark blue; G10: pale pink; G11:
dark green; and G12: bright green)
Theoretical and Applied Genetics
1 3
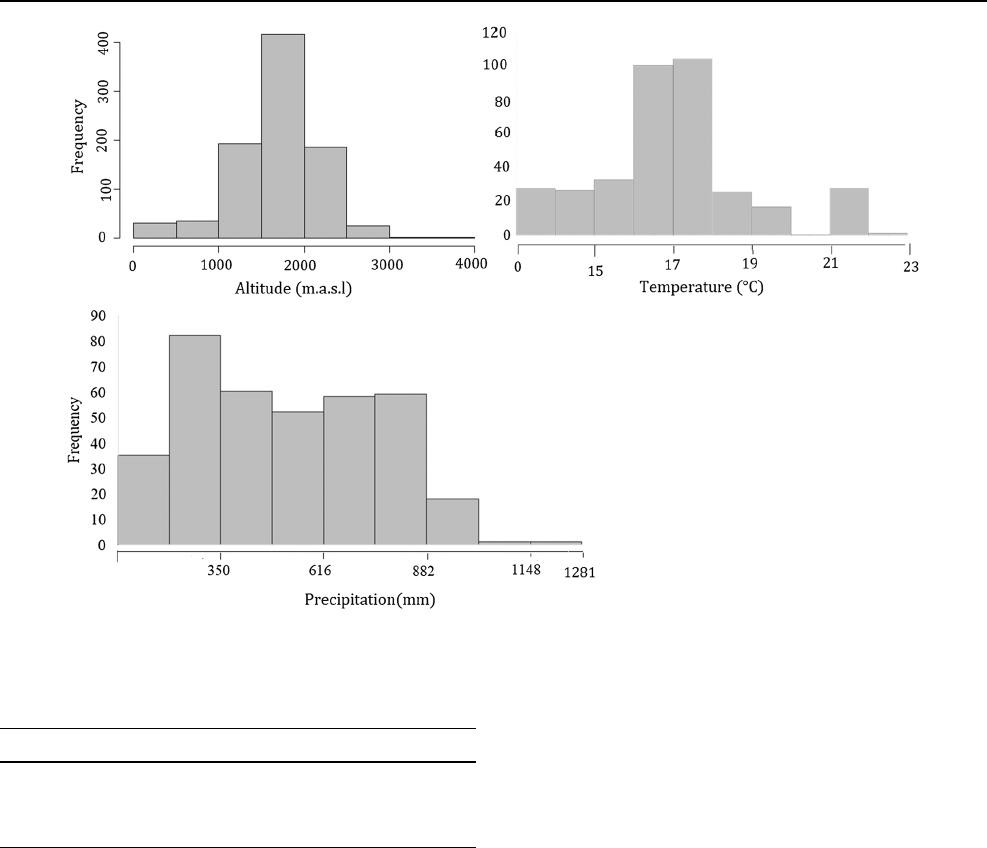
Genome–environment association (GEA) studies
foradaptive traits
GEA was performed using selected bioclimatic data (alti-
tude, annual temperature and precipitation). The climatic
data, which were extracted from WorldClim‐derived bio-
climatic data (Hijmans etal. 2005), showed a normal dis-
tribution for altitude and temperature, but a skewed dis-
tribution for precipitation due to the inclusion of a small
number of individuals from high precipitation districts and
a large number of individuals from low precipitation dis-
tricts (Fig.5). This was a consequence of sorghum being
predominately grown in low rather than high precipitation
districts. The phenotypic correlations between the climatic
data indicated that temperature was highly negatively cor-
related with annual precipitation and altitude, while annual
precipitation was highly positively correlated with altitude
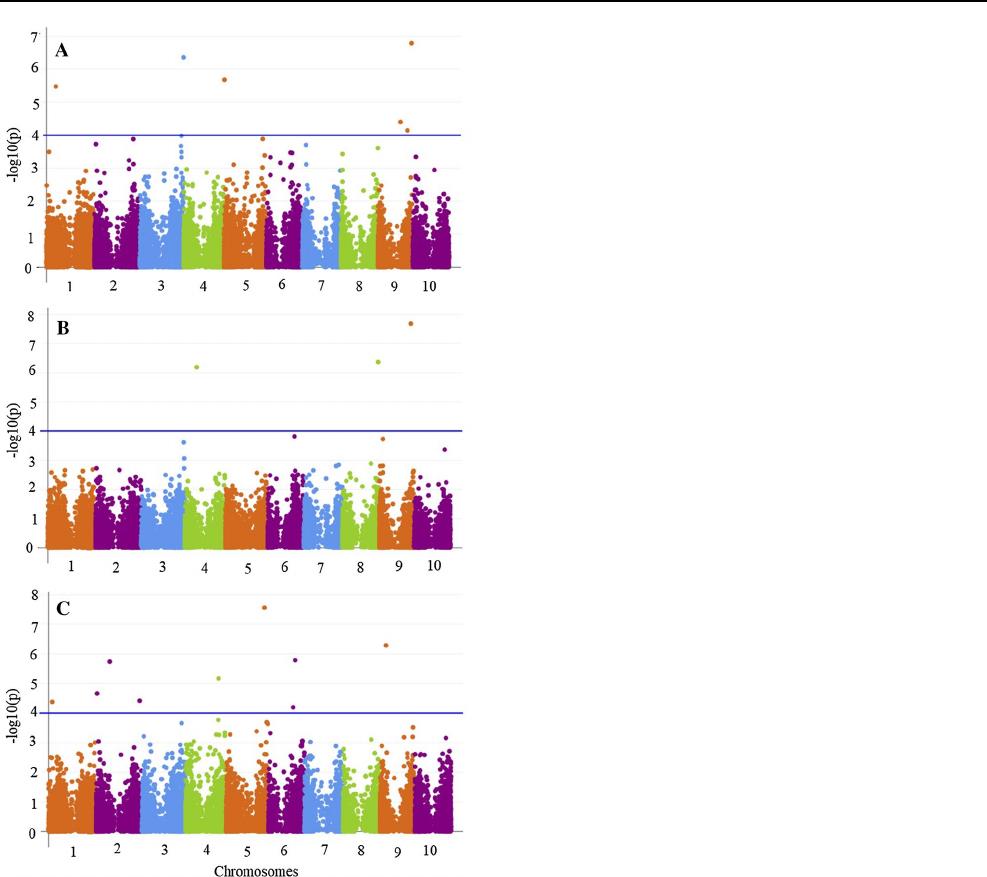
(Table2). To investigate genome and climatic association,
GEA analysis was conducted and identified a total of 18 sig-
nificantly associated SNP markers for altitude, annual mean
temperature and annual precipitation (Fig.6). Six significant
SNP markers were identified on chromosomes SBI-01, SBI-
03, SBI-05 (one SNP marker per chromosome) and SBI-09
(three SNP markers) for altitude (Online Resource 5). Three
significant SNP markers (one marker per chromosome) were
identified on chromosomes SBI-04, SBI-08 and SBI-09 for
annual mean temperature (Online Resource 5). Nine signifi-
cant SNP markers were identified on chromosomes SBI-01,
SBI-04, SBI-05, SBI-09 (one SNP marker per chromosome),
SBI-02 (three SNP markers) and SBI-06 (two SNP markers)
for annual precipitation. The percentage of the phenotypic
variance explained by each marker (R
2
) ranged from 0.5 to
3.2% (Online Resource 5).
A priori QTLs
The genomic locations of the GEA QTL identified were
compared with those of previously identified QTL for
drought and cold adaptation. Previous studies have iden-
tified 231 QTLs for drought adaptation (Online Resource
Table 1 Genetic diversity (botanical race and nucleotide diversity) and number of sorghum landraces assigned to main agroecology groups
among the 12 subpopulations
Gen. Genetic, π Nucleotide diversity, B. race Botanical race, Gr. Subpopulation
*Agroecology columns indicating the actual number and percentage of individuals in the specific subpopulations
Gr Gen. diversity Agroecology* Total /group
B. race π Cool/humid Cool/subhumid Cool/semiarid Warm/subhumid Warm/semiarid Warm/arid
G1 Durra 0.0680 0 (0.00%) 17 (29.31%) 27 (46.55%) 4 (6.90%) 3 (5.15%) 7 (12.07%) 58
G2 Durra 0.0676 3 (4.41%) 32 (47.06%) 29 (42.65%) 2 (2.94%) 1 (1.47%) 1 (1.47%) 68
G3 Guinea 0.0706 0 (0.00%) 15 (78.95%) 1 (5.26%) 3 (15.79%) 0 (0.00%) 0 (0.00%) 19
G4 Durra 0.0770 0 (0.00%) 25 (35.21%) 44 (61.97%) 1 (1.41%) 1 (1.41&) 0 (0.00%) 71
G5 Durra 0.0608 1 (1.89%) 5 (9.43%) 40 (75.47%) 1 (1.89%) 0 (0.00%) 6 (11.32%) 53
G6 Durra 0.0708 19 (22.89%) 34 (40.96%) 25 (30.12%) 2 (2.41%) 1 (1.20%) 2 (2.41%) 83
G7 Durra 0.0536 2 (4.65%) 2 (4.65%) 35 (81.40%) 1 (2.33%) 3 (6.98%) 0 (0.00%) 43
G8 Bicolor 0.1637 0 (0.00%) 2 (11.11%) 5 (27.78%) 10 (55.56%) 1 (5.56%) 0 (0.00%) 18
G9 Guinea 0.1030 0 (0.00%) 6 (35.29%) 10 (58.82%) 1 (5.88%) 0 (0.00%) 0 (0.00%) 17
G10 Durra 0.0530 0 (0.00%) 1 (5.00%) 18 (90.00%) 1 (5.00%) 0 (0.00%) 0 (0.00%) 20
G11 Caudatum 0.0736 1 (2.94%) 3 (8.82%) 3 (8.82%) 26 (76.47%) 0 (0.00%) 1 (2.94%) 34
G12 Guinea 0.0310 0 (0.00%) 0 (0.00%) 3 (100%) 0 (0.00%) 0 (0.00%) 0 (0.00%) 3
Total/
agroe-
cology
26 142 240 52 10 17 487
Fig. 4 SNP variance partitioning in Ethiopian sorghum explained
independently by agroecology and geographical locations (\AgE
agroecology, GL geographical locations)
Theoretical and Applied Genetics
1 3
6) and 636 QTLs for cold adaptation (Online Resource 7)
(Mace etal. 2018).
A total of eight significant precipitation SNP mark-
ers were colocated within a 2cM flanking region of 19
previously identified drought adaptation QTL (Online
Resource 8), with a significant genome-wide enrichment
(P = 0.02675). For cold tolerance, a high confidence subset
of the total number of QTL previously identified with a
confidence interval of < 10cM were used for the genetic
enrichment analysis. Out of six significant temperature-
associated SNP markers, three were colocated with 18 pre-
viously studied cold adaptation QTL (Online Resource 8),
again representing a significant genome-wide enrichment
(P = 0.0231). Out of six significant SNP markers for alti-
tude, five were significantly colocated with 25 previously
identified cold adaptation QTL (P = 6.831e
−06
) (Online
Resource 8).
Discussion
Information on genetic diversity is required for conservation
and utilization of genetic resources. Currently, only a small
portion of the genetic diversity of the Ethiopian sorghum
collection is characterized, and therefore useful, for sorghum
breeding programs. Through the integration of information
from sorghum production regions with genome-wide SNP
data, it is possible to investigate the genomic basis for cli-
mate adaptation. This study focused on the extent and pat-
tern of genetic diversity, including genome environmental
associations, of a large collection of Ethiopian sorghum
landraces.
The large panel of Ethiopian sorghum landraces, repre-
sentative of all of the key agro-climatic zones in Ethiopia,
was characterized with medium density SNP markers and
found to cluster into 12 subpopulations with high admix-
ture (47%). The high admixture observed is likely due to
gene flow among subpopulations, where close geographic
proximity, resettlements of different population groups
within the country, seed trading and the common practice
of farmers growing multiple landraces in the same field
would have contributed to increasing gene flow (Desmae
Fig. 5 Frequency of individual sorghum landrace for climatic variables. M.a.s.l = meter above sea level
Table 2 Correlation among the climatic variables
Astrisk indicates that number and percentage of individuals per sub-
population in the Table; number outside the bracket is actual number
individuals and in bracket is individual coverage percentage per sub-
population or per column
Altitude Temperature Rainfall
Altitude 1.0
Temperature −0.64** 1.0
Precipitation 0.66** −0.62** 1.0
Theoretical and Applied Genetics
1 3
etal. 2016). Recent studies on Ethiopian sorghum germ-
plasm also reported significant differentiation within the
collections, with high numbers of population clusters
identified (K = 11), and comparable amounts of admix-
ture (35%) in the Ethiopian collection (Girma etal. 2019)
and 47% admixture in the USA National Plant Germplasm
System (Cuevas etal. 2017) identified.
A large proportion ofvariance
wasnotexplained byeitheragroecology
orgeographical location
Many studies have indicated that sorghum diversity is
linked to either geography, agroecology and/or botani-
cal racial classifications (e.g., Barnaud etal. 2007; Lasky
etal. 2015; Faye etal. 2019). In this study, a low propor-
tion of variation was explained by agroecology and geo-
graphical location (Fig.4), with agroecology explaining
more than geographical location. This suggests that agro-
ecology is more important than geographical location in
shaping variation for sorghum clinal adaptation. A large
proportion of variance was not explained by either agro-
ecology or geographical location, suggesting that other
factors such as human activities or human settlement could
be significant. For instance, Smith and Frederiksen (2000)
stated that the main growers of durra sorghum in Ethiopia
were Muslim Oromo who settled in the fertile warm high-
lands and have used the botanical race of durra sorghum
as the foundation of their agricultural system. Globally,
the durra-type sorghum is predominantly grown in warm
semiarid or warm desert climates (Morris etal. 2013), but
in Ethiopia, it grows in most of the agroecological zones,
including the cool humid zone (Table1). This indicates
that the most likely contribution of human activities for
sorghum adaptation is human settlement and seed shar-
ing by farmers. Recent studies also reported that genetic
structure in sorghum has been shaped by seed sharing
and based on ethnolinguistic grouping (e.g., Ng’uni etal.
2011; Olatoye etal. 2018; Faye etal. 2019; Labeyrie etal.
2014, 2016) and historical processes of domestication and
diffusion (Morris etal. 2013).
Ethiopian sorghum diversity isdominated
bythedurra race
Most of the sorghum subpopulations identified in this
study (G1, G2, G4, G5, G6, G7 and G10) belong to the
durra botanical race, indicating that most of the sorghum
collections in Ethiopia are dominated by durra. This result
agrees with other studies that reported the durra botani-
cal race was the most frequently found race in Ethiopia
(Harlan and Stemler 1976; Smith and Frederiksen 2000;
Morris etal. 2013; Cuevas etal. 2017), as their domestica-
tion is associated with the Ethiopian region. However, as
the results of this study have indicated, Ethiopia does have
genetic resources of the other three races (guinea, cauda-
tum and bicolor), and this has also been noted previously
(De Wet etal. 1976; Harlan and Stemler 1976; Reddy etal.
Fig. 6 GEA across the Ethiopian sorghum landrace collection using
25,716 SNP markers (MFA ≥ 0.01). Manhattan plots showing signifi-
cant false discovery rate (FDR) adjusted P value of < 0.05 associated
with climatic variables for (A) altitude, (B) annual temperature and
(C) annual precipitation. The x-axis represents the chromosomes and
the y-axis the –log10 (P values) for marker–trait association. Each
point represents the SNP marker. The threshold is set based on the
Genetic Type I error calculator (GEC) of the P values

Theoretical and Applied Genetics
1 3
2002). In the current study, the kafir botanical race was not
identified in the germplasm studied. This might be due to
the low frequency of this botanical race in the Ethiopian
sorghum collection, but an earlier report also indicated
that only four of the main five botanical races of sorghum
(with kafir being the exception) were grown in Ethiopia
(Engels etal. 1991). However, in the sorghum germplasm
collected from Ethiopia by ICRISAT, although also domi-
nated by the durra race (~ 43%), a small number of kafir
racial types (~ 0.1%) were identified (Reddy etal. 2002).
This population isanexcellent resource forbreeders
trying toidentify sources ofadaptation
Understanding how sorghum botanical race divergence is
related to agroecological zones enables (a) breeders to nar-
row down their search to meet breeding objectives and (b)
germplasm collectors to target specific agroecological areas
for specific botanical types. Today, it has been estimated that
as much as 20% of exotic sorghum lines adapted to temperate
regions have originated from Ethiopia, indicating the value
of these genetic resources (Zhang etal. 2015). In the current
study, the durra subpopulations G2 and G6 were distributed
throughout most of the Ethiopian geographical locations and
agroecologies, indicating adaptation to a wide range of dif-
ferent Ethiopian environments (hot/dry and cold/wet), and
indicating that the durra botanical race has the ability to
grow in extreme agroecologies. The durra types therefore
offer a valuable reservoir of important new adaptive alleles
to both temperature and water stresses, advancing the use of
this germplasm collection. This has also been reported previ-
ously; for example, Singh (1985) reported that the highest
levels of cold adaptation globally have been found among
accessions from Ethiopia, compared with germplasm col-
lections from China and Uganda.
The guinea botanical racial types identified in this study
were distributed mainly in cool subhumid areas and, to a
lesser extent, cool semiarid areas (Table1). This contradicts
the expectation that the open-panicle architecture exhibited
by guinea types may be better adapted to humid regions
(Morris etal. 2013). In fact, the cool subhumid and cool
semiarid regions in Ethiopia are 1200m above sea level
and are considered as mid-altitude with a growing season
of > 70days at a time when both moisture and temperature
are conducive to crop growth (HarvestChoice 2010) and high
rainfall, reflecting conditions which are more suitable for
open-panicle types. In addition, soils in most of these high-
and mid-altitude regions are very acidic due to high rainfall
(Regassa and Agegnehu 2011), and the guinea botanical race
has previously been reported to have increased tolerance to
Al toxicity compared to other races (Caniato etal. 2011).
This characteristic is one of the main breeding targets in acid
soil regions, and hence, the guinea racial types identified
here offer a valuable source of adaptive alleles for breeding
programs (Garvin and Carver 2003).
GEA was performed using altitude, annual temperature
and precipitation to further identify the genomic regions
underlying local climatic adaptation traits in Ethiopian sor-
ghum germplasm. Tirfessa etal. (2020) reported that the
base temperature (Tbase, a minimum temperature required
for germination) in Ethiopian sorghum genotypes varies
from 0°C –9.8°C which is significantly different from that
of Indian and Australian germplasm (Tbase = 11°C). Such
variation in base temperature may provide a basis for selec-
tion adaptation to either low- or high-temperature environ-
ments (Mann etal. 1985).
In the current GEA study, a total of 18 significantly asso-
ciated SNPs were identified for altitude (6), annual mean
temperature (3) and annual precipitation (9) and were colo-
cated with 74 previously studied drought and cold adapted
QTLs (19 for precipitation with drought, 18 for temperature
with cold, 25 for altitude with drought and 12 for altitude
with cold; Online Resource (8)). Eight precipitation QTLs
for drought tolerance and three temperature QTLs for cold
tolerance showed a significant genome enrichment, indi-
cating the observed frequency of GEA (precipitation and
temperature) was significantly different from the frequency
expected by chance for drought and cold adaptation.
Conclusion
Using sorghum germplasm from the Ethiopian Biodiversity
Institute, a diverse collection of Ethiopian sorghum lan-
draces was characterized and found to comprise 12 subpopu-
lations that were largely dominated by the durra botanical
race, with no representation of the kafir botanical race. The
study also identified that up to 10% of the genomic variance
was explained by agroecology, with geographic location
explaining up to 6%, indicating that other factors are also
important for sorghum genetic variation in Ethiopia, includ-
ing human settlement and seed exchange among farmers.
Genome–environment association and candidate regions
for significant SNP markers indicated that local adaptation
to climatic variables has played an important role in sor-
ghum variation. This study confirmed that diverse Ethiopian
sorghum germplasm has adaptive alleles which could be a
source of useful genes for environmental stress adaptation.
Validation and prioritization of the genes found around the
significant QTLs in this study should be carried out via
genetic and molecular analyses.
Acknowledgements We thank the Ethiopian Biodiversity Institute
(EBI) and EIAR’s Melkassa Agricultural Research Center for provid-
ing us with the sorghum landraces and passport data. This study was
supported by the Bill and Melinda Gates Foundation PEARL (Program
for Emerging Agricultural Leaders) Program.
