
ORIGINAL PAPER
Estimation of Curie point depths and heat flow from Ardebil
province, Iran, using aeromagnetic data
Allahyar Khojamli
1
& Faramarz Doulati Ardejani
2
& Ali Moradzadeh
2
&
Ali Nejati Kalate
3
& Amin Roshandel Kahoo
3
& Soheil Porkhial
4
Received: 12 March 2015 /Accepted: 26 February 2016 /Published online: 27 April 2016
#
The Author(s) 2016. This article is published with open access at Springerlink.com
Abstract This study attempt s to estimate the Curie point
depth (CPD) using the centroid and forward modelli ng of
the spectral peak methods in the Sabalan geothermal field in
Ardabil, NW of Iran. The reduced-to-pole aeromagnetic data
were divided into 18 overlapping blocks of the sizes of
100 × 100 km. In the centroid method, the average depth to
the top of the deepest crustal block, Z
t
, was first computed by
linear fitting to the second longest wavelength segment of the
power spectrum of aeromagnetic data. Then, depth to the cen-
troid of the deepest crustal block, Z
0
, was computed by linear
fitting to the longest wavelength segment of the power spec-
trum of the aeromagnetic data. The depth to the magnetic
bottom was obtained from Z
b
=2Z
0
− Z
t
. In the forward
modelling of the spectral peak method, the modelled spectra
fitted to the observed spectrum iteratively and Z
t
and Z
b
were
finally estimated. According to the obtained results, the CPD
varies from 10 to 18.6 km. The Curie temperature of magne-
tite was used to determine the thermal gradient and the heat
flow in the area. The study area is found to have a great energy
potential in the west, northwest a nd the southwest of the
Sabalan with shallow CPD, high geothermal gradient and heat
flow.
Keywords Curie point depth
.
Aeromagnetic
.
Geothermal
.
Sabalan
.
Spectral analysis
Introduction
The Curie point (approximately 580 °C for magnetite at atmo-
spheric pressure) is the temperature at which the spontaneous
magnetization vanishes and magnetic minera ls show paramag-
netic suscep tibility. The depth at which temperature reaches the
Curie point is assumed to be the bottom of the magnetized
bodies in the earth crust. Curie point temperature varies from
region to region depending on the geology and the mineralo g-
ical content of the roc ks. Therefore, one can normally ex pect
shallow Curie point depth (CPD) at the regions which have
geothermal potential, young volcanisms and thin crust (Aydin
and Oksum 2010). The assessment of the variations in the
Curie depth of an area can provide valuable information about
the regional temperature distribution at depth and the potential
of subsurface geothermal energy (T selentis 1991).
The idea of using aeromagnetic data to estimate CPD is not
new, and it has been widely applied to various parts of the
world. Bhattacharyya and Leu (1975) mapped Curie point
isothermal surface for geothermal reconnaissance of the
Yellowstone National Park in USA. In this area, CPD was
estimated 4–8 km. Tselentis (1991) calculated CPD in
Greece from aeromagnetic and heat flow data. Tselentis’sob-
jective was to understand the nature and extent of the regional
* Allahyar Khojamli
a.khojamli.g@gmail.com
Faramarz Doulati Ardejani
fdoulati@ut.ac.ir
Ali Moradzadeh
a_moradzadeh@ut.ac.ir
AliNejatiKalate
nejati@shahroodut.ac.ir
1
Faculty of Engineering, Malayer University, Hamadan, Iran
2
School of Mining, College of Engineering, University of Tehran,
Tehran, Iran
3
Faculty of Mining, Petroleum and Geophysics, Shahrood University
of Technology, Shahrood, Iran
4
Renewable Energy Organization of Iran (SUNA), Tehran, Iran
Arab J Geosci (2016) 9: 383
DOI 10.1007/s12517-016-2400-3

geothermal system at a depth beneath the area of Greece by
constructing the Curie isotherms. The results of his investiga-
tions revealed that the CPD varies considerably beneath
Greece, reaching 20 km towards western Greece and about
10 km beneath the Aegean. In East and Southeast Asia, CPD
was determined based on the spectral analysis of magnetic
anomaly data by Tanaka et al. (1999). In this study, they used
many heat flow data from the boreholes. The estimated CPD
for this area using centroid method varied from 9 to 46 km. In
addition, they predicted CPD from heat flow data. The CPD
estimated from the heat flow data were very similar to the
results of the CPD analysis of magnetic data. Dolmaz et al.
(2005) concluded that the study of earth crust’s thermal struc-
ture in SW of Turkey is useful to determine modes of defor-
mation, depths of brittle and ductile deformation zones and
regional heat flow variations. Karastathis et al. (2010)found
the deep origin of the geothermal fields and volcanic centres in
central Greece, by combining a trav el-time inversion of a
micro-seismic dataset together with a CPD analysis based on
the aeromagnetic data. They also found that a possible magma
chamber can be presumed by detecting a low seismic velocity
volume at depths below 8 km and the CPD estimation at about
7–8-km depth as well.
Bansal et al. (2011) estimated the bottom depth of magnetic
sources in Germany using aeromagnetic data. At first, they
proposed a modified centroid method to estimate the depth
to the bottom of magnetic sources. To assess the calculated
bottom depth of magnetic sources, the results were then com-
pared with the heat flow density data. Saleh et al. (2012)
estimated CPD and heat flow map for Northern Red Sea rift
of Egypt. Their aim was to map the CPD based on the spectral
analysis of the aeromagnetic data. The CPD varied from 5 to
20 km. The shallowest CPD of 5 km (associated with the high
heat flow) was suggested a promising area for geothermal
exploration. Eletta and Udensi (2012) investigated the CPD
isotherm from the aeromagnetic data to prepare a preliminary
potential map of geothermal resources in the Eastern Sector of
Central Nigeria. They showed that the high prospect areas are
located in the south-west parts of the study area. Obande et al.
(2014) applied spectral analysis of aeromagnetic data for geo-
thermal prospecting in the north-east Nigeria. They estimated
the top and the centroid depths of magnetic source from the
power spectrum. The obtained results were subsequently used
to estimate the bottom depth. The range of CPD varies from 6
to 12 km according to the heat flow and CPD values of the
study area wherein the highest heat flow value and the
shallowest CPD occurred near the thermal springs. The
Wikki warm spring area was found to have a great energy
potential with a shallow CPD and very high heat flow values.
The geological and geophysical evidences together with
the presence of several hot water springs in Ardebil province
in the NW of Iran indicate that the area could have a high
geothermal energy potential. Besides, the review of the
published materials shows that no comprehensive aeromag-
netic data analysis exists to prove the geothermal potential of
the region. So, any study regarding to locate geothermal po-
tential zones in such a vast region is highly important in the
early stage of a geothermal exploration program. Therefore,
this paper attempts to apply Centroid depth and forward
modelling of the spectral peak methods of the aeromagnetic
data to determine CPD in the main part of the Ardebil prov-
ince particularly around the Sabalan mountain area. The heat
flow values are then estimated and mapped to assess further
geothermal zones.
Geological settings
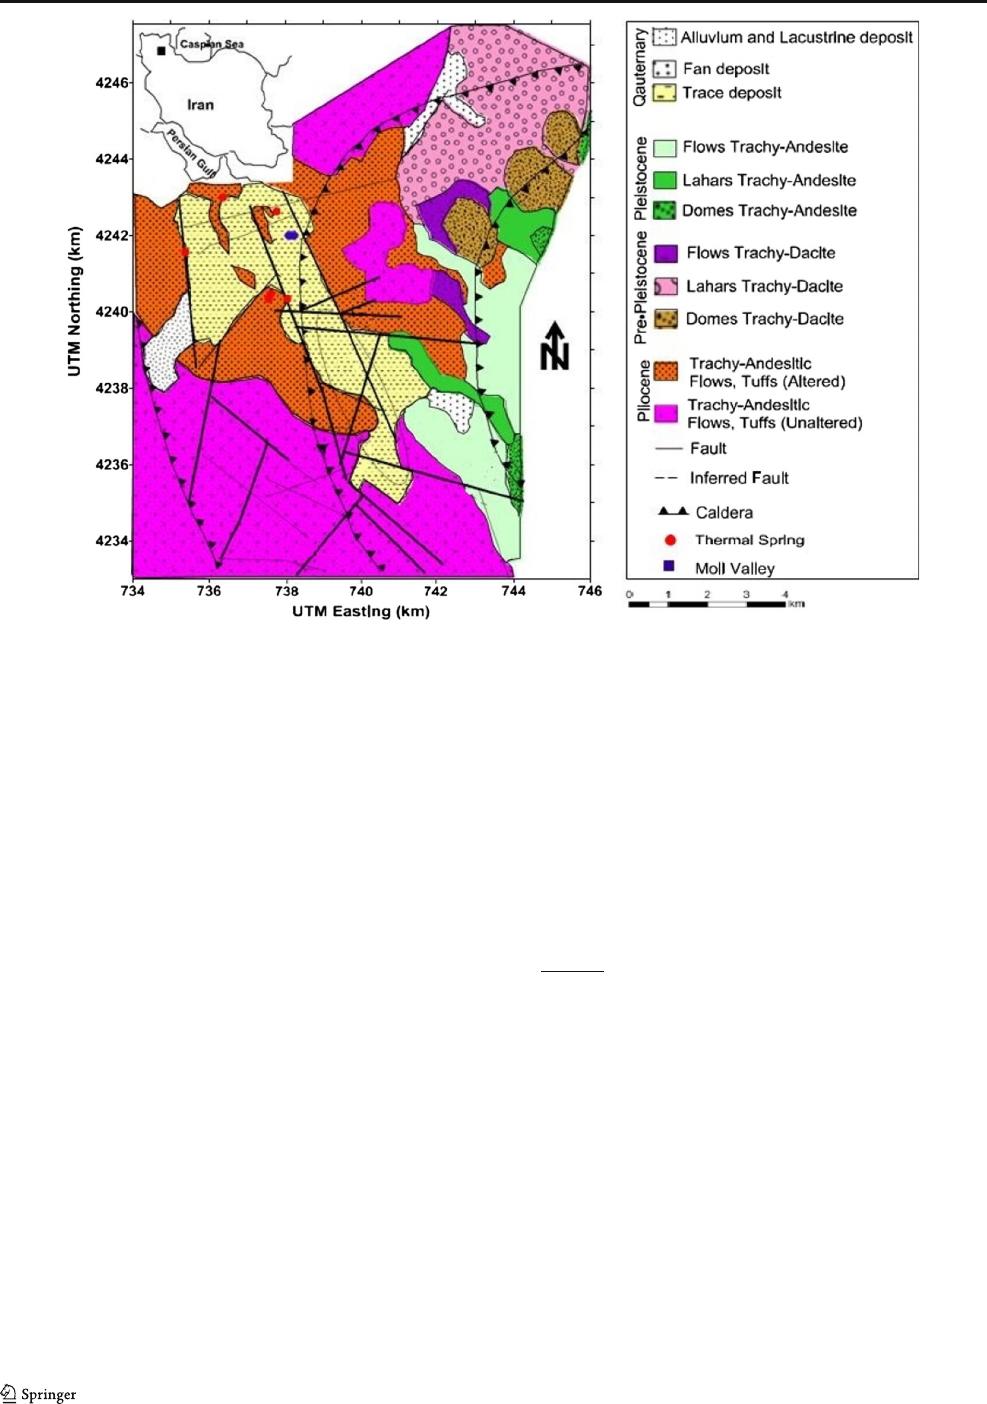
Ardabil province is a famous tourist destination in Iran. Its
pleasant climate especially in spring and summer seasons is
always worthy for most visitors and residents. Several hot
springs, with temperatures varied between 20 and 85 °C, exist
in Ardabil, which there are mostly around the Sabalan
Mountain (Mt. Sabalan). The Sabalan geothermal area
(Figs. 1 and 2) which is now under investigation for geother-
mal electric power generation lies at the NW of the Mt.
Sabalan (Ghaedrahmati et al. 2013). The area has been under
geoscientific exploration studies since 1978 (Fotouhi 1995).
Ardebil geology is diverse and complicated and has a long
evolution history. These features discriminate the area from
the other part of Iran. North of Ardabil is covered with older
alluvial, Clay, Marl and tuff intercalations. Surrounding region
around Mt. Sabalan is characterized by the predominance of
Quaternary terrace deposits (Dizu Formation); altered post-
caldera Pleistocene trachyandesitic domes, flows and lahars
(Kasra Formation); unaltered syn-caldera Pleistocene
trachydacite to trachyandesitic flows, domes and l ahars
(Toas Formation); and pre-caldera trachyandesitic lavas, tuffs
and pyroclastics (Valhazir Formation) (Fig. 2). The geologic
study of the Northwest of Sabalan confirmed that there are
two major types of structural setting: a set of linear faults
and several inferred faults (SKM, Sinclair Knight Merz
2005); the faults strike predominantly towards the northwest
and northeast (KML 1998). A northeast-southwest structural
trend is dominant in the south of Ardebil city. The main geo-
logical units exposed in this area include Miocene’saltered
tuff, tuff breccia, pumice, travertine, sandstone, shale, marl
and conglomerate and Eocene’s olivine basalt and
trachybasalt which overlay volcanic breccia and
trachyandesite of Eocene age.
However, the structural trend changes to northwest-
southeast direction in the further southern parts. This area
geologically contains a sedimentary sequence including
Cretaceous limestone, Jurassic’s shale and sandstone with in-
tercalation of dolomite which overlain by Eocene’svolcanic
383 Page 2 of 11 Arab J Geosci (2016) 9: 383

Fig. 1 Sabalan geothermal area
Arab J Geosci (2016) 9: 383 Page 3 of 1 1 383
breccia and trachyandesitic, trachybasaltic lava breccia and
lava flows of Quaternary age.
Data and methods
Aeromagnetic data of the area was obtained from the
Geological Survey of Iran. This data was corrected for the
International Geomagnetic Reference Field (IGRF 1976).
This data was collected in 1974–1975.
In this study, the centroid depth and forward modelling of
the spectral peak methods of the aeromagnetic data were used
to determine CPD.
Bhattacharyya and Leu (1977) presented a method for de-
termining the centroid of rectangular parallel piped sources,
which it had been used in their earlier study (Bhattacharyya
and Leu 1975) to investigate the Curie depths of Yellowstone
Park. This method was further developed by Okubo et al.
(1985) who combined and expanded the ideas of the methods
to the purpose of geothermal exploration. If the magnetization
of a set of two-dimensional (2D) bodies is completely random
and uncorrelated, the radial average of the power density spec-
tra of the total field anomaly, p(k), could be simplified as
follows (Blakely 1995; Stampolidis et al. 2005):
PkðÞ¼A
1
e
−2 kjjZ
t
1−e
− kjjZ
b
−ZtðÞ
2
ð1Þ
where A
1
is a constant and Z
t
and Z
b
represent the depths to the
top and bottom of the magnetic body, respectively. k denotes
the wave number of the magnetic field.
AccordingtoOkuboetal.(198 5), CPD (Z
b
)canbe
obtained in two steps. Firstly, the centroid depth (Z
0
)of
the deepest magnetic source is estimated from the slope
of the longest wavelength part of the spectrum divided by
the wave number using the following equation (Nwankwo
and Shehu 2015):
ln
PkðÞ
1
=
2
k
!
¼ A− k
jj
Z
0
ð2Þ
where P(k) is the power density spectrum and A represents a
constant.
The depth to the top of the magnetic source is similarly
derived from the slope of high wave number portion of the
power spectrum as follows (Nwankwo and Shehu 2015):
ln PkðÞ
1
=
2
¼ B− k
jj
Z
t
ð3Þ
where B is a constant.
The depth to the magnetic bottom is then obtained from
Z
b
=2Z
0
− Z
t
.
Fig. 2 Geologic map of the Sabalan geothermal field (modified from Ghaedrahmati et al. 2013)
383 Page 4 of 11 Arab J Geosci (2016) 9: 383

Forward modelling of the spectral peak method
Ravat (2004); Finn and Ravat (2004); Ross et al. (2004)and
Ravat et al. (2007) proposed forward modelling of the spectral
peak to better estimate the bottom depth by using Eq. 4.
PkðÞ¼Ce
− k
jj
Z
t
−e
− k
jj
Z
b
2
ð4Þ
where the constant C, non-depth-dependent term, can be ad-
justed to move the modelled curve up or down to fit the ob-
served peak. Location of the spectral peak and the slope in the
high wave number range are controlled by Z
b
and Z
t
,respec-
tively. The combination of both Z
t
and Z
b
controls the slope
immediately adjacent to the peak (Ravat et al. 2007). The
advantage of forward modelling is that it allows one to fit
iteratively the position and the width of the peak and match
the adjacent part of the slope more precisely and explore the
model space. Based on the fit of modelled spectra with the
observed, one may accept or reject the results more confident-
ly in this overall subjective process of fitting specific parts of
the spectra.
In both of these methods, CPD is computed in three steps:
(1) dividing the total magnetic field map into overlapping sub-
regions, (2) calculating the logarithm of power spectrum for
each region and (3) considering Z
b
=2Z
0
− Z
t
equation for
centroid method and calculating the basal depth or fit of the
modelled spectra with the observed spectrum and calculating
Z
t
and Z
b.
Having found the CPD, the heat flow values of the region
can be calculated using the following equation (Turcotte and
Schubert 1982):
q ¼ k
∂T
∂Z
ð5Þ
where q is the heat flow, k represents the coefficient of thermal
conductivity, and
∂T
∂Z
denotes the thermal gradient.
Data processing and analysis
Selecting the optimal dimensions of the sub-regions is very
important. The limited depth extent of the crustal magnetiza-
tion would be visible in magnetic maps, covering less than
100 × 100 km (Maus et al. 1997). Okubo et al. (1985, 2003)
suggested the optimal dimensions of the investigated square
window to be about ten times the actual target depth (Hisarli
et al. 2011). Connard et al. (1983) divided a magnetic data of
the Cascade Range, central Oregon, into overlapping blocks
(77 × 77 km) and calculated the radially average power spec-
trum for each block. Tanaka et al. (1999) divided the East and
Southeast Asia into sub-region data (approximately
200 × 200 km) and estimated the power density spectra for
each region. Blakely (1988) divided the area of Nevada into
blocks (120 × 120 km) in terms of magnetic or aeromagnetic
data and mapped the CDP of Nevada state.
Fig. 3 Selection of overlapping
blocks on the RTP map. Solid
circles indicate centres of blocks
Arab J Geosci (2016) 9: 383 Page 5 of 1 1 383
In the present study, the reduced-to-pole (RTP) aeromag-
netic data were divided into 18 overlapping blocks of sizes of
100 × 100 km (overlapped 50 % with the adjacent blocks)
(Fig. 3). It is widely acknowledged that the utilization of a
small window width may be a fundamental error in the appli-
cation of spectral methods for aeromagnetic interpre tation
(Nwankwo and Shehu 2015). If the source bodies have bases
deeper thanL/2π, they may not be appropriately resolved by
spectral method (Shuey et al. 1977). Therefore, data window
of 100 × 100 km possibly will satisfactorily resolve only depth
information to a depth of 15 km. This window size is based on
the fact that a computer code which has been written to deter-
mine a proper block size for calculating the radial power spec-
tra considers different window sizes varying from 50 to
400 km with a 10-km increasing step size. The absence of a
peak indicates that the peak lies at wave numbers lower than
the minimum resolved wave number; hence, a larger window
size is needed to compute the radial power spectrum and de-
tect the bottom of magnetic sources. The results show that a
peak is observed for some window sizes, but it shifts and
eventually disappears with increasing window size. The ap-
propriate block size of 100 × 100 km was then chosen so that
the maximum spectral peaks of the aeromagnetic data could
be visible in the power spectrum. However, few blocks with
CPD more than 13 km were recomputed with data window
increased to 200 × 200 km. The 2D power spectrum of
aeromagnetic data for each block was then computed using
the Oasis montaj software with fast Fourier transform
(FFT) method. Then, the effects of very deep regional
structures were removed using a first-order trend filter for
eachblock,andgridswereexpandedby10%usingthe
maximum entropy method to make the edges continuous.
The biggest advantage of 2D power spectrum is that the
depth of sources is easily determined by measuring the
slope of the power spectrum when the centroid method is
used (Saleh et al. 2012).
Results and discussion
This is the first time that spectral analysis of the aeromagnetic
data is being used to assess the thermal structure of the crust in
Ardebil province and mainly around Mt. Sabalan area. So, as a
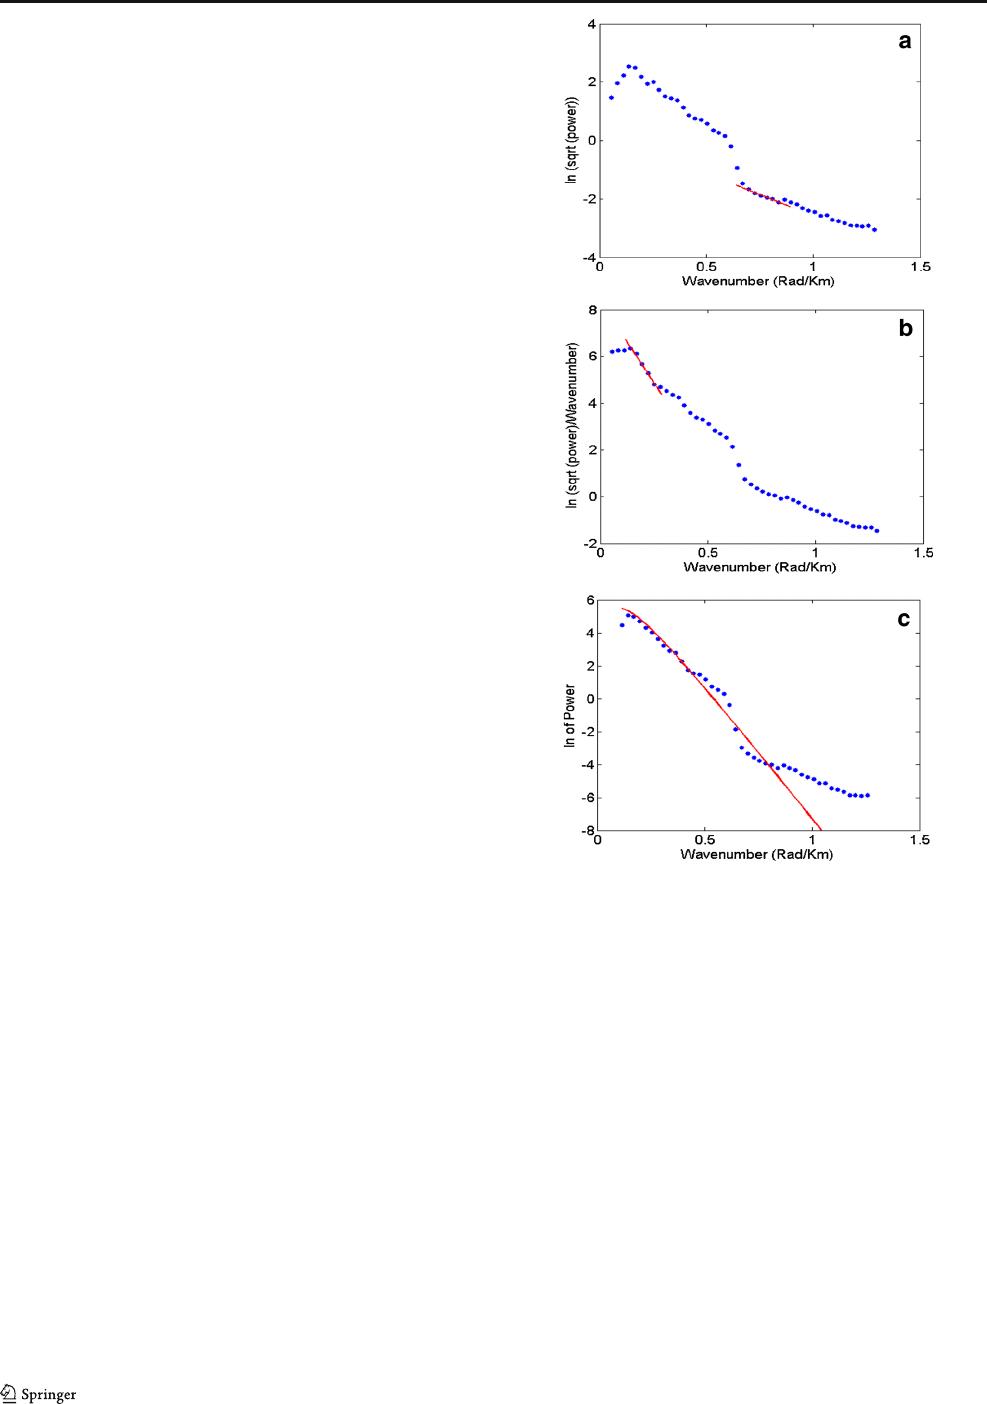
representative example, the power spectrum plots for block
no. 17 in the north Sabalan are shown in Fig. 4. Once the
depth to the top of this block (Z
t
= 1.2 km) was estimated
using Eq. 3 and Fig. 4a, then Eq. 2 was applied to estimate
the centroid depth (Z
0
= 7.8 km) as shown by Fig. 4b. Finally,
CPD was calculated using Z
b
=2Z
0
− Z
t
= 14.4 km. Besides,
Fig. 4c shows an example of the spectral peak forward model-
ling method of the same block. In this figure, the calculated
power spectrum was fitted iteratively with the measured pow-
er spectrum using MATLAB software (Version 7.12.0.635,
R2011a). By using this method, the top depth of this block
(Z
t
= 4.1 km) and Curie depth (Z
b
= 14.1 km) were deter-
mined. The obtained results for the other blocks applying the
centroid depth and forward modelling of the spectral peak
methods are given by Tables 1 and 2,respectively.
Figure 5 also shows the CPD map of the study area for two
methods: (a) centroid method and (b) forward modelling of
the spectral peak method. In these figures, two shallow CPD
zones were observed. The first shallow CPD is identified in
the west and northwest of the Mt. Sabalan, and the second
zone is seen in the bottom left corner of the map which is
Fig. 4 Examples of power spectra for the block no. 17. a The depth of the
top Z
t
= 1.2 km is obtained by fitting a straight line through the second
longest wavelength spectral segment. b The depth to centroid Z
0
=7.8km
is obtained by fitting a straight line through the longest wavelength
portion of the spectra. The Curie point depth for this block is
Z
b
=2Z
0
− Z
t
= 14.4 km. c The blue line represents the measured
power spectrum, and the red line is the result of forward modelling: its
depth to the top is 4.1 km, and bottom is 14.1 km
383 Page 6 of 11 Arab J Geosci (2016) 9: 383

located mainly in the East Azerbaijan province. In the centroid
method (Table 1), block no. 1 has the shallowest CPD (10 km)
and block no. 10 has the deepest CPD (16.9 km). Whereas, by
applying the forward modelling of spectral peak method, the
shallowest and deepest CPDs are assigned for blocks no. 1 and
no. 18, respectively (Table 2).
Table 2 Estimated CPD, geothermal gradients and heat flow by using the forward modelling of spectral peak method for the 18 blocks in the study
area
Block
number
Coordinates (UTM) Depth to top
(km)
CPD (km) Geothermal
gradient (°C/km)
Heat flow
(mW/m
2
)
Easting (m) Northing (m)
1 637,367.7 4,145,618 6.5 10.5 55.2 138.1
2 687,367.7 4,145,618 5.3 11.8 49.2 122.9
3 737,367.7 4,145,618 7.1 13.0 44.6 111.5
4 787,367.7 4,145,618 6.7 12.2 47.5 118.9
5 837,367.7 4,145,618 7.0 15.0 38.7 96.7
6 637,367.7 4,195,618 6.3 13.5 43.0 107.4
7 687,367.7 4,195,618 5.8 16.5 35.2 87.9
8 737,367.7 4,195,618 6.5 17.5 33.1 82.9
9 787,367.7 4,195,618 6.1 15.2 38.2 95.4
10 837,367.7 4,195,618 6.8 16.2 35.8 89.5
11 637,367.7 4,245,618 5.2 12.2 47.5 118.9
12 687,367.7 4,245,618 4.9 10.6 54.7 136.7
13 737,367.7 4,245,618 5.0 10.9 53.2 133.0
14 787,367.7 4,245,618 5.8 15.3 37.9 94.8
15 837,367.7 4,245,618 6.3 15.9 36.5 91.2
16 637,367.7 4,295,618 5.5 14.8 39.2 98.0
17 687,367.7 4,295,618 4.1 14.1 41.1 102.8
18 737,367.7 4,295,618 5.6 18.6 31.2 78.0
Table 1 Estimated CPD, geothermal gradients and heat flow by applying the centroid depth method for the 18 blocks in the study area
Block
number
Coordinates (UTM) Depth to centroid
(km)
Depthtotop
(km)
CPD (km) Geothermal
gradient (°C/km)
Heat flow
(mW/m
2
)
Easting (m) Northing (m)
1 637,367.7 4,145,618 6.3 2.6 10.0 58.0 145.0
2 687,367.7 4,145,618 7.4 2.5 12.3 47.2 117.9
3 737,367.7 4,145,618 7.2 2.4 12.0 48.3 120.8
4 787,367.7 4,145,618 7.8 2.7 12.9 45.0 112.4
5 837,367.7 4,145,618 9.1 1.7 16.5 35.2 87.9
6 637,367.7 4,195,618 7.9 2.4 13.4 43.3 108.2
7 687,367.7 4,195,618 8.8 2.6 15.0 38.7 96.7
8 737,367.7 4,195,618 9.1 1.9 16.3 35.6 89.0
9 787,367.7 4,195,618 8.9 2.2 15.6 37.2 92.9
10 837,367.7 4,195,618 9.5 2.1 16.9 34.3 85.5
11 637,367.7 4,245,618 7.8 2.2 13.4 43.3 108.2
12 687,367.7 4,245,618 6.9 2.4 11.4 50.9 127.2
13 737,367.7 4,245,618 6.8 2.3 11.3 51.3 128.3
14 787,367.7 4,245,618 8.2 1.8 14.6 39.7 99.3
15 837,367.7 4,245,618 8.1 1.6 14.6 39.7 99.3
16 637,367.7 4,295,618 8.9 1.9 15.9 36.5 91.2
17 687,367.7 4,295,618 7.8 1.2 14.4 40.3 100.7
18 737,367.7 4,295,618 9.2 2.2 16.2 35.8 89.5
Arab J Geosci (2016) 9: 383 Page 7 of 1 1 383

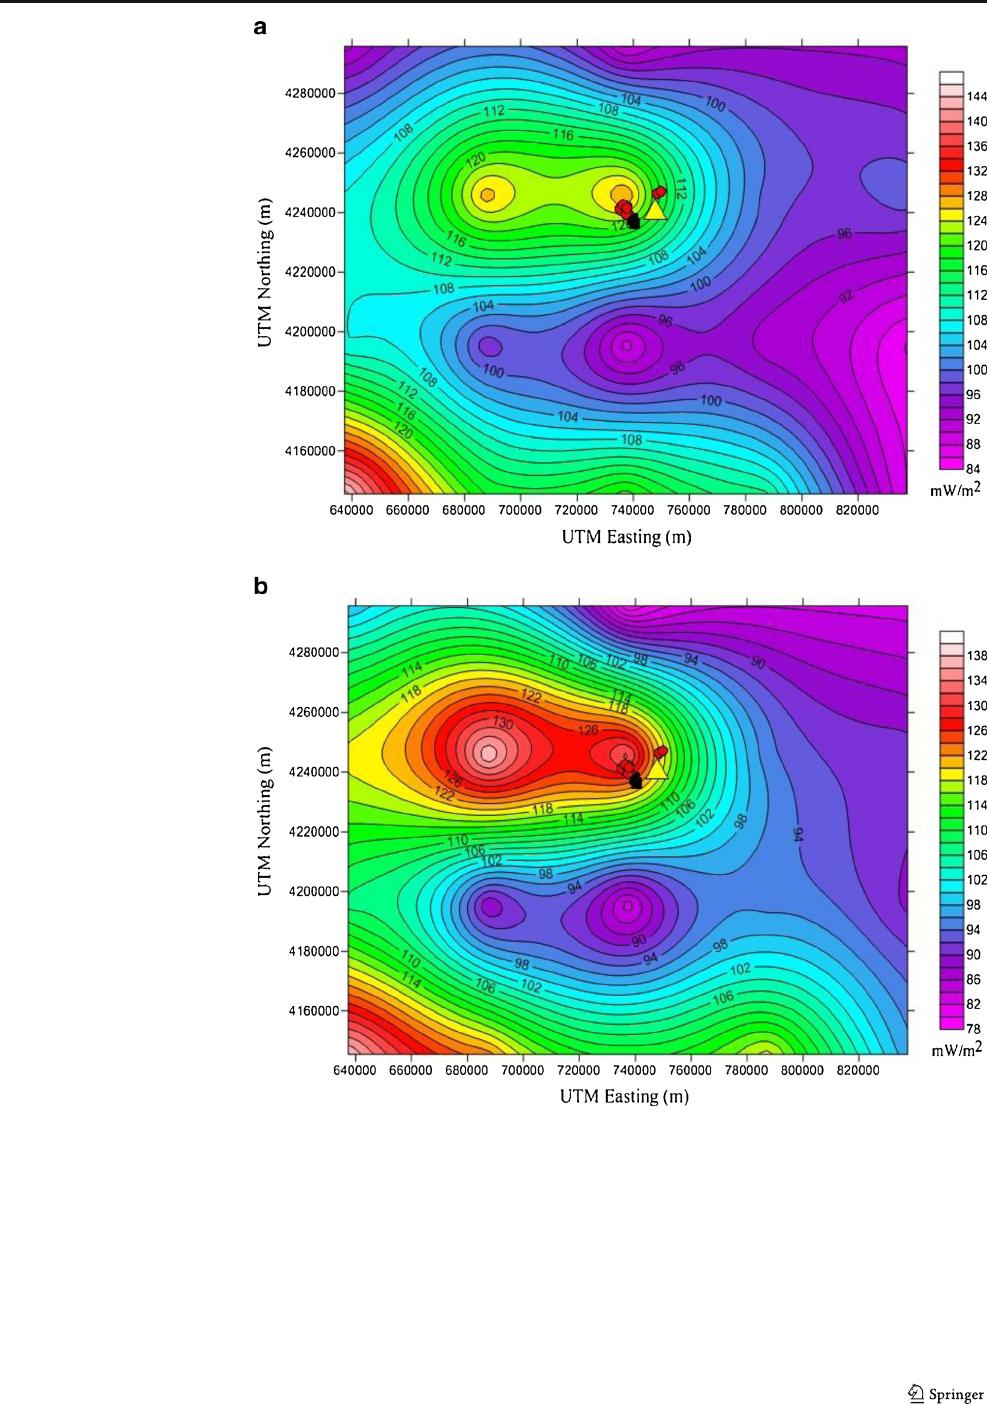
For determination of the surface heat flow, the value of
thermal conductivity (k)isgiven2.5Wm
−1
°C
−1
according
to the average thermal conductivity of the crustal rocks
(Stacey 1977). The geothermal grad ient of each block
was calculated by dividing 580 °C by the CPD. Heat flow
was then calculated by multiplying the geothermal gradient
by the thermal conductivity. Equation 5 was finally applied
to estimate the flow map of the study area (Fig. 6).
Figure 6aandTable1 illustrate the lowest heat flow value
(85.5 MW/m
2
) for block no. 10 and the highest heat flow
value (145 MW/m
2
) for block no. 1. In Fig. 6bandTable2,
one can see the highest heat flow value of 138.1 MW/m
2
occurring in block no. 1 and the lowest heat flow value of
78.0 MW/m
2
in block no. 18. Tables 1 and 2 give the
Fig. 5 The CPD maps of the
study area: a centroid method and
b forward modelling of the
spectral peak method (contour
interval is 0.5 km), thermal spring
(red solid circle), drilled well
(black square) and Mt. Sabalan
(yellow solid triangle)
383 Page 8 of 11 Arab J Geosci (2016) 9: 383
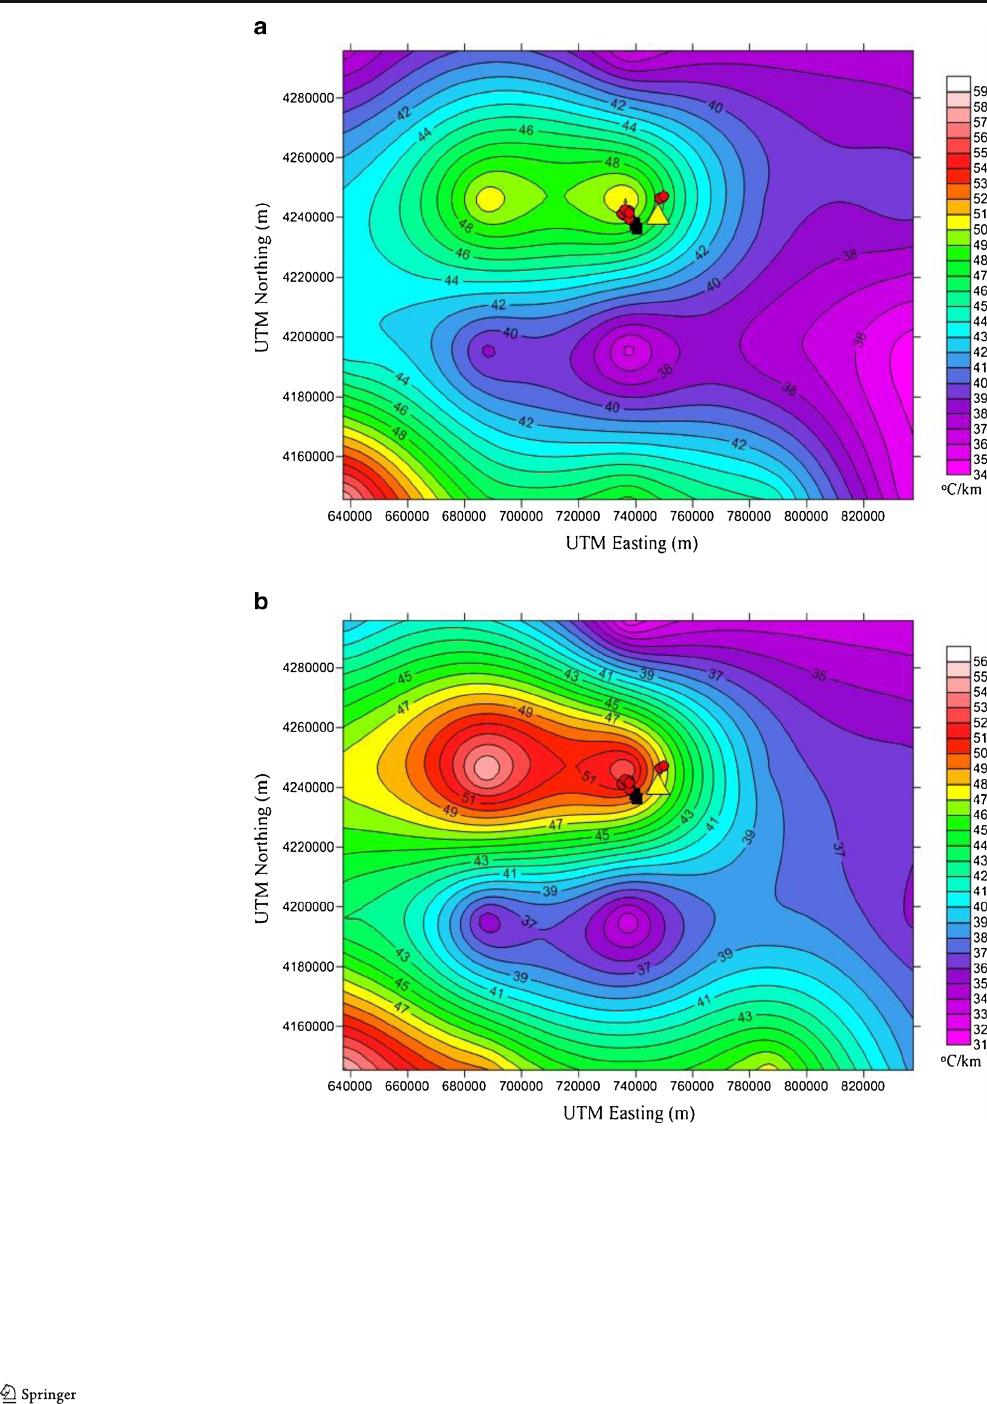
calculated CPD, heat flow and the geothermal gradient
values for a ll 18 blocks. The ma ps in Fig. 7 show the
geothermal gradient estimates each of these two methods.
It can be observed that a region with high temperature
gradient (Fig. 7a, 7b)andhighheatflow(Fig.6a, 6b) is
associated with the shallow CPD (Fig.5a, b). Results of the
both methods are rather the same. Also, the shallowest
CPD, h ighest hea t flow value an d maximum thermal
gradient are shown in the west, northwest and the south-
west of study ar ea. These results are confirmed by the
available well data, gravity and magnetotelluric measure-
ments. The CPD strongly varies according to the geologi-
cal conditions (Ross et al. 2006). The CPDs at volcanic and
geothermal areas are shallower than 10 km (Obande et al.
2014). Heat flow of about 80– 100 MW/m
2
indicates geo-
thermal anomalous conditions (Jessop et al. 1976). For the
Fig. 6 Heat flow maps in the
study area: a centroid method and
b forward modelling of the
spectral peak method (contour
interval is 5 mW/m
2
), thermal
spring (red solid circle), drilled
well (black square) and Mt.
Sabalan (yellow solid triangle)
Arab J Geosci (2016) 9: 383 Page 9 of 1 1 383
study area and area around Mt. Sabalan , the geothermal
anomalous conditions have been assigned to the most
blocks. As a result, t he study area is found to have a great
energy potential in the west, northwest and the southwest
of Mt. Sabalan with a shallow CPD, high geothermal gra-
dient and heat flow.
Conclusions
An attempt has been made to calculate the depth to bottom of
the magnetic so urces from the aeromagnetic data in the
Ardebil province in NW of Iran using spectral methods. The
CDP has been calculated by the centroid depth and forward
Fig. 7 Gradient maps in the
study area: a centroid method and
b forward modelling of the
spectral peak method (contour
interval is 2 °C/km), thermal
spring (red solid circle), drilled
well (black square) and Mt.
Sabalan (yellow solid triangle)
383 Page 10 of 11 Arab J Geosci (2016) 9: 383
