
RES E AR C H Open Access
DNA methylation signature in blood
mirrors successful weight-loss during
lifestyle interventions: the CENTRAL trial
Maria Keller
1,2,3†
, Anat Yaskolka Meir
4†
, Stephan H. Bernhart
5,6,7
, Yftach Gepner
4,8
, Ilan Shelef
9
, Dan Schwarzfuchs
9,10
,
Gal Tsaban
4
, Hila Zelicha
4
, Lydia Hopp
5
, Luise Müller
2,3
, Kerstin Rohde
1,2
, Yvonne Böttcher
3,11,12
,
Peter F. Stadler
6,13,14,15,16,17,18
, Michael Stumvoll
1,2,3,19
, Matthias Blüher
1,2
, Peter Kovacs
2*
and Iris Shai
4*
Abstract
Background: One of the major challenges in obesity treatment is to explain the high variability in the individual’s
response to specific dietary and physical activity interventi ons. With this study, we tested the hypothesis that
specific DNA methylation changes reflect individual responsiveness to lifestyle intervention and may serve as
epigenetic predictors for a successful weight-loss.
Methods: We conducted an explorative genome-wide DNA methylation analysis in blood samples from 120
subjects (90% men, mean ± SD age = 49 ± 9 years, body mass-index (BMI) = 30.2 ± 3.3 kg/m
2
) from the 18-month
CENTRAL randomized controlled trial who underwent either Mediterranean/low-carbohydrate or low-fat diet with
or without physical activity.
Results: Analyses comparing male subjects with the most prominent body weight-loss (responders, mean weight
change − 16%) vs. non-responders (+ 2.4%) (N = 10 each) revealed significant variation in DNA methylation of
several genes including LRRC27, CRISP2, and SLFN12 (all adj. P <1×10
−5
). Gene ontology analysis indicated that
biological processes such as cell adhesion and molecular functions such as calcium ion binding could have an
important role in determining the success of interventional therapies in obesity. Epigenome-wide association for
relative weight-loss (%) identified 15 CpGs being negatively correlated with weight change after intervention (all
combined P <1×10
− 4
) including new and also known obesity candidates such as NUDT3 and NCOR2. A baseline
DNA methylation score better predicted successful weight-loss [area under the curve (AUC) receiver operating
characteristic (ROC) = 0.95–1.0] than predictors such as age and BMI (AUC ROC = 0.56).
Conclusions: Body weight-loss following 18-month lifestyle intervention is associated with specific methylation
signatures. Moreover, methylation differences in the identified genes could serve as prognostic biomarkers to
predict a successful weight-loss therapy and thus contribute to advances in patient-tailored obesity treatment.
Keywords: Lifestyle intervention, Weight-loss, Epigenetics, DNA methylation, Gene
© The Author(s). 2020 Open Access This article is licensed under a Creative Commons Attribution 4.0 International License,
which permits use, sharing, adaptation, distribution and reproduction in any medium or format, as long as you give
appropriate credit to the original author(s) and the source, provide a link to the Creative Commons licence, and indicate if
changes were made. The images or other third party material in this article are included in the article's Creative Commons
licence, unless indicated otherwise in a credit line to the material. If material is not included in the article's Creative Commons
licence and your intended use is not permitted by statutory regulation or exceeds the permitted use, you will need to obtain
permission directly from the copyright holder. To view a copy of this licence, visit http://creativecommons.org/licenses/by/4.0/.
The Creative Commons Public Domain Dedication waiver (http://creativecommons.org/publicdomain/zero/1.0/) applies to the
data made available in this article, unless otherwise stated in a credit line to the data.
†
Maria Keller and Anat Yaskolka Meir contributed equally to this work.
2
Medical Department III – Endocrinology, Nephrology, Rheumatology,
University of Leipzig Medical Center, 04103 Leipzig, Germany
4
Faculty of Health Sciences, Ben-Gurion University of the Negev, P.O.Box 653,
84105 Beer Sheva, Israel
Full list of author information is available at the end of the article
Keller et al. Genome Medicine (2020) 12:97
https://doi.org/10.1186/s13073-020-00794-7
Background
Obesity represents a major health burden worldwide
[1]. Increasing energy expenditure and limiting caloric
intake are the major set points to control obesity;
however, only restricted long-term success could be
reached so fa r, potentially caused by hormonal, meta-
bolic, and neurochemical adaptations that stabilize
weight-l oss and may lead to weight regain [2]. The
majority of individuals who experience weight-loss
will regain it over time [3 , 4]. Thus, the effective
long-term treatment of obesity would require a sys-
tematic assessment a nd understanding of genetic, epi-
genetic, and lifestyle fac tors that potentially affect
energy intake, metabolism, and energy expenditure.
Therefore, a better understanding of this highly com-
plex interaction is required to explain the high vari-
ability in the individual’s response to specific dietary
and physical activity (PA) inte rventions. This would
allow to develop more successful preventive and
therapeutic strategies ultimately leading to personal-
ized lifestyle treatments in the battle against obesity
[5, 6].
Whereas poor adherence to different lifestyle inter-
ventions represents a strong factor in response to
weight-l oss ther api es [7], emerging evidence implies
that genetic and epigenetic predictors play a role in
inter-individual variability of metabolic response [8].
Further, this individual response in weight regain is
mainly driven by a n unadjusted energy intake after
the intervention [9], since after successful we ight-loss
less caloric intake is required to maintain the
achieved weight. Several recent findings directly link
obesity development to DNA methylation changes in
related target tissues such as adipose tissue (AT) [10,
11], ske letal muscle [12–14], and also in blood [15–
18]. DNA methylation marks in whole blood samples
have been repo rted to correlate with target tissue
changes [17] and would thereby represent an easy ac-
cessible proxy for the future development of personal-
ized treatment strategies and prediction of
therapeutical success. However, DNA methylation
changes upon long-term behavioral interventions (e.g.,
specific diets, exercise) are scarcely investigated so far.
In the present study, we conducted a genome-wide
DNA methylation analysis in blood samp les from 120
subjects who underwent the 18-month randomized con-
trolled trial (RCT) CENTRAL [ 19 ]. The CENTRAL trial
has been conducted under strict monitoring conditions
in the Dimona Nuclear Research Center, Negev, located
in a desert in Israel, thus providing an almost
homogenous environment and a low drop off rate. In
this exploratory study, we tested the hypotheses that (i)
metabolic changes mediated by different types of lifestyle
intervention including diet and PA (Mediterranean low-
carb (MED/LC) vs. low-fat (LF) vs. MED/LC + PA vs.
LF + PA) correlate with variation in DNA methylation
and (ii) that specific DNA meth ylation signatures reflect
individual responsiveness to lifestyle intervention to
serve as epigenetic predictors for successful weight-loss.
Methods
Study population and design
The CENTRAL RCT was conducted between 2012 and
2014 in an isolated nuclear research center workplace in
Israel and primarily aimed to assess changes on visceral
fat depots after diet and exercise interventions. The cen-
ter provides a sophisticated infras tructure including an
internal clinic, a cafeteria, and a designated space for
lifestyle and PA sessions, thus allowing this well-
structured and precisely controlled lifestyle intervention
trial. Two hundred seventy-eight of the participants with
a mean age of 48 years and a mean body mass index
(BMI) of 30.8 kg/m
2
fulfilled the pre-specified inclusion
criteria for the trial. Inclusion criteria for the exploratory
analyses were, first, either abdominal obesity (waist cir-
cumference (WC) > 102 cm for men and > 88 cm for
women) or dyslipidemia (serum triglycerides > 150 mg/
dL and high-density -lipoprotein cholesterol (HDL-C) <
40 mg/dL for men and < 50 mg/dL for women); secon d,
the provision of signed and dated informed consent
form; and third, the stated willingness to comply with all
study procedures and availability for the duration of the
study. Exclusion criteria included pregnant or lactating
women, subjects with serum creatinine ≥2 mg/dL, with
disturbed liver function (≥ 3-fold level of ALT and AST
enzymes), active cancer, individuals who had any restric-
tions regarding physical activity, were highly physical ac-
tive (> 3 h/week) or were included in other nutritional
trials (https://clinicaltria ls.gov/ct2/show/NCT01530724)
[19, 20].
The study was conducted in accordance with the Dec-
laration of Helsinki, and the protocol for the exploratory
analyses was approved by the Medical Ethics Board and
Institutional Review Board at Soroka University Medical
Center, Be’er Sheva, Israel (0239-11SOR). All partici-
pants provided written informed consent before taking
part in the study.
Subjects were randomly assigned to an either LF or
MED/LC diet (N = 1 39 each). Both dietary interven-
tions w ere equal in calories and maintained over the
entire study period. After 6 months, eac h intervention
arm was re-randomized to a group with moderate,
mostly aerobic (80%) PA (LF + PA; MED/LC + PA) or
without PA (LF-PA; MED/LC-PA) for another year of
intervention. Details about the study e nvironment, in-
terventions, endpoint measurements, and detailed
metabolic phenotyping can be obtained elsewhere [19,
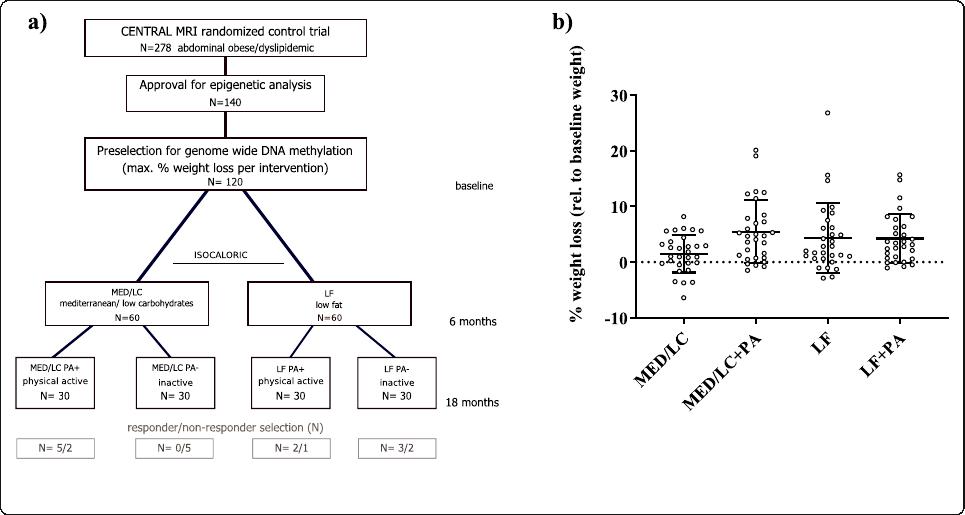
20].TheoverallstudydesignispresentedinFig.1a.
Keller et al. Genome Medicine (2020) 12:97 Page 2 of 18
Sample selection and preparation
Among all CENTRAL participants, a total number of
140 subjects with both baseline and 18 months available
blood samples gave additional consent to genetic ana-
lysis. Out of this subgroup 30 subjects per intervention
group showing the lowest relative weight after 18
months with respect to their initial weight were selected
and included in DNA methylation analysis. Details about
intervention group-specific phenotypes can be found in
Table 1, whereas individual weight-loss (%) is shown in
Fig. 1b.
Blood samples were taken after an overnight fast at
baseline (T0) and at 18 months (T18) after the individ-
uals completed their interventions. Sam ples were stored
at − 80 °C until DNA was extracted following a standard
protocol using proteinase K and 0.2% SDS. Samples were
integrity controlled using gel-electrophoresis and the
concentrations of double-stranded DNA was measured
using Quant-iT PicoGreen dsDNA (Invitrogen, Thermo-
Fisher Scientific, Germany) and Quantus (Promega,
Germany) technologies.
Genome-wide DNA methylation
Five hundred nanograms of genomic DNA from each
sample was bisulfite converted using EZ DNA Methyla-
tion Gold Kit (Zymo Research, Netherlands). Following
quality control, amplification, and hybridization on Illu-
mina HumanMethylation850 Bead Chips (Illumina, Inc.,
San Diego, CA, USA), the Illumina iScan array scanner
was used to quantify genome-wide DNA methylation
levels at 850 K CpG sites per sample on single-nucleotide
resolution (GenomeScan, Leiden, Netherlands).
Data analysis/statistics
Raw data was first quality controlled using the QC re-
port of the minfi R package [21–23] (Additional file 1).
Beta value densities as well as the control probes were
within predicted specifications. Probes that did not pass
detection P value (P
detect
= 0.01) in more than 1% of all
240 samples were excluded from the analysis. Cross-
reactive probes [24] as well as probes containing known
SNP positions (MASK_snp5_GMAF1p positions from
bioconductor’s Illumin a EPIC manifest [25]) were per se
not excluded from our analysis but are flagged through-
out all result and supplementary tables (Additional file 2).
Prior to all further analysis steps aimed at identifying dif-
ferentially methylated regions (DMRs) and specific CpG
sites (comparison independent), beta values were com-
puted and quantile normalized using minfi R package
([26], pages 9–10) [ 21, 22].
Cell type composition
As dietary interven tions such as western or high-fat diet
have been shown to induce systemic inflammation and
change the immune cell composition in adipose tissue of
mice [27, 28], we analyzed the cell type composition
using the Houseman approach [29] adapted to EPIC ar-
rays by Salas et al. [30]. Possible differences in cell -type
composition were plotted using ggplot2 and analyzed
using Wi lcoxon tests in R. As shown in [26] (pages 4–9),
none of the cell type population changed significantly
Fig. 1 Study design—CENTRAL RCT. a shows the study design of the CENTRAL RCT over the three time points: baseline, 6 months, and 18
months; b shows the weight-loss at 18 months relative to the baseline weight as mean ± SD (%)
Keller et al. Genome Medicine (2020) 12:97 Page 3 of 18

Table 1 Study characteristics of the CENTRAL subgroup selected for genome wide DNA methylation analysis
Trait CENTRAL all (N = 120) P value Low carb (N = 30) Low carb + PA (N = 30) Low fat (N = 30) Low fat + PA (N = 30)
Gender (N; female/male) 10/110 4/26 0/30 5/25 1/29
Age (years)
T
0
49 ± 9.3 47 ± 7.5 50 ± 9.8 50 ± 10.2 48 ± 9.5
Weight (kg)
T
0
90.32 ± 11.5 89.98 ± 14.5 90.58 ± 11.6 87.64 ± 10.4 93.07 ± 8.5
T
18
86.66 ± 11.2 88.50 ± 14.2 85.44 ± 10.8 83.61 ± 9.5 89.11 ± 9.1
Δ
(T18-T0)
− 3.65 ± 5.2 <1×10
−11
− 1.48 ± 3.3* − 5.14 ± 5.6*** − 4.04 ± 6.6** − 3.96 ± 4.2***
BMI (kg/m
2
)
T
0
30.17 ± 3.3 30.09 ± 4.6 30.13 ± 2.4 30.38 ± 3.3 30.08 ± 2.5
T
18
28.97 ± 3.4 29.60 ± 4.4 28.45 ± 2.5 29.02 ± 3.4 28.80 ± 2.8
Δ
(T18-T0)
− 1.20 ± 1.7 <1×10
−11
− 0.49 ± 1.1* − 1.68 ± 1.8*** − 1.36 ± 2.1** − 1.27 ± 1.4***
Waist circumference (cm)
T
0
106.70 ± 8.1 106.56 ± 11.3 108.29 ± 6.7 104.63 ± 7.3 107.56 ± 5.9
T
18
101.98 ± 8.4 103.49 ± 12.0 100.96 ± 7.0 100.50 ± 6.6 102.92 ± 6.7
Δ
(T18-T0)
− 4.81 ± 5.6 <1×10
−14
− 3.07 ± 4.0*** − 7.3 ± 6.2*** − 3.64 ± 6.3** − 5.29 ± 5.1***
HbA1c (%)
T
0
5.59 ± 0.5 5.66 ± 0.6 5.61 ± 0.4 5.60 ± 0.5 5.49 ± 0.4
T
18
5.51 ± 0.5 5.62 ± 0.8 5.47 ± 0.4 5.55 ± 0.5 5.39 ± 0.3
Δ
(T18-T0)
− 0.08 ± 0.3 0.005 − 0.04 ± 0.5 − 0.14 ± 0.2*** − 0.06 ± 0.3 − 0.10 ± 0.2**
Insulin ( μ U/mL)
T
0
18.02 ± 11.3 21.06 ± 15.2 16.85 ± 8.15 17.55 ± 12.1 16.56 ± 8.0
T
18
14.18 ± 7.3 16.66 ± 8.6 13.98 ± 8.1 12.67 ± 6.8 13.50 ± 4.7
Δ
(T18-T0)
− 3.91 ± 7.8 <1×10
−6
− 4.54 ± 10.5* − 3.40 ± 6.24** − 4.66 ± 7.8** − 3.07 ± 6.3*
Visceral adipose tissue area (cm
2
)
T
0
176.19 ± 61.3 162.00 ± 63.6 196.5 ± 63.5 160.60 ± 60.8 185.70 ± 51.3
T
18
128.12 ± 49.8 126.41 ± 47.9 131.33 ± 56.2 121.03 ± 54.3 133.70 ± 41.0
Δ
(T18-T0)
− 48.19 ± 36.2 <1×10
− 27
−35.54 ± 32.7*** − 65.21 ± 38.1*** − 39.73 ± 28.4*** − 52.00 ± 38.6***
Deep subcutaneous adipose
tissue area (cm
2
)
T
0
210.89 ± 70.0 217.50 ± 79.6 210.40 ± 64.8 201.30 ± 66.9 214.30 ± 70.2
T
18
144.71 ± 48.7 152.99 ± 60.2 139.50 ± 41.7 143.39 ± 41.6 142.96 ± 50.5
Δ
(T18-T0)
− 66.66 ± 42.1 <1×10
−33
− 64.55 ± 38.6*** − 70.95 ± 45.9*** − 59.59 ± 48.1*** − 71.31 ± 35.9***
Keller et al. Genome Medicine (2020) 12:97 Page 4 of 18

Table 1 Study characteristics of the CENTRAL subgroup selected for genome wide DNA methylation analysis (Continued)
Trait CENTRAL all (N = 120) P value Low carb (N = 30) Low carb + PA (N = 30) Low fat (N = 30) Low fat + PA (N = 30)
Superficial subcutaneous adipose
tissue area (cm
2
)
T
0
134.89 ± 56.5 146.20 ± 74.7 125.20 ± 47.6 135.90 ± 59.9 132.20 ± 37.9
T
18
106.76 ± 44.1 121.37 ± 55.8 94.4 ± 31.8 111.29 ± 50.3 99.99 ± 29.53
Δ
(T18-T0)
− 28.02 ± 23.9 <1×10
−23
− 24.85 ± 30.1*** − 30.85 ± 24.5*** − 24.01 ± 22.8*** − 32.23 ± 16.5***
Metabolic traits are shown as mean ± SD values prior intervention (T0), post-intervention (T18), and the intervention specific changes (Δ(T18-T0)). P values obtained from paired t-statistics between T0 and T18 are
shown for the entire cohort and indicated as: *P < 0.05; **P < 0.01; ***P < 0.001, for the intervention specific changes
Keller et al. Genome Medicine (2020) 12:97 Page 5 of 18
after the intervention (comparing T0 vs T18 over all 120
subjects).
Nevertheless, we used the sva R package to correct
beta values for cell-type composition in an attempt to
reduce noise [31].
DNA methylation changes
To identify intervention specific differentially methyl-
ated regions (DMRs) between T0 vs. T18 or differ-
ences at T18 as a result of t he individual
interventions, we used the DMR finder metilene [32].
Only DMRs were considered which carried a mini-
mum number of 3 CpGs per DMR with a maximum
distance of 1000 nt between the CpGs. Genes from
gencode v19 + 1500 nt upstream were intersected
using bedtools [33] with the DMRs to annotate the
genes. We compared T0 vs. T18, presence or absence
of physical activity (PA vs no), low-carb vs low-fat
diet, and PA vs no in the two dietary groups.
It has to be noted that methods used to interrogate
the data for DMRs can also result in distinctly different
findings. Therefore, we performed a single CpG analysis
using the dmpFinder function of the minfi package as
described in [26] (pages 18–21) [21].
Intervention independent changes (responders vs. non-
responders)
To investigate differences in DNA methylation levels be-
tween the top 10 responders and bot tom 10 non-
responders (including only men matched for age; Fig. 1a)
according to their relative weight-loss after intervention,
computed DNA methylation differences at the individual
time points (T0; T18) as well as combined data sets (T0
and T18) using metilene were employed to uncover
DMRs using the metilene’s two-dimensional
Kolmogorov-Smirno v test (2D-KS) under the same cri-
teria mentioned above [32]. Metabolic differences be-
tween the groups were calculated in SPSS (V.24) using t-
statistics.
Predicting methylation marks
To detect individual CpG sites on a genome-wide basis
which are associated with the success of weight-loss by a
classical lifestyle intervention (independent of the inter-
vention type), Spearman and Pearson correlation ana-
lysis were performed individually and combined to take
linearity an d monotony equally into account and to fur-
ther reduce potential background noise due to data
properties. An epigenome-wide association study
(EWAS) for the relative weight loss in % based on the
initial body weight (kg) was conducted and plotted using
CMplot in R [29]. A receiver operating characteristic
(ROC) curve model was used to further test a potential
predictive value of a baseline methylation score,
computed as mean of all ß values from CpG sites. We
used 4 methylation-based predictors, two based on CpGs
correlating negatively with intervention weight changes
with p < 0.001 and p < 0.0001 and two based on CpGs
correlating positively with weight changes: p < 0.001 and
p < 0.0001. We compared these 4 predictors to general
intervention predictors such as a linear combination of
individuals’ age and BMI (x*age + y*BMI). The analysis
was restricted to men ’s data sets for all ROC analysis, as
there is only a limited number of women and the com-
bination of age and BMI showed different behavior for
men’s and women’s data sets. The maximum area under
the ROC curve (AUC) was achieved for the coefficients
x = − 1 for the age and y = 2.54 for the BMI in the linear
combination ([26], pages 14–17).
Statistics
P value adjustment was performed using the Benjamini-
Hochberg procedure with adj.P values < 0.05 considered
to be statistically significant. Phenotype correlation ana-
lysis at both time points was performed with baseline
methylation levels of the identified candidate DMRs and
CpGs using again Pearson and Spearman analysis and
included the computation of a combined P via geometric
mean (
ffiffiffiffiffiffiffiffiffiffi
Q
n
i¼1
χi
n
s
).
ChromHMM prediction
All identified DMRs, as well as the putative EWAS CpGs
described above, were aligned to chromatin segments
taken from the Epigenomic Roadmap [34] as well as
additional cancer cell lines generated as described else-
where [35] using bedtools [ 33 ]. Besides analyzing a back-
ground of all cell and tissue types, we focused on AT
(adipose tissue-derived mesenchymal stem cells, mesen-
chymal stem cell-derived adipocyte cultured cells, adipo-
cyte nuclei), intestinal tissue (fetal intestine large, fetal
intestines small, small intestines), skeletal muscle
(HSMM cell-derived skeletal muscle myotube cells,
HSMM skeletal muscle myoblasts cells, skeletal muscle
female, skeletal muscle male), and liver tissue.
Gene ontology analysis
Probes from the DMRs characterizing methylation dif-
ferences between responders and non-responders (P <
0.05) as well as correlating probes (P < 0.05) were taken
forward for gene ontology analyses corrected for probe
abundance of the EPIC array using R’s missMethyl pack-
age [36 ] and 0.05 as cutoff for the false discovery rate
([26], page 27).
Keller et al. Genome Medicine (2020) 12:97 Page 6 of 18
Results
All subjects included in the DNA methylation analysis
lost on average 3.65 ± 5.2 kg (mean ± SD; P <1×10
−11
,
Table 1 and Fig. 1b) of body weight after 18 months
accounting for more than one BMI point. In line with
this, the area of visceral AT, deep and superficial
subcutaneous AT depots decreased significantly (all
P <1×10
−20
,Table1), and obesity-associated meta-
bolic features such as HbA1c and insulin levels clearly
improved (all P < 0.01, Table 1).
Specific signatures of DNA methylation between
responders and non-responders
First, we conducted analyses to uncover regions po-
tentially discriminating between success and failure of
a lifestyle intervention, and we selected 10 male sub-
jects who were referred to as non-responders since
they slightly gained weight after intervention and 10
male responders showing the most pronounced
weight-l oss (Fig. 2a, b). The intervention group distri-
bution of responders and non-respo nders is provided
in Fig. 1a. Both, the top responders and the bottom
non-responders (matched with respect to age), lost
weight after the first 6 months of diet intervention
(Fig. 2a). However, during the following 12 months of
intervention, the non-responders regained or even ex-
celled their initial w eight whereas the responders lost
about 16% of their initial body weight (Fig. 2a, b).
Consistently, differences in the area of adipose depots
were found between the subgroups of responders and
non-responders after 18 months of intervention, with
the strongest difference for visceral AT (P <1×10
−5
,
Fig. 2c).
Between the two groups, we identified 293 DMRs
(2D-KS P value< 0.05; comprising 332 g enes; 33
DMRs without genes) at baseline, i.e., prior to lifestyle
intervention, and 280 DMRs (331 genes; 43 DMRs
without genes) after completion of the intervention.
However, both before and after intervention, only two
DMRs (mapped genes: CRISP2 and LRRC27)
remained significant after correction for multiple test-
ing (Additional file 2: Table S1 and S2). Neverthe less,
between both time points 150 DMRs corresponding
to 168 genes intersected with consisten t differe nces in
DNA methylation and were not muc h af fected by
weight-loss intervention. Therefore, to minimize the
effect of potential outliers by increasing the sample
size and so the statistical power, we combined the
datasets of both time-points treating the different
time-points as biolog ical replicates without any fur-
ther adjustments for the lack of independence and
thereby identified 669 DMRs (759 genes; 100 DMRs
without genes) between responders vs. non-
responders (Add itional file 2: Table S3). After
correction for multiple testing 8 DMRs (9 genes) (P
adjusted < 0.05) remained significant (Table 2, Fig. 3a).
Amongthem,4DMRsshowedsignificantlyhigher
(CRISP2, Cysteine Rich Secretory Protein 2; SLC6A12,
Solute Carrier Family 6 Member 12/RP11-283I3.2;
SLFN12, Schlafen Family Member 12; AURKC, Aurora
Kinase C; deltaM: 0.06–0.13) and 4 significant lower
methylations in responders (LRRC27, Leucine Rich Re-
peat Contain ing 27; RNF3 9, Ring Finger Protein 39;
LINC00539, Long Intergenic Non-Protein Coding RNA
539;andNTSR1, Neurotensin Receptor 1; deltaM: (−
0.08)-(− 0 .11))(Fig.3a/b; Table 2) compared to non-
responders. Diff erences in DNA methylation (normal-
ized ß values) for all 8 DMRs are presented in Fig. 3b.
Among them, the SLC6A12 (-RP11-283I3.2) gene
locus revealed the strongest difference in DNA
methylation (deltaM: 0 .126 = 12.6%; adjusted
P =
0.008) (Table 2; Fig . 3b) for a DMR at chr12:312736-
312753 including 3 CpG sites.
Furthermore, among the DMRs which showed signifi-
cant P values in a combined analysis but did not withstand
adjustment for multiple testing (N = 661), we identified
mostly new candidate genes but also confirmed genetic
risk loci for BMI (N = 256), waist-to-hip ratio (N =154),
waist-circumference (N = 55), and type 2 diabetes (N =
130), such as the Transcription Factor 7-Like 2 (TCF7L2)
(Additional file 2: Table S4, risk loci according to the
GWAS catalog data accessed 04/2020) [37]. Moreover, we
identified 280 genes for SAT and 267 for OVAT which
showed differential methylation between the obesity states
in a previous work by Keller et al. [10] and were overlap-
ping with genes potentially discriminating between re-
sponders and non-responders (Additional file 2:Table
S4). Among them, 19 genes in subcutaneous adipose tis-
sue (SAT) and 19 in omental visceral adipose tissue
(OVAT) further showed significant transcriptional
changes according to differences in metabolic state [10].
GO enrichment analysis unraveled differentially methyl-
ated genes between responders and non-responders which
annotate to biological processes mainly involved in differ-
ent types of cell-adhesion (e.g., GO:0007156; homophilic
cell adhesion via plasma membrane adhesion molecules;
FDR =8.31×10
−14
, Additional file 2:TableS5).
In silico analyses of identified DMRs
Further, we employed a ChromHMM prediction model
to functionally annotate the top differentially methylated
DMRs to specific tissues most likely relevant for obesity
development (e.g., AT derived stem cells) or other meta-
bolically related processes (e.g., skeletal muscle or liver).
Data shows RNF39 and SLFN12 to be located in an ac-
tive TSS for AT derived mesenchymal stem cells. While
for the other DMRs this seems to be ubiquitous among
most tissues, for RNF39 it is limited to AT (Fig. 3c).
Keller et al. Genome Medicine (2020) 12:97 Page 7 of 18
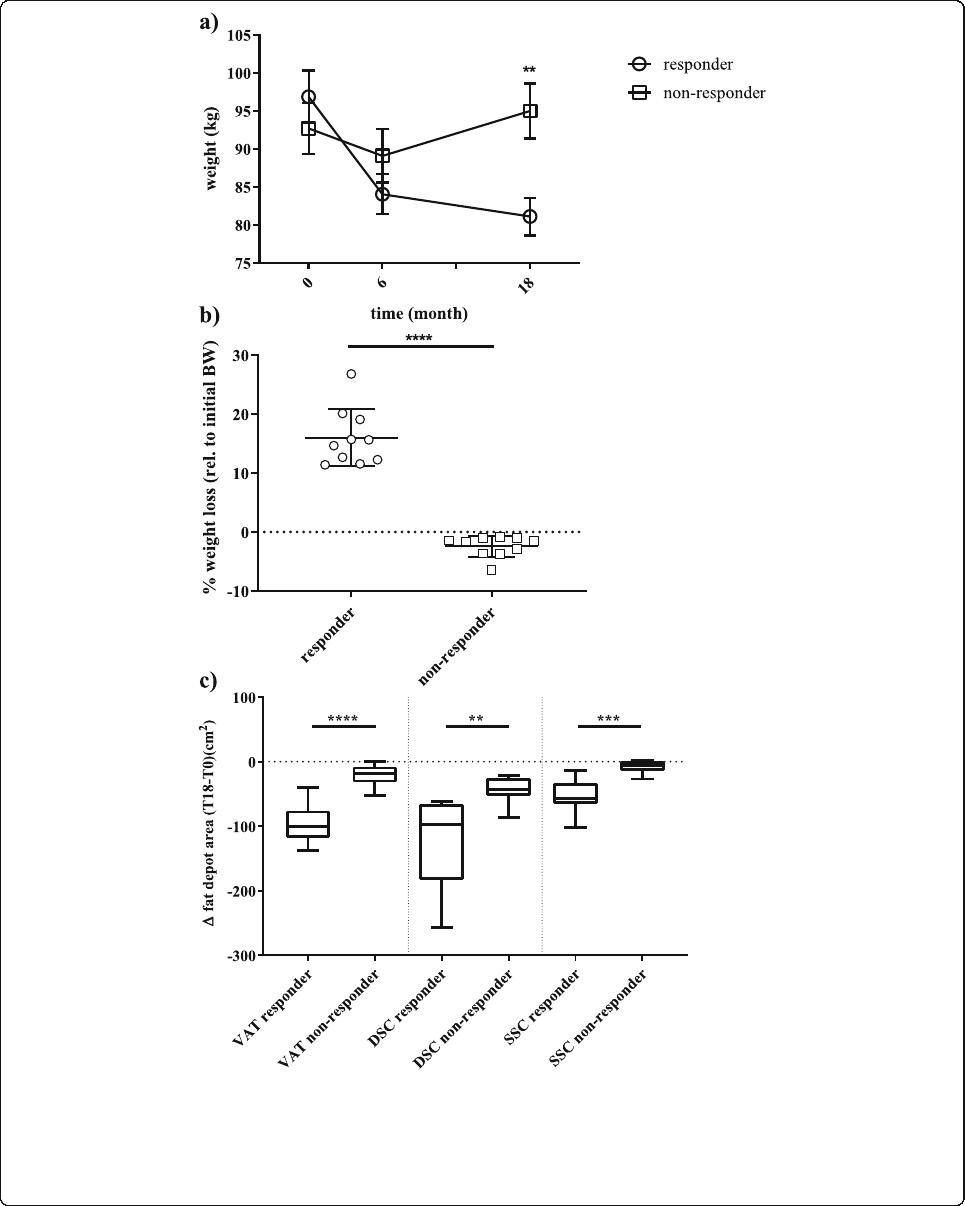
Fig. 2 Phenotypic differences between responders and non-responders to a lifestyle intervention. a shows the absolute weight of the responders
(N = 10) and non-responders (N = 10) subgroups over the three time points: baseline (T0), 6 months (T6), and 18 months (T18). Data is shown as
mean ± SD; b shows the relative (%, rel. to T0) weight-loss at 18 months for both subgroups. Data is shown as scatter dot plots (mean ± SD); c
shows the absolute changes of fat areas (cm2; VAT-visceral AT, DSC-deep subcutaneous AT, SCC- superficial subcutaneous AT) at 18 months
compared to the baseline area as boxplots (line = median) with whiskers representing min and max values; **P < 0.001;
***P <1×10
–3
; ****P <1×10
–4
Keller et al. Genome Medicine (2020) 12:97 Page 8 of 18

Table 2 Genetic regions discriminating responders from non-responders
Location Adj.P DeltaM Probes/DMR 2D-KS_p value SNPprobes Cross-reactive probes Genes Probes/gene
chr10:134150449-134150761 2.4E−15 − 0.082275 8 5E−21 0 0 LRRC27 81
chr6:49681176-49681392 6.1E−11 0.101266 8 1.3E−16 0 0 CRISP2 14
chr17:33759510-33760309 0.0000054 0.083168 12 1.1E−11 0 0 SLFN12 22
chr13:21919004-21919171 0.000038 − 0.090555 3 7.9E−11 0 3 LINC00539 39
chr19:57742110-57742424 0.005 0.05827 9 0.000000011 0 0 AURKC 16
chr6:30039130-30039802 0.0077 − 0.114807 18 0.000000016 3 0 RNF39 83
chr12:311645-313379 0.0082 0.126218 9 0.000000017 1 0 RP11-283I3.2, SLC6A12 9.59
chr20:61371016-61371809 0.024 − 0.041995 5 0.000000051 3 0 NTSR1 38
Differentially methylated DMRs between responders and non-responders to lifestyle intervention; including all datasets at baseline and post-intervention. Top candidate DMRs with adj. P ≤ 0.05. DeltaM represents the
difference of the mean average methylation rates between responders and non-responder as computed by metilene. The 2D-KS p value represents a two-dimensional variety of the Kolmogorov-Smirnov test used by
metilene. Probes/DMR represents the number of probes within a DMR. SNPprobes represent probes containing a SNP with a frequency > 0.01. Cross-reactive probes indicate potential off-target probe binding. Genes is
a comma-separated list of the genes cis to the DMR, and probes/gene is the total number of probes that are cis to the respective genes. Chromosomal location was annotated to genome assembly GRCh37 (hg19)
Keller et al. Genome Medicine (2020) 12:97 Page 9 of 18
DNA methylation changes due to specific weight-loss
interventions
Based on the findings from responder vs. non-responder
analyses, we investigated whether different lifestyle inter-
vention (dietary MED/LC vs LF) and PA had a
recognizable impact on CpG methylation in human blood
in an expanded analysis including all samples from all in-
terventions together (N = 120; T0 vs T18; Additional file 2:
Table S6). Thereby we identified 1146 CpG mapping to
1459 genes (84 CpGs with no gene) with a significant
methylation change (q value, < 0.05). Interestingly, the in-
dividual interventions (LF + PA; MED/LC + PA; LF-PA;
MED/LC-PA) did not show significant changes on CpG
(all q value > 0.05) or DMR (all adj. P > 0.05) specific DNA
methylation levels (Additional file 2:TablesS6–7). Of
note, we identified two DMRs on chromosome 1 (2D-KS
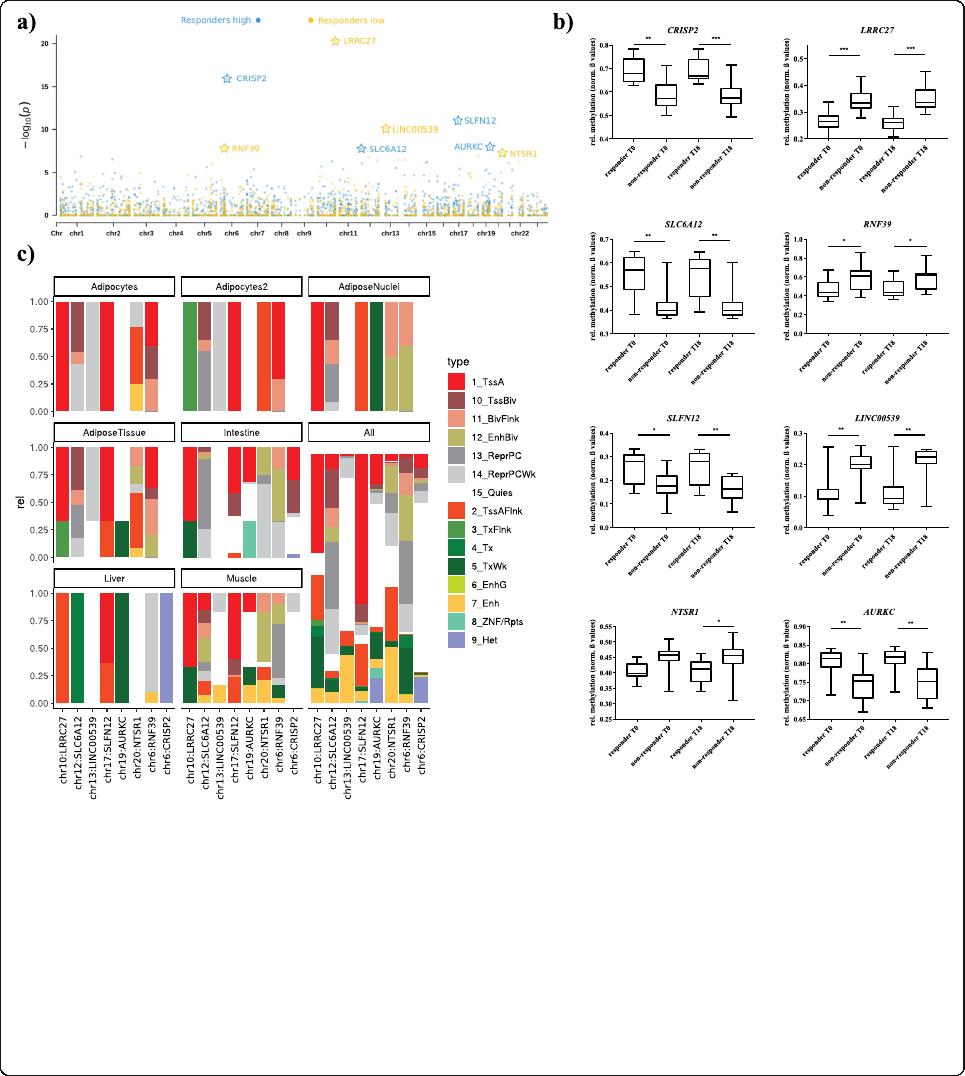
Fig. 3 Candidate genes discriminating responders from non-responders. a Combined P values presented as Manhattan plot for differently
methylated DMRs between responders vs. non-responders on a genome-wide scale; blue dots indicate regions were responders showed
significantly lower, green dots significantly higher methylation levels compared to non-responders; genes marked with a star remained significant
after correction for multiple testing (adj. P < 0.05), b Methylation levels at the identified genes between responders and non-responders
presented as box plots (normalized ß values) with whiskers representing min and max values, **P < 0.001; ****P <1×10
−4
. c ChromHMM
prediction for the significant DMRs (adj. P < 0.05). To identify putative target genes in the phenotype relevant target tissues: Intestine (Fetal-
Intestine-Large, Fetal-Intestine-Small, Small-Intestines), Adipos-Nuclei (Adipose-Nuclei), AdiposeTissue (Adipose-Nuclei, Adipose-Derived-
Mesenchymal-Stem-Cell-Cultured-Cells, Mesenchymal-Stem-Cell-Derived-Adipocyte-Cultured-Cells), Adipocytes (Mesenchymal-Stem-Cell-Derived-
Adipocyte-Cultured-Cells), Adipocytes2 (Adipose-Derived-Mesenchymal-Stem-Cell-Cultured-Cells) Liver (Liver), Muscle (HSMM-cell-derived-Skeletal-
Muscle-Myotubes-Cells, HSMM-Skeletal-Muscle-Myoblasts-Cells, Skeletal-Muscle-Female, Skeletal-Muscle-Male), and all (all 134 cells from Roadmap
Epigenome Gateway). ChromHMM coding for TssA-active TSS, TssBiv-Bivalent (Poised) TSS, BivFlnk-Bivalent Flanking, EnhBiv-Bivalent Enhancer,
ReprPC-Polycomb Repressed, ReprPCWk-Weakly Polycomb Repressed, Quies-Quiescent/low, TssAFlnk-Flanking TSS, TxFlnk-Flanking Transcribed, Tx-
Transcribed, TxWk-Weakly Transcribed, EnhG- Genetic Enhancer, Enh –Enhancer, ZNF/Rpts-ZNF Genes and Repeats, He-Heterochromatin
Keller et al. Genome Medicine (2020) 12:97 Page 10 of 18
