
Theoretical Study of Electronic Structures of Bi
2
Te
3
/Sb
2
Te
3
Superlattices
Hong Li, Daniel Bilc and S. D. Mahanti
Department of Physics and Astronomy, Michigan State University
East Lansing, MI 48823
ABSTRACT
To understand thermoelectric properties of multiplayer Bi
2
Te
3
/Sb
2
Te
3
superlattices, especially
their charge transport properties, electronic structure calculations were carried out using ab-initio
gradient corrected density functional theory. The superlattice structures of (1,1) and (1,2) Bi
2
Te
3
/Sb
2
Te
3
multilayers were optimized and their band structures were compared with each other.
Different lattice relaxation effects are observed for the two structures. The cross-plane and in-
plane effective masses for both these systems are found to be comparable, consistent with
experimental mobility measurements.
INTRODUCTION
To improve the efficiency of thermoelectric materials following the ideas of anisotropic
charge and energy transport, great efforts have been given to the synthesis of multilayer systems
with low-temperature growth techniques. Thermoelectric efficiency of a material is usually
characterized by its figure of merit (ZT), given by
lattel
KK
TS
ZT
+
=
σ
2
, (1)
where S is the Seeback coefficient,
σ
is the electrical conductivity, T is the absolute
temperature, K
latt
is the lattice thermal conductivity and K
el
is the electronic thermal
conductivity. According to this relation, a higher ZT value could be obtained by reducing K
latt
in
low-dimensional systems by introducing phonon scattering, provided one does not deteriorate
carrier mobilities.
The multilayer Bi
2
Te
3
/Sb
2
Te
3
superlattices (SL) grown by metallorganic chemical vapor
deposition were found to be good thermoelectric materials by Venkatasubramanian et al. [1] and
an enhanced ZT ~ 2.4 at 300K in p-type Bi
2
Te
3
/Sb
2
Te
3
SL was obtained. For some Bi
2
Te
3
/Sb
2
Te
3
layer arrangements, they observed that the cross-plane carrier mobilities, which are
along the direction perpendicular to the multilayers, were comparable to the in-plane mobilities.
However, this behavior is quite different from the observation for the bulk Bi
2
Te
3
, which shows
a very good in-plane mobility, but a rather small cross-plane mobility.
In order to understand this unusual behavior, electronic structure calculations for (1,1)
and (1,2) Bi
2
Te
3
/Sb
2
Te
3
SL systems have been performed using density functional theory (DFT)
and carrier mobilities are estimated from effective mass calculations. A preliminary report of
these calculations can be found in Ref. 2.
ELECTRONIC STRUCTURE CALCULATIONS
Electronic structure calculations were performed based on the density functional theory
(DFT) [3], using the generalized gradient approximation (GGA) of Perdew-Burke-Ernzerhof [4]
Mat. Res. Soc. Symp. Proc. Vol. 793 © 2004 Materials Research Society S8.37.1
for the exchange and correlation potential. The full-potential Linearized Augmented Plane Wave
(LAPW) method [5] was used and our calculations were performed using the WIEN2K package
[6]. The muffin-tin radii were taken to be R
MT
= 2.5 a.u. for all the atomic species. A plane-wave
expansion with RKmax = 7.0 was used and the integrations in the reciprocal space were
performed using the tetrahedron method taking 14 k-points in the Brillouin zone. In the self-
consistent energy calculations and the global lattice parameter optimizations, scalar relativistic
corrections, spin-orbit interactions and relativistic local orbital corrections were all incorporated.
But for the internal atomic coordinate relaxation, only scalar relativistic corrections were
included due to the limitations of the WIEN2K package.
RESULTS and DISCUSSION
Geometry optimizations
The superlattice strutures are composed of multiple ”quintuple layer” of Bi
2
Te
3
and
Sb
2
Te
3
, with each “quintuple layer” containing 2 Bi/Sb and 3 Te atom layers. This “quintuple
layers” are the building blocks of bulk Bi
2
Te
3
and Sb
2
Te
3
crystals, which have a hexagonal
structure with (P-3m1) space group symmetry. Since experimental determinations of the
structures of Bi
2
Te
3
/Sb
2
Te
3
superlattices are not available, we have to assume some starting
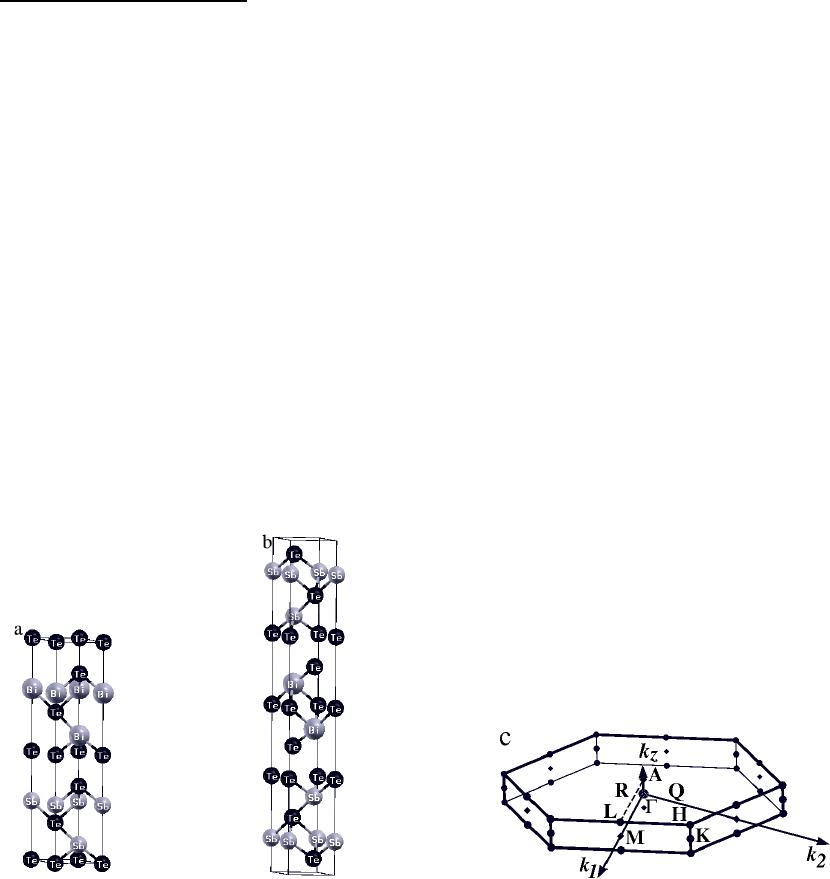
structures for our calculations. For (1,1) Bi
2
Te
3
/Sb
2
Te
3
SL, a hexagonal structure with (P3m1)
space group symmetry was used, with each unit cell containing one Bi
2
Te
3
layer and one Sb
2
Te
3
layer (Fig.1 (a)). The inversion symmetry of the bulk systems can not be preserved in this
structure because there are two different “quintuple layers” in a unit cell. The (1,2) Bi
2
Te
3
/Sb
2
Te
3
SL on the other hand has the same space group symmetry (P-3m1) as the bulk and the
inversion symmetry is preserved (Fig.1 (b)). The initial lattice parameters were taken as averages
of bulk Bi
2
Te
3
and Sb
2
Te
3
lattice parameters, which are a
(1,1)
= b
(1,1)
= (a
B
+ a
S
) / 2, c
(1,1)
= (c
B
+
c
S
) / 2 for the (1,1) superlattice and a
(1,2)
= b
(1,2)
= (a
B
+ 2a
S
) / 3, c
(1,2)
= (c
B
+ 2c
S
) / 3 for the (1,2)
superlattice. Here a
B,
a
S
, c
B,
c
S
are the lattice parameters of bulk Bi
2
Te
3
layer and one Sb
2
Te
3
respectively. For each superlattice structure, the initial atomic coordinates in either Bi
2
Te
3
or
Sb
2
Te
3
“quintuple layers” are assumed to take the same fractions as in the bulk Sb
2
Te
3
crystal. In
bulk Bi
2
Te
3
and Sb
2
Te
3,
two different types of Te atoms exist. We refer to the Te atom lying in
the Van der Waals gap and bonded to one layer of Bi(Sb) atoms and one layer of Te atoms as
Fig.1. Superlattice structures and Brillouin zone of (1,1) and (1,2) Bi
2
Te
3
/Sb
2
Te
3.
S8.37.2

Te1, and the Te atom which is bonded to two layers of Bi(Sb) atoms as Te2. So in the initial
structure, the Bi-Te1 and Bi-Te2 bond lengths are assumed equal to the Sb-Te1 and Sb-Te2 bond
lengths respectively.
The lattice geometries are optimized starting from the initial lattice structures. As a first
step, global lattice parameter optimizations (volume and c/a ratio) are performed, and then the
internal atomic coordinates are relaxed until the forces on the atoms are below 1.0 mRy/a.u. =
0.0136 eV/Å. For the (1,1) superlattice, the optimized volume and c/a ratio are 351.755 Å
3
and
4.698 respectively, which are 6.95% and 1.0% larger than their initial values. For the (1,2)
superlattice, the optimized volume and c/a ratio are 598.212 Å
3
and 7.115 respectively, being
6.0% and 0.5% larger than the initial ones. The internal atomic coordinates are then relaxed
while keeping the optimized volumes and c/a ratios fixed. The fractional changes of the atomic
positions from their initial values are found to be very small. Comparing to the initial bond
lengths in (1,1) superlattice, all the bond lengths of Bi-Te and Sb-Te increase, but by different
amounts. The Bi-Te1 bond length is 0.03 Å longer than the Sb-Te1 bond length and the Bi-Te2
bond length is 0.08 Å longer than Sb-Te2 bond length. Similar results are obtained for the (1,2)
SL structure, where the above two bond length differences are 0.04 Å and 0.07 Å respectively.
This result is understandable since Bi has longer bond lengths in the bulk Bi
2
Te
3
than Sb has in
bulk Sb
2
Te
3
.
Bandstructure calculations
Band structures were calculated along different symmetry directions in the Brilliouin
zone (Fig. 1 (c)) before and after global and internal relaxations. Dispersions for (1,1) and (1,2)
SLs after relaxation are given in Fig.2 (a) and Fig.3 (a) respectively. The highest valence bands
(HVB) of (1,1) and (1,2) SLs show quite different dispersion characters in the plane determined
by ΓM and ARL in the Brillouin zone. Along the ΓM direction, (1,1) SL has a much smaller
dispersion than the (1,2) SL, but along the LA direction, it shows a much larger dispersion than
the (1,2) SL. More over, the dispersion of (1,1) SL is opposite to the corresponding one in the
(1,2) SL along the ΓA direction, which corresponds to the cross-plane direction in real space. So
the major differences between (1,1) and (1,2) SL exist not only in the cross-plane direction, but
also along one of the in-plane directions. In contrast, for the lowest conduction bands (LCB), the
two structures show quite similar energy dispersions. From a detailed analysis of the band
structures of the two superlattices, we found that the valence band maximum (VBM) and
conduction band minimum (CBM) are both located on the same plane determined by ΓM and AL
in the Brillouin zone.
To see the lattice relaxation effects on the electronic structures, band structures near the
valance band maximum (VBM) and conduction band minimum (CBM) before and after
geometry relaxation of (1,1) and (1,2) SLs were calculated and are shown in Fig.2 (b), (c) and
Fig.3 (b), (c). In (1,1) case, the HVB dispersion along the ΓA direction is dramatically increased
after lattice relaxation, and similar dispersion tendency but with a much smaller change occurs in
the LCB dispersion. However, the energy dispersion along the in-plane directions is decreased
after the relaxation. Apparently, geometry relaxation affects the in-plane and cross-plane energy
dispersions in different ways in the (1,1) SL. For the (1,2) SL, the dispersion along the ΓA
direction after relaxation does not show any discernable change from that before relaxation, and
similar results are seen along the in-plane directions. So we believe that the lattice relaxations in
the two SLs have different effects on their electronic structures.
S8.37.3
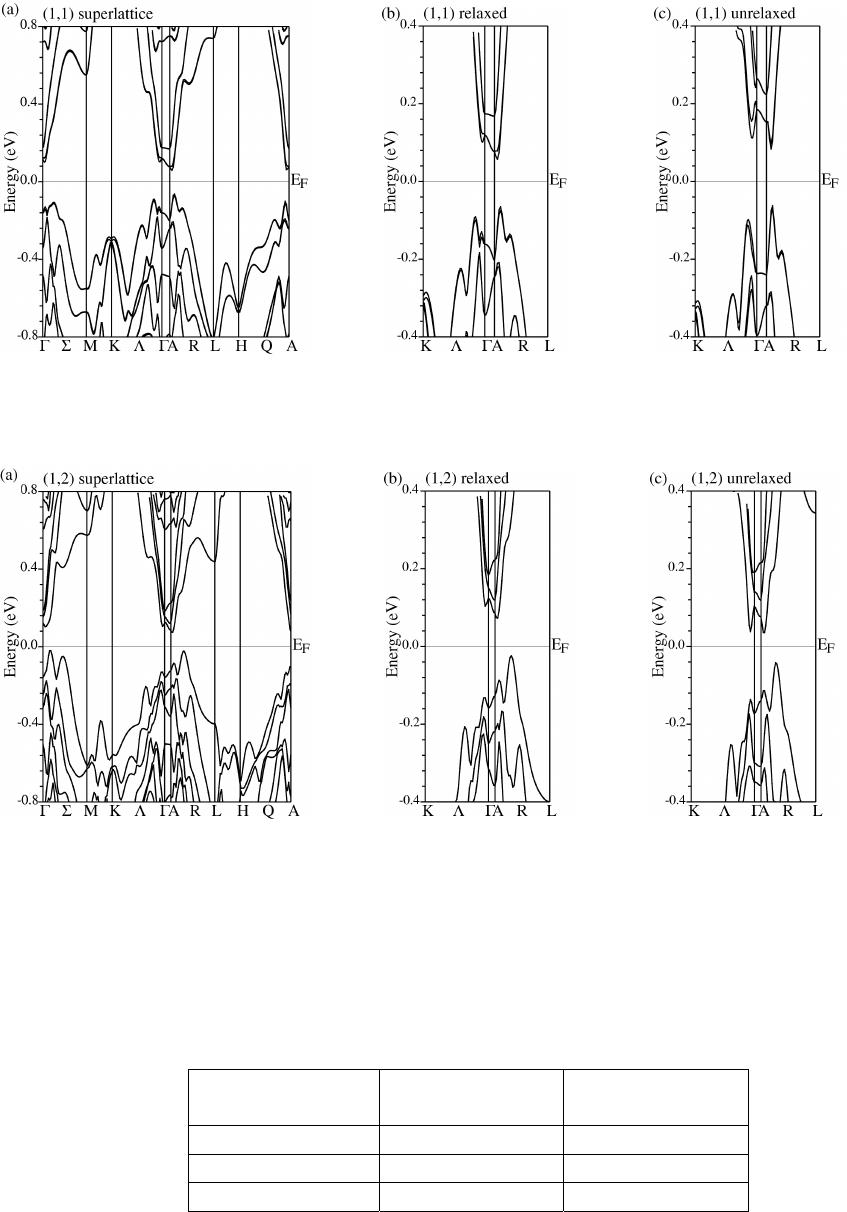
Fig.2. Band structures of (1,1) superlattice. (a) is the result after lattice relaxation, (b) and (c) are
the dispersions around VBM and CBM before and after lattice relaxation.
Fig.3. Band structures of (1,2) superlattice. (a) is the result after lattice relaxation, (b) and (c) are
the dispersions around VBM and CBM before and after lattice relaxation.
From band structure analysis, both superlattices are found to be indirect band gap
semiconductors. The indirect band gaps before and after relaxation are given in Table 1. For the
Table 1. Relaxation effects on indirect band gap in eV
(1,1)
superlattice
(1,2)
superlattice
Unrelaxed 0.083 0.027
Globally relaxed 0.083 0.045
Internally relaxed 0.056 0.075
S8.37.4

(1,1) SL, the indirect band gap decreases by ~0.027 eV due to lattice relaxation, whereas for the
(1,2) SL it increases by ~0.052 eV. Although these two SLs show different relaxation effects,
band gaps in both are reduced compared to the bulk systems (0.138 eV for Bi
2
Te
3
and 0.122 eV
for Sb
2
Te
3
[7]).
Effective mass and mobility anisotropy
The carrier effective masses were calculated after obtaining the VBM and CBM positions
in the HVB and LCB. The effective mass tensors in the principal axis system is given by
][][
2
2
21
k
E
m
ii
∂
∂
=
−
h , (2)
where i refers to the x, y and z directions, with y and z corresponding to the k
2
and k
z
directions in
the Brilliouin zone (Fig. 1 (c)) and x corresponding to the direction perpendicular to these two
directions. Since the direct band gaps are larger than 0.1 eV, we expect eq.(2) to give a
reasonable estimation of the effective mass near the band extrema. The effective masses for both
(1,1) and (1,2) SLs before and after relaxation are given in Table 2 and 3. Since scattering effects
due to phonons and superlattice interface cannot be calculated using ab-initio method, to
estimate the mobility of the carriers, we make a simplified assumption, namely the carrier
mobility is proportional to the inverse of the effective mass. We define the anisotropy of cross-
plane mobility to in-plane mobility as
zz
yyxx
m
mm
2
//
+
=
⊥
µ
µ
(3)
The results of mobility anisotropy for the VBM and CBM are also given in Table 2 and 3.
Let us first consider the effective masses and mobility anisotropy of the VBM of the (1,1)
SL. In the initial lattice structure, the effective mass along the x direction has a much larger value
than the effective masses in the y and z directions, producing a very large cross-plane to in-plane
anisotropy. After complete geometry relaxation, the effective mass in the x direction is
dramatically decreased and the ones in the y and z directions are increased. The overall effect on
the mobility anisotropy is to decrease its value from 1.60 to 0.92, which coincidently agrees with
the experimental value of 0.92 [1]. However in the (1,2) SL, the effective masses in the three
directions are all mildly increased after the complete geometry relaxation, and the mobility
anisotropy after relaxation is 0.85, which is ~20% smaller than the experimental value of 1.05.
For the effective masses associated with the CBM, all the values increase after complete
geometry relaxation. The mobility anisotropy in the (1,1) SL shows very little change, but the
Table 2. Relaxation effects on VBM effective masses
Superlattice m
xx
/m
e
m
yy
/m
e
m
zz
/m
e
µ
⊥
/µ
//
Unrelaxed 0.177 0.060 0.074 1.60
Globally relaxed 0.142 0.059 0.092 1.09
(1,1)
Internally relaxed 0.106 0.085 0.104 0.92
Unrelaxed 0.116 0.039 0.069 1.12
Globally relaxed 0.129 0.039 0.094 0.89
(1,2)
Internally relaxed 0.146 0.041 0.110 0.85
S8.37.5

Table 3. Relaxation effects on CBM effective masses
Superlattice m
xx
/m
e
m
yy
/m
e
m
zz
/m
e
µ
⊥
/µ
//
Unrelaxed 0.105 0.067 0.337 0.26
Globally relaxed 0.119 0.132 0.471 0.27
(1,1)
Internally relaxed 0.138 0.238 0.662 0.28
Unrelaxed 0.108 0.080 0.340 0.20
Globally relaxed 0.119 0.082 0.479 0.21
(1,2)
Internally relaxed 0.166 0.256 0.488 0.43
one in the (1,2) SL increases after lattice relaxation. Since no experimental measurements of
mobility are available for the n-type carrier, our results cannot be checked at this stage.
CONCLUSIONS
From our electronic structure calculations on the (1,1) and (1,2) Bi
2
Te
3
/Sb
2
Te
3
superlattices, carrier mobility anisotropies have been estimated assuming no anisotropy in the
relaxation rate. Our theoretical results are in good agreement with experimental measurements.
To investigate the reason for the better cross-plane mobility compared to the in-plane mobility,
larger (m,n) superlattices need to be studied. At the same time, more experimental measurements
of the superlattice electronic structures, such as the direct and indirect band gaps are needed to
test our theoretical results.
ACKNOWLEDGEMENTS
This research is partially supported by ONR and Center for Fundamental Materials Research of
Michigan State University.
REFERENCES
1. R. Venkatasubramanian, E. Siivola, T.Colpitts, and B. O'Quinn, Nature, 413, 597 (2001).
2. S. D. Mahanti, et al., “Chemistry, Physics and Materials Science of Thermoelectric
Materials”, ed. M. G. Kanatzidis, S. D. Mahanti and T. P. Hogan, (Kluwer Academic/Plenum
Publishers, 2003) pp.227-247.
3. P. Hohenberg and W. Kohn, Phys. Rev. 136, B864 (1964); W. Kohn and L. Sham, ibid. 140,
A1133 (1965).
4. J. P. Perdew, K. Burke, and M. Ernzerhof, Phys. Rev. Lett. 77, 3865(1996).
5. D. Singh, Planewaves, Pseudopotentials, and the LAPW Method, (Kluwer Academic,
Boston, 1994)
6. P. Blaha, K. Schwarz, G. Madsen, D. Kvasnicka, and J. Luitz, WIEN2K (Vienna University
of Technology, Vienna, 2001)
7. Unpublished results
S8.37.6
