RES E A R C H A R T I C L E Open Access
Balancing revenue generation with capacity
generation: case distribution, financial
impact and hospital capacity changes from
cancelling or resuming elective surgeries in
the US during COVID-19
Joseph E. Tonna
1*
, Heidi A. Hanson
1,2
, Jessica N. Cohan
1,2
, Marta L. McCrum
1
, Joshua J. Horns
1
,
Benjamin S. Brooke
1,2
, Rupam Das
1
, Brenna C. Kelly
1
, Alexander John Campbell
1
and James Hotaling
1
Abstract
Background: To increase bed capacity and resources, hospitals have postponed elective surgeries, although the
financial impact of this decision is unknown. We sought to report elective surgical case distribution, associated
gross hospital revenue and regional hospital and intensive care unit (ICU) bed capacity as elective surgical cases are
cancelled and then resumed under simulated trends of COVID-19 incidence.
Methods: A retrospective, cohort analysis was performed using insurance claims from 161 million enrollees from
the MarketScan database from January 1, 2008 to December 31, 2017. COVID-19 cases were calculated using
Institute for Health Metrics and Evaluation models. Centers for Disease Control (CDC) reports on the number of
hospitalized and intensive care patients by age estimated the number of cases seen in the ICU, the reduction in
elective surgeries and the financial impact of this from historic claims data, using a denominator of all inpatient
revenue and outpatient surgeries.
Results: Assuming 5% infection prevalence, cancelling all elective procedures decreases ICU overcapacity from 160
to 130%, but these elective surgical cases contribute 78% (IQR 74, 80) (1.1 trillion (T) US dollars) to inpatient hospital
plus outpatient surgical gross revenue per year. Muscul oskeletal, circulatory and digestive category elective surgical
cases compose 33% ($447B) of total revenue.
Conclusions: Procedures involving the musculoskeletal, cardiovascular and digestive system account for the largest
loss of hospital gross revenue when elective surgery is postponed. As hospital bed capacity increases following the
COVID-19 pandemic, restoring volume of these elective cases will help maintain revenue. In these estimates,
adopting universal masking would help to avoid overcapacity in all states.
Keywords: COVID-19 pandemic, Critical care capacity, Resource allocation, Available hospital beds, Overcapacity
© The Author(s). 2020 Open Access This article is licensed under a Creative Commons Attribution 4.0 International License,
which permits use, sharing, adaptation, distribution and reproduction in any medium or format, as long as you give
appropriate credit to the original author(s) and the source, provide a link to the Creative Commons licence, and indicate if
changes were made. The images or other third party material in this article are included in the article's Creative Commons
licence, unless indicated otherwise in a credit line to the material. If material is not included in the article's Creative Commons
licence and your intended use is not permitted by statutory regulation or exceeds the permitted use, you will need to obtain
permission directly from the copyright holder. To view a copy of this licence, visit http://creativecommons.org/licenses/by/4.0/.
The Creative Commons Public Domain Dedication waiver (http://creativecommons.org/publicdomain/zero/1.0/) applies to the
data made available in this article, unless otherwise stated in a credit line to the data.
1
Surgical Population Analytic Research Core (SPARC), Department of Surgery,
University of Utah Health, Salt Lake City, UT, USA
Full list of author information is available at the end of the article
Tonna et al. BMC Health Services Research (2020) 20:1119
https://doi.org/10.1186/s12913-020-05975-z
Background
The novel Coronavirus Infectious Disease 2019
(COVID-19) is a highly transm ittable virus that has re-
sulted in over 16 million infections worldwide [1].
United States (US) health systems are designed for
stable, predictable utilization patterns; they are generally
unprepared for surge medical need as is requ ired with
the COVID-19 pandemic. Surge situations have historic-
ally been addressed by deploying temporary medical
teams and tent facilities, or have overwhelmed the avail-
able resources with resultant excess morbidity and mor-
tality [2]. Current estimates suggest at least 5% of the US
population will contract COVID-19, of whom 15% will
require hospitalization, and 5% will require intensive
care [3–5]. At this rate, there will be 5 infected patients
requiring hospitalization for every existing US hospital
bed in addition to concomitant hospitalized non-COVID
patients [6].
In order to decrease the resources needed during the
peak of COVID-19, many countries have adopted phys-
ical distancing to attempt to flatten the curve of
COVID-19 [7]. Some nations, such as China, have taken
extreme measures such as forced quarantines and a
complete shutdown of all aspects of society whereas
other countries such as Sweden have chosen to remain
largely open. The United States has emphasized physical
distancing and suspension of non-essential business op-
erations which have, until now, included elective surgical
procedures. This has resulted in hospitals in areas with
relatively few COV ID-19 patients, such as Utah, func-
tioning at only 30% of their typical inpatient and surg ical
capacity. The financial implications of cancelling elective
surgical procedures has been devastating for health care
systems with some systems currently losing upwards of
$25 million USD per week [8].
However, to mitigate large anticipated surges in hospi-
talizations and deaths over the coming months, US hos-
pitals need to sustainably absorb increases in patients
requiring hospitalization and intensive care, while con-
tinuing to care for non-COVID patients. After a state-
ment from the American College of Surgeons (ACS),
many hospit als across the country ceased elective sur-
gery to free beds and limit patient exposure. Recent
models have suggested that the surgical backlog from
these cancellations will be significant [9]. While cancel-
ling elective surgical cases has inc reased capacity, the fi-
nancial impact of these surgeries, including relative
financial contribution by case type, has not been de-
scribed. Furthermore, the epidemiology of the deferred
elective surgical cases, case counts, and their resultant
contribution to bed capacity has not been described.
We estimate the financial implications of cancelling
elective surgeries using a national insurance claim data-
base, Truv en MarketScan (MS). This information can be
used to inform strategies for resuming elective surgical
procedures. We describe regional differences in capacity
of US hospitals to absorb COVID-related inpatient
surges if measures are not taken to slow the spread, de-
scribe elective case distribution, and present the relative
financial impact and case counts of resumption of elect-
ive surgical cases.
Methods
Our analysis is reported according to the Strengthening
the Reporting of Observational Studies in Epidemiology
(STROBE) Guidelines [10]. Thi s study did not meet cri-
teria for review by the Institutional Review Board at the
University of Utah, Salt Lake City, Utah, USA according
to United States law under the Health Insurance Port-
ability and Accountab ility Act (HIPAA) as all data was
fully de-identified.
Data source and study population
Gross inpatient hospital revenue, outpatient surgical rev-
enue, and inpatient and ICU (I/ICU) beds were esti-
mated using Truven MarketScan (MS). MS billing data
captured 8–16% of the entire US population from 2013
to 2017. For every MS patient, we determined the total
number of I/ICU days from 2008 to 2017 for 161 million
(M) enrollees and aggregated visit counts by month,
state, and major diagnostic category (MDC). A person
who switches insurance providers will appear serially in
MS with two different IDs, thus the overall population is
likely to be slightly smaller. Elective surgery admissions
were identified by surgery revenue codes not associated
with emergency revenue or provider codes. Surgical ad-
missions were based on the presence of a surgical rev-
enue code (REVCODE = 0360, 0361, 0362, 0367, 0369,
0975) or admission type (ADM TYP = 1) associated with
the admission. Admissions occurring within 30 days
post-elective (including outpatient) surgery were consid-
ered complications and categorized as resulting from
elective surgery. Gross revenue was aggregated by MDC
codes and surgical (elective vs non-elective) vs non-
surgical. Analysis by MDC excluded eye, human im-
munodeficiency virus, health status and missing
categories.
Study variables and outcomes
MS data were used to report gross hospital revenue de-
rived from inpatient admissions and outpatient surgeries
for each MDC category by elective vs non-elective surgi-
cal and non-surgical. We calculated proportion of gross
revenue from elective surg eries by state, and the propor-
tion of I/ICU beds unoccupied, and occupied by elective
and emergent cases by state. The average number of un-
occupied beds was defined as the difference between the
average number of I/ICU days and the maximum
Tonna et al. BMC Health Services Research (2020) 20:1119 Page 2 of 7
number of I/ICU days in a given state. We used data
from the Harvard Global Health Institute (HG HI) to
identify the total number of I/ICU patie nt beds per state
and applied the proportion from the MS data to obtain
estimates of occupied beds [11].
The Centers for Disease Control (CDC) Morbidity and
Mortality Weekly Report (MMWR) was used to calcu-
late the number of expected I/ICU beds occupied by age
group [12]. We applied these age-specific rates to 5% of
each state’s population using 2018 U.S. Census Bureau
age-specific population estimates to calculate the num-
ber of expected hospitalizations and inpatient cases by
state [13]. We calculated lower bound (LB) and upper
bound (UB) estimates based on the CDC’s reported
uncertainty.
Statistical analysis
In order to estimate the financial implications of cancel-
ling or resuming elective surgical cases, we calculated
the distribution of gross revenue by MDC code and then
by elective and non-elective surgical, and non-surgical
classifications. To inform the balance of revenue and
capacity generation, we illustrate the effect of
cancellation of elective surgical cases on hospital cap-
acity using the projections from the Institute for Health
Metrics and Evaluation [14]. The models incorporate
data on observed COVID-19 deaths, hospitalizations,
and cases and are updated daily. Three scenarios are es-
timated: 1) The current projection assuming social dis-
tancing when deaths are higher than 0.8 per 100,000
people, 2) Continued easing of social distancing
mandates, and 3) Universal Masks (95% use in public).
We assumed the incidence density curves were single
modal, with the highest peak being the first spike in
cases. We assumed that patients occupied a hospital or
ICU bed for an average of 9 days. Capacity was calcu-
lated as the difference between bed occ upancy at the
state level during the highest peak of cases and the num-
ber of hospital or ICU beds in the state.
We illustrated gross revenue by MDC code and by
classification. We calculated the number of hospitalized
patients in each state durin g the simulated pandemic
peak using 11-day inpatient and 9-day ICU length of
stay [4, 5, 15]. We then calculated the ratio of cases to
total number of available beds per state with and with-
out removal of elective surgery.
Results
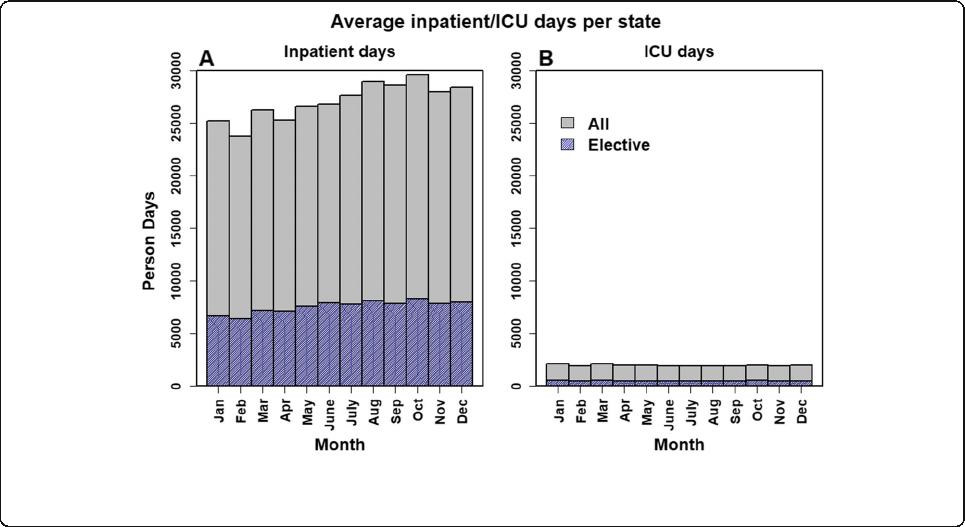
Across the U.S. there were an average of 1,442,013
(Interquartile range [IQR]: 1,378,039, 1,507,994) in-
patient days per month and 104,265 ([IQR] 101,961,
104,842) ICU days per month in the MS sample.
Roughly 30% of these days were associated with elective
surgery (Fig. 1). We applied these percentages to US
hospital data and classified beds as emergent, elective,
and available. Among 735,996 hospital beds in the US,
351,369 were emergent, 136,264 were elective, and 248,
363 were available.
Financial impact
Elective surgical cases contribute 78% (IQR of statewide
variation 74, 80) to of the gross inpatient and outpatient
Fig. 1 Average Proportion of Inpatient and ICU Person Days per State Resulting from Elective Surgery. Data from 161 million Marketscan patients
from 2008 to 2017 displaying aggregated counts of hospital and ICU beds in total and those resulting from elective surgery averaged across all
states. For each month
Tonna et al. BMC Health Services Research (2020) 20:1119 Page 3 of 7
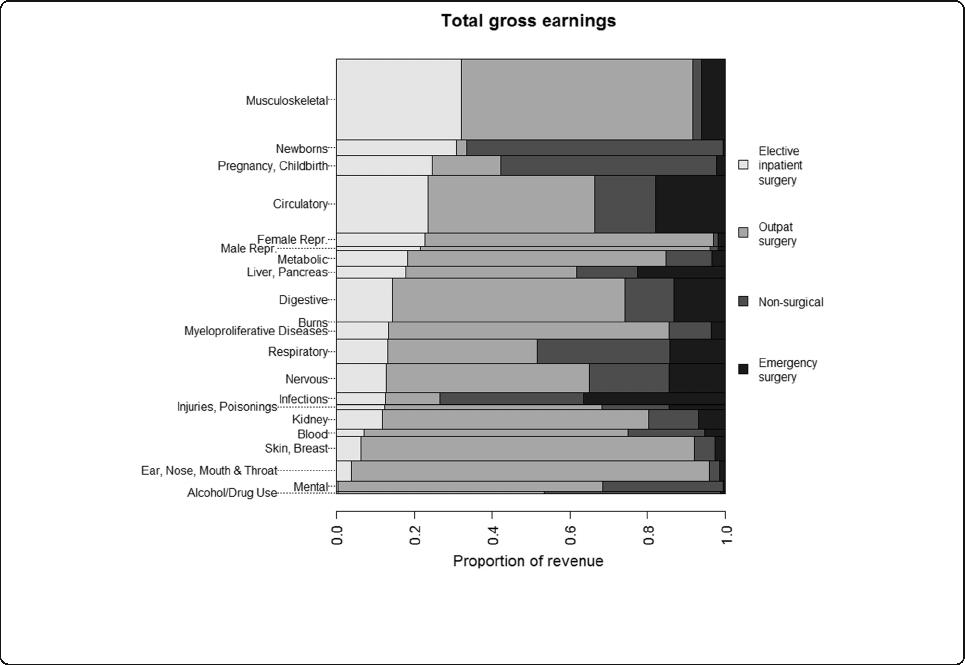
surgical revenue per year for hospitals represented in
our sample, or 1.1 trillion US dollars. This value varies by
MDC from $488 M to $231 billion (B) (median 39B; IQR
16B, 59B) (Fig. 2). Within each MDC, the percent of rev-
enue from elective surgical cases varies from < 27 to 97%
(median 68%; IQR 53, 86). When restricting our analyses to
inpatient-derived revenue, elective surgery accounted for
43% (IQR of statewide variation 40, 45) of total gross rev-
enue, or $254B. This value varies by MDC from < 1 to 88%,
($25 M to $80B). The relative financial contribution of
elective surgical cases varies regionally and has important
financial implications for hospital specific decisions on re-
sumption of these elective procedures (Fig. 3).
Case counts
With the cancellation of elective surgery, there is a need
to balance revenue generation with capacity increases.
Elective surgical procedures contribute 3B cases in the
MS population, of which 7.9 M are inpatient. This varies
by MDC (median 96 M [IQR 47 M, 224 M], range 1.9 M
– 515 M), of which 197,396 (IQR 86781, 372,544; range
915–2.4 M) are inpatient. Elective musculoskeletal, cir-
culatory and digestive categories comprise 1.1B cases, of
which 3.8 M are inpatient. These three categories to-
gether compose 13% of hospital admissions, but 23%
($142B) of inpatient gross revenue. Including outpatient
surgical cases, they compose 33% ($447B) of total in-
patient and surgical-outpatient hospital revenue.
Hospital and ICU capacity
Without cancelling elective surgery, median state hospital
and ICU capacity was 4967 (IQR 1867, 6100) beds, and
743 (IQR 254.94, 944.37) respectively. This increased to
7692 (IQR 2553, 9679) hospital beds, and 991 (IQR 298,
1197) ICU beds if elective surgeries were cancelled.
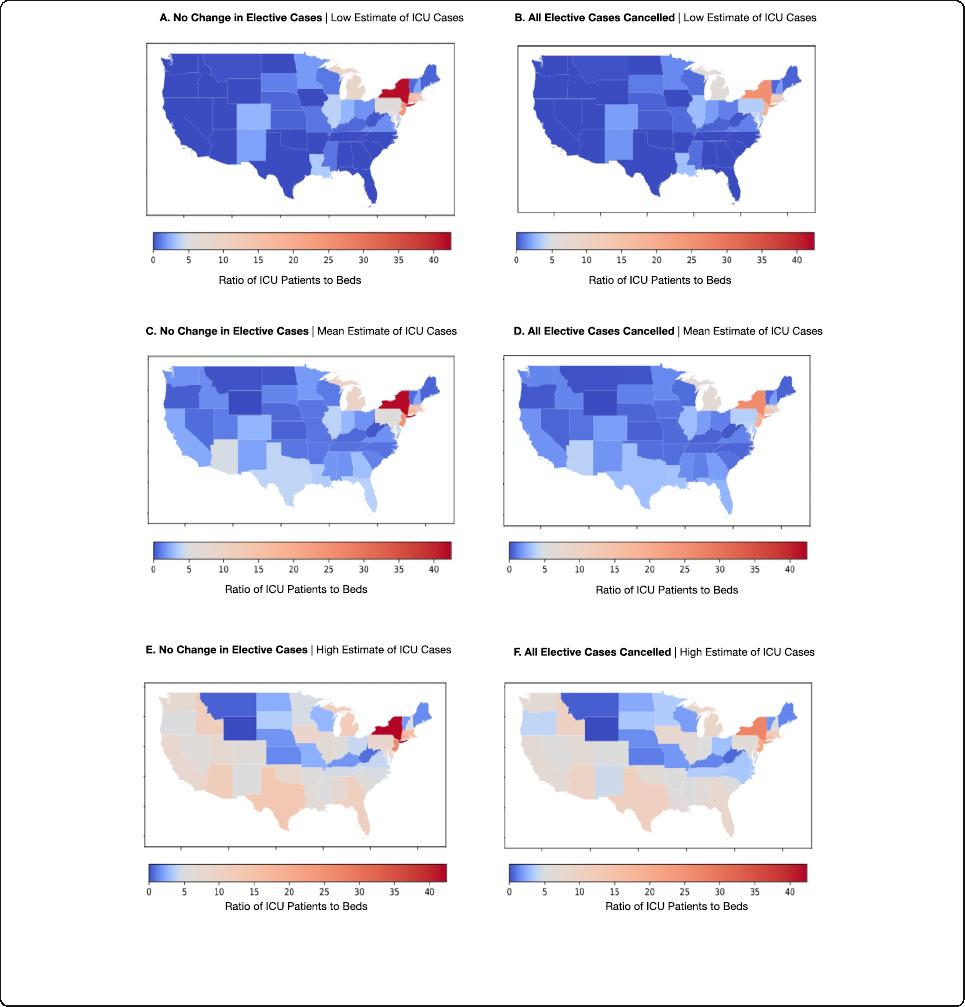
There is variability in hospital capacity by state (Fig. 4 ).
As modeled, states would have mean 3.98 patients re-
quiring admission per available ICU bed (Median 1.67;
IQR: 0.89–3.79) (Fig. 4a, c). This distribution is highly
skewed, with Ne w York, New Jersey, Massachusetts,
Michigan, and Pennsylvania having the highest patient
to bed ratios. If mandates continue to be lifted, this in-
creases to mean 5.25 patients per bed (Median 2.80;
IQR: 1.59–5.53) (Fig. 4e). If Universal Mask wearing is
followed in all public locations, states do not reach over-
capacity levels on average. Removing elective surgeries
will alleviate some of this stress (Fi g. 4d), with LB esti-
mates of an average of 2.37 ICU patients per bed IQR
(0–1.98) (Fig. 4b) and UB estimates of an average 3.92
(IQR 1.29–4.03) (Fig. 4f).
Fig. 2 Financial contribution of major diagnostic categories (MDC) to gross hospital revenue. Data from 161 million Marketscan patients from
2008 to 2017 displaying aggregated gross hospital revenue by surgery type, separated by major diagnostic category (MDC), across the US. Levels
are listed in descending order the percentage of each MDC category contributed by elective inpatient cases. Level width is proportional to the
absolute value in US dollars
Tonna et al. BMC Health Services Research (2020) 20:1119 Page 4 of 7
Discussion
Using billing and utilization data to model the financial
contribution of elective surgical cases to hospital gross
revenue, we demonstrate that cessation of elective mus-
culoskeletal, cardiovascular and digestive cases account
for the largest loss of hospital gross revenue, at $447B or
33% of all inpatient and surgical-outpa tient revenue. In
contrast, by case count, musculoskeletal, pregnancy, and
circulatory categories account for the greatest contribu-
tion of elective inpatient cases. Applying case counts to
the availab le hospital beds, cancelling elective surgeries
at all US hospitals will decrease ICU overcapacity from
327 to 237% (lower bound) or from 525 to 392% (upper
bound) assuming 5% of the U.S. population is infected
as shown in our models, but at a financial cost. In light
of the significant contribution of elective surgeries to
gross hospital revenue, selective resumption of high con-
tributing elective MDC categories, in patients who are
COVID-19 negat ive, may be a way to resume surgery in
a financially sustainable way when deemed safe. Out-
comes from operative procedures in COVID-19 positive
patients were recently demonstrated to be significantly
worse, emphasizing the importance of careful patient se-
lection and pre-operative COVID-19 testing for risk
stratification in all patients, most especially for elective
surgery [16].
Continued provision of care to patients with COVID-
19 involves balancing increasing healthcare capacity with
sustaining revenue generation. Previous models have ad-
dressed the expected healthcare burden of COVID-19 in
various ways, but have not addressed revenue gener-
ation. To our knowledge, ours is the first to report case
distribution and financial contribution of elective surger-
ies. We incorporated state specific billing data, reporting
the relative contribution of elective surgeries to gross
hospital revenue, and case counts, by MDC code. Our
study informs the relative financial and capacity impact
from selective resumption of elective cases. Further, we
model the expected increase in bed capacity from
cancelling these surgeries. Tsai et al previously estimated
1.7 excess COVID-19 patients per hospital bed and 4 ex-
cess patients per critical care bed assum ing a 40% cumu-
lative infection rate over 12 and 18 months, and an
aggressive 50% bed availability [ 17 ]. Similarly, Murry
used occupancy data from Medicare and Medicaid pa-
tients to estimate a capacity gap of 17,000 ICU beds and
64,000 hospital beds at peak infection assuming some
measure of social distancing [18]. Our study differs from
these by modeling disease transmission under a lower
infection rate (5%) but faster course (100 days) than Tsai
et al, and in a worse-case scenario without complete
shelter in place orders, which 9 states do not currently
have [19]. We also incorporated state-specific data for
elective case volume and temporal variation. We demon-
strated substantial state-level variation in overcapacity.
This suggests an opportunity for regional cooperation
and resource redistribution.
Our results are generated using a financia l denomin-
ator of total inpatient revenue plus outpatient surgical
cases, and do not account for the Medicare population
that is not insured by Part C. We determined overcap-
acity values using consistent rates of infection across the
population in less than 100 days and assumption s that
regional rates are equal [6, 17, 18]. It is important to
note that we applied rates of disease progression from
regions prior to enforced distancing. Consistent with
this, we assumed a stable rate of disease progression of
100 days since first case and do not account for policy
responses to the pandemic, such as closure of non-
essential service and stay-at-home orders, which are
highly variable across states. It is important to note that
patterns of gross hospital revenue and ICU bed use were
based on the MS population which is not necessarily re-
flective of the U.S. population as a whole. In particular,
patients included in MS carry private insurance through
employers or employer-sponsored Medicare. Thus our
cohort may be biased towards younger, health ier, and
more affluent individuals and patt erns of healthcare
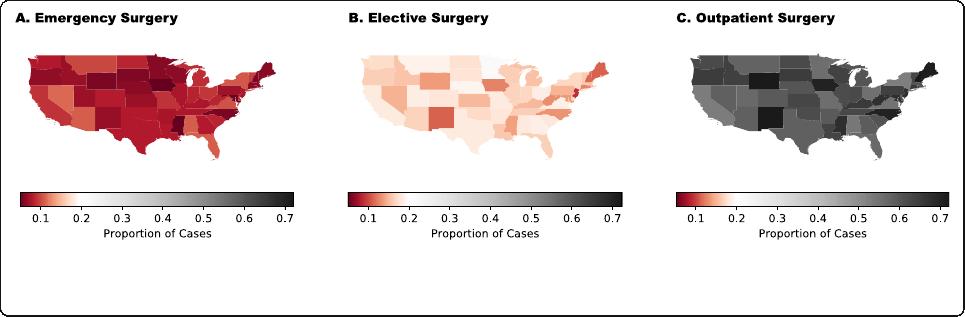
Fig. 3 Regional variation by state in percentage financial contribution of non-elective, elective inpatient and outpatient surgeries. Panel a shows
percent financial contribution to gross hospital revenue by state for non-elective cases. Panel b shows elective inpatient cases. Panel c shows
outpatient cases
Tonna et al. BMC Health Services Research (2020) 20:1119 Page 5 of 7
usage are likely to vary for the overall population. Our
models assumed that all non-emergent cases would be
postponed, however the degree to which a non-
emergent procedure can be considered elective varies by
patient age, comorbidities, etc. and our values may over-
estimate the proportion of surgeries that would truly be
delayed.
Conclusions
Elective inpatient surgeries account for 27% of hospital
and ICU beds and 43% of gross revenue, which varies
substantially by specialty. Among elective cases, muscu-
loskeletal, cardiovascular and digestive MDC categories
account for the largest contribution to hospital gross
revenue, at 33%. The greatest contribution of bed cap-
acity comes from musculoskeletal, pregnancy and circu-
latory categories. The cancellatio n of elective surgery
will result in a substantial increase in hospital and ICU
bed capacity, though this will vary between states, and at
significant financial cost. If Universal Mask wearing is
followed in all public locations, states do not reach over-
capacity levels on average.
Fig. 4 ICU Capacity across the US with and without cancelling elective surgeries. a-f Impact of Cancelling All Elective OR Cases on ICU Bed
Availability if 5% of U.S. Population Infected with COVID-19. Estimates of low (a), mean (c) and high (e) IHME models. Additional capacity through
cancellation of elective cases (b, d, f) was determined by applying estimates of the occupied and unoccupied beds resulting from elective
surgery from the Marketscan database to the Harvard Global Health Institute (HGHI) estimates of total inpatient and ICU beds in each state
Tonna et al. BMC Health Services Research (2020) 20:1119 Page 6 of 7

Abbreviations
ACS: American College of Surgeons; B: Billion; CDC: Centers for Disease
Control; COVID-19: Coronavirus Diseases 2019; DOI: Digital Object Identifier;
HGHI: Harvard Global Health Institute; HIPAA: Health Insurance Portability and
Accountability Act; ICU: Intensive care unit; IHME: Institute for Health Metrics
and Evaluation; I/ICU: Inpatient and intensive care unit; LB: Lower bound;
M: Million; MDC: Major diagnostic category; MMWR: Morbidity and Mortality
Weekly Report; MS: Truven MarketScan; NHLBI: National Heart, Lung, And
Blood Institute; NIH: National Institutes of Health; OSF: Open Science
Foundation; STROBE: Strengthening the Reporting of Observational Studies
in Epidemiology; UB: Upper bound; US: United States
Acknowledgements
Not applicable.
Authors’ contributions
JET, JH had full access to all the data in the study, takes responsibility for the
integrity of the data, the accuracy of the data analysis, and the integrity of
the submission as a whole, from inception to published article. JET, HH, BSB,
JC, MM, JJH, JH conceived study design; JET, HH, BSB, JC, MM, JJH, RD, BK,
AJC, JH contributed to data acquisition and analysis; JET, HH, JJH, JH drafted
the work; all authors revised the article for important intellectual content,
had final approval of the work to be published, and agree to be accountable
to for all aspects of the work.
Funding
JET is supported by a career development award (K23HL141596) from the
National Heart, Lung, And Blood Institute (NHLBI) of the National Institutes of
Health (NIH). The content is solely the responsibility of the authors and does
not necessarily represent the official views of the National Institutes of
Health. None of the funding sources were involved in the design or conduct
of the study, collection, management, analysis or interpretation of the data,
or preparation, review or approval of the manuscript.
Availability of data and materials
To facilitate research reproducibility, replicability, accuracy and transparency,
the associated analytic code is available on the Open Science Foundation
[20] (OSF) repository, [DOI https://doi.org/10.17605/OSF.IO/U53M4]at
[https://osf.io/u53m4]. The data that support the findings of this study were
obtained under license from Truven. Data were received de-identified in ac-
cordance with Section 164.514 of the Health Insurance Portability and Ac-
countability Act (HIPAA).
Ethics approval and consent to participate
This study did not meet criteria for review by the Institutional Review Board
at the University of Utah, Salt Lake City, Utah, USA according to United
States law under the Health Insurance Portability and Accountability Act
(HIPAA) as all data was fully de-identified.
Consent for publication
Not applicable.
Competing interests
JET received modest financial support for speakers fees from LivaNova and
from Philips Healthcare, outside of the work. The other authors declare that
they have no competing interests.
Author details
1
Surgical Population Analytic Research Core (SPARC), Department of Surgery,
University of Utah Health, Salt Lake City, UT, USA.
2
Department of Population
Health Sciences, University of Utah Health, Salt Lake City, UT, USA.
Received: 14 May 2020 Accepted: 25 November 2020
References
1. Coronavirus disease (COVID-19) situation report-189. World Health
Organization. https://www.who.int/docs/default-source/coronaviruse/
situation-reports/20200727-covid-19-sitrep-189.pdf?sfvrsn=b93a6913_2.
Accessed 27 Jul 2020.
2. Dosa D, Feng Z, Hyer K, Brown LM, Thomas K, Mor V. Effects of hurricane
Katrina on nursing facility resident mortality, hospitalization, and functional
decline. Disaster Med Public Health Prep. 2010;4(Suppl 1):S28–32.
3. Wu Z, McGoogan JM. Characteristics of and important lessons from the
coronavirus disease 2019 (COVID-19) outbreak in China: summary of a
report of 72314 cases from the Chinese Center for Disease Control and
Prevention. JAMA. 2020;323(13):1239–42.
4. ZhouF,YuT,DuR,FanG,LiuY,LiuZ,XiangJ,WangY,SongB,GuX,etal.
Clinical course and risk factors for mortality of adult inpatients with COVID-19 in
Wuhan, China: a retrospective cohort study. Lancet. 2020;395(10229):1054–62.
5. Guan WJ, Ni ZY, Hu Y, Liang WH, Ou CQ, He JX, Liu L, Shan H, Lei CL, Hui
DSC, et al. Clinical characteristics of coronavirus disease 2019 in China. N
Engl J Med. 2020;382(18):1708–20.
6. Emanuel EJ, Persad G, Upshur R, Thome B, Parker M, Glickman A, Zhang C,
Boyle C, Smith M, Phillips JP. Fair allocation of scarce medical resources in
the time of Covid-19. N Engl J Med. 2020;382(21):2049–55.
7. Social distancing, quarantine and isolation. https://www.cdc.gov/
coronavirus/2019-ncov/prevent-getting-sick/social-distancing.html. Accessed
23 Apr 2020.
8. Werner E, Harris S, Goldstein A. Hospital relief money slow to reach places that
need it most, lawmakers and industry groups say. Washington post; 2020.
https://www.washingtonpost.com/us-policy/2020/04/16/bailout-money-
hospitals-slow-get-out-missing-some-places-that-need-it-most-lawmakers-
industrygroups-say/. Accessed 23 Apr 2020.
9. Collaborative C. Elective surgery cancellations due to the COVID-19
pandemic: global predictive modelling to inform surgical recovery plans. Br
J Surg. 2020. https://doi.org/10.1002/bjs.11746.
10. von Elm E, Altman DG, Egger M, Pocock SJ, Gotzsche PC, Vandenbroucke
JP, Initiative S. The Strengthening the Reporting of Observational Studies in
Epidemiology (STROBE) statement: guidelines for reporting observational
studies. PLoS Med. 2007;4(10):e296.
11. Can hospitals around the nation keep up? Harvard Global Health Institute.
https://globalepidemics.org/our-data/hospital-capacity/. Accessed 4 Apr 2020.
12. Team CC-R. Severe outcomes among patients with coronavirus disease
2019 (COVID-19) - United States, February 12-march 16, 2020. MMWR Morb
Mortal Wkly Rep. 2020;69(12):343–6.
13. Annual county resident population estimates by age, sex, race, and Hispanic
origin: April 1, 2010 to July 1, 2018. United States Census Bureau. United States
Census Bureau. 2018 ed. https://www.census.gov/newsroom/press-kits/2019/
detailed-estimates.html. Accessed 5 Apr 2020.
14. Institute for Health Metrics and Evaluation (IHME). COVID-19 Projections.
University of Washington. https://covid19.healthdata.org/projections.
Accessed 12 July 2020.
15. Wang D, Hu B, Hu C, Zhu F, Liu X, Zhang J, Wang B, Xiang H, Cheng Z,
Xiong Y, et al. Clinical characteristics of 138 hospitalized patients with 2019
novel coronavirus-infected pneumonia in Wuhan, China. JAMA. 2020;
323(11):1061–9.
16. Nepogodiev D, Bhangu A, Glasbey JC, Li E, Omar OM, Simoes JFF, Abbott TEF,
Alser O, Arnaud AP, Bankhead-Kendall BK, et al. Mortality and pulmonary
complications in patients undergoing surgery with perioperative SARS-CoV-2
infection: an international cohort study. Lancet. 2020;396(10243):27–38.
17. American hospital capacity and projected need for COVID-19 patient care.
Health Affairs. 2020. https://doi.org/10.1377/hblog20200317.457910.
Accessed 4 Apr 2020.
18. IHME COVID-19 health service utilization forecasting team, Murray C.
Forecasting COVID-19 impact on hospital bed-days, ICU-days, ventilator-
days and deaths by US state in the next 4 months. medRxiv. https://doi.org/
10.1101/2020.03.27.20043752.
19. Ortiz JL, Hauck G. Coronavirus in the US: how all 50 states are responding –
and why nine still refuse to issue stay-at-home orders. USA Today; 2020.
https://www.usatoday.com/story/news/nation/2020/03/30/coronavirus-stay-
home-shelter-in-place-orders-by-state/5092413002/. Accessed 6 Apr 2020.
20. Foster ED, Deardorff A. Open Science Framework (OSF). J Med Libr Assoc.
2017;105(2):203–6.
Publisher’sNote
Springer Nature remains neutral with regard to jurisdictional claims in
published maps and institutional affiliations.
Tonna et al. BMC Health Services Research (2020) 20:1119 Page 7 of 7
