
METALLURGICAL AND MATERIALS TRANSACTIONS A VOLUME 28A, JULY 1997—1429
Amorphization Reaction of Ni-Ta Powders during Mechanical
Alloying
PEE-YEW LEE, JU-LUNG YANG, CHUNG-KWEI LIN, and HONG-MING LIN
This study examined the amorphization behavior of Ni
x
Ta
1002x
alloy powders synthesized by me-
chanically alloying (MA) mixtures of pure crystalline Ni and Ta powders with a SPEX high energy
ball mill. According to the results, after 20 hours of milling, the mechanically alloyed powders were
amorphous for the composition range between Ni
10
Ta
90
and Ni
80
Ta
20
. A supersaturated nickel solid
solution formed for Ni
90
Ta
10
, as well. X-ray diffraction analysis reveals two different types of amor-
phization reactions. Through an intermediate solid solution and by direct formation of amorphous
phase. The thermal stability of the amorphous powders was also investigated by differential thermal
analysis. As the results demonstrated, the crystallization temperature of amorphous Ni-Ta powders
increased with increasing Ta content. In addition, the activation energy of amorphous Ni-Ta powders
reached a maximum near the eutectic composition.
I. INTRODUCTION
PREPARING amorphous alloys based on IVa to VIa
group refractory transition metals is highly attractive, since
amorphous phases of these high melting temperature alloys
possess high crystallization temperatures.
[1]
However, the
high cooling rate necessary to bypass the nucleation and
growth of crystalline phases in the undercooled alloy melts
always severely restricts, for instance, amorphization of the
alloy with a high melting temperature by the liquid quench-
ing method.
[2]
As previous investigations demonstrated,
amorphous materials can be obtained by destabilizing a
solid phase’s crystallinity by a solid-state reaction.
[3,4]
Var-
ious techniques to synthesize amorphous alloys via solid-
state amorphization include hygrogenation, multilayer
interdiffusion, and mechanical alloying (MA).
[5,6]
Mechanical alloying was developed by Benjamin in the
early 1970s to produce superalloy powders strengthened by
oxide dispersions.
[7]
It is a high energy ball milling process
consisting of repeated mechanical mixing, cold welding,
fracturing, and rewelding of powders during ball-powder
collision events.
[8]
Owing to this unique novel milling be-
havior, MA allows materials scientists to circumvent ma-
terial limitations and manufacture alloys that are difficult
or impossible to produce by conventional melting and cast-
ing techniques. For instance, other investigators used MA
to successfully synthesize many equilibrium and/or non-
equilibrium phases in many alloy systems, including amor-
phous materials, quasicrystals, nanocrystalline materials,
rare earth magnets, and intermetallics.
[9,10]
Since the discovery of amorphous phase in mechanically
alloyed Ni
60
Nb
40
powder,
[11]
this technique has been applied
to numerous amorphous materials.
[6,9,10]
However, the Ni-
Ta binary system has received only limited attention.
PEE-YEW LEE, Professor and Director, and CHUNG-KWEI LIN,
Visiting Associate Professor, are with the Institute of Materials
Engineering, National Taiwan Ocean University, Keelung, Taiwan 202.
JU-LUNG YANG, Engineer, is with Sino-American Silicon Products,
Inc., Hsinchu, Taiwan 300. HONG-MING LIN, Professor and Chairman,
is with the Department of Materials Engineering, Tatung Institute of
Technology, Taipei, Taiwan 104.
Manuscript submitted November 22, 1996.
Therefore, this study investigates the feasibility of prepar-
ing amorphous Ni-Ta powders by MA, starting from ele-
mental Ni and Ta powders and using a shaker ball mill.
II. EXPERIMENTAL DETAILS
A. MA Processes
Elemental powders of Ni (99.98 pct, ,300 mesh) and
Ta (99.98 pct, ,325 mesh) were weighed to yield the de-
sired compositions, Ni
x
Ta
1002x
(x 5 10, 20, 30, 40, 50, 60,
70, 80, and 90), and then canned into an SKH 9 high speed
steel vial (40 mm in diameter and 50 mm in height) to-
gether with Cr steel balls (7 mm in diameter with ball-to-
powder ratio 5 2:1) under an argon-filled glove box, where
a SPEX* 8000 shaker ball mill (1200 rpm) was employed
*SPEX is a trademark of SPEX Industries, Edison, NJ.
for MA.
The overall MA processes lasted 20 hours and were
interrupted every 15 minutes for the first hour and every
30 minutes thereafter. Each interruption was followed by
an equal length of time (;30 minutes) to cool down the
vials. An appropriate amount of the mechanically alloyed
powders was extracted to examine the progress of amor-
phization.
B. Characterization of Mechanically Alloyed Powders
Techniques used to examine the status of amorphiza-
tion include X-ray diffraction, scanning electron micros-
copy (SEM), Vickers microhardness, and differential
thermal analysis (DTA). The X-ray analysis was per-
formed using a SIEMENS* D-5000 diffractometer with
a monochromatic Mo K
a
radiation (40 kV and 30 mA).
The microstructure and the morphology of the mechani-
cally alloyed powders were examined using a Hitachi
S-4100 scanning electron microscope. Next, the Vickers
microhardness (five tests for each specimen) was mea-
sured with a Matsuzawa MXT50-UL machine using a
load of 25 g. The thermal stability of the as-milled pow-

1430—VOLUME 28A, JULY 1997 METALLURGICAL AND MATERIALS TRANSACTIONS A
ders was examined using a DU PONT* 2000 differential
*DU PONT is a trademark of Du Pont de Nemours & Co., Inc.,
Wilmington, DE.
thermal analyzer, where the sample was heated from room
temperature to 1300 7C in a purified argon atmosphere at
a rate of 40 K/min.
III. RESULTS AND DISCUSSION
A. Crystalline-to-Amorphous Transformation
Ni
50
Ta
50
was chosen as a prototype to investigate the
amorphization behavior of Ni-Ta system during MA. The
powder morphology (Figures 1(a) through (d)) and particle
cross sections (Figures 1(e) through (h)) of mechanically
alloyed powders vs milling time were examined using
SEM. More specifically, the MA process for preparing
Ni
50
Ta
50
involves three stages: cold welding (0 to 1 hours),
fracturing (1 to 5 hours), and amorphization (5 to 20 hours).
During the cold welding stage, the mean particle size
sharply increased (starting from ,20 to ;1000
m
m, Fig-
ures 1(a) and (b)) and a typical lamellar structure formed
(Figures 1(e) and (f)). This phenomenon may be attributed
to the predominance of repetitive cold welding of Ni and
Ta elemental powders at the early stage of milling. The
individual layer thickness measured from Figure 1(f) (i.e.,
1 hour of milling) ranged from 0.4 to 4
m
m. As the milling
time increases, the particles are stressed continuously.
Eventually, fracturing dominates, thereby causing a decrease
in particle size and lamellar thickness; the fracturing stage
lasted 1 to 5 hours. Interestingly, during the fracturing stage,
the morphology of the milled powders becomes more spher-
ical (Figure 1(c), 5 hours of milling) than the original plate-
like powders (Figures 1(a) and 1(b)). A balance between cold
welding and fracturing of powders is gradually achieved,
leading to a relatively constant particle size (17 5 5
m
m,
measured from Figure 1(d)) at the end of the amorphization
stage. In addition, the refined lamellar structure obtained af-
ter 5 hours of milling (Figure 1(g)) became indistinguishable
at the end of processing (20 hours, Figure 1(h)).
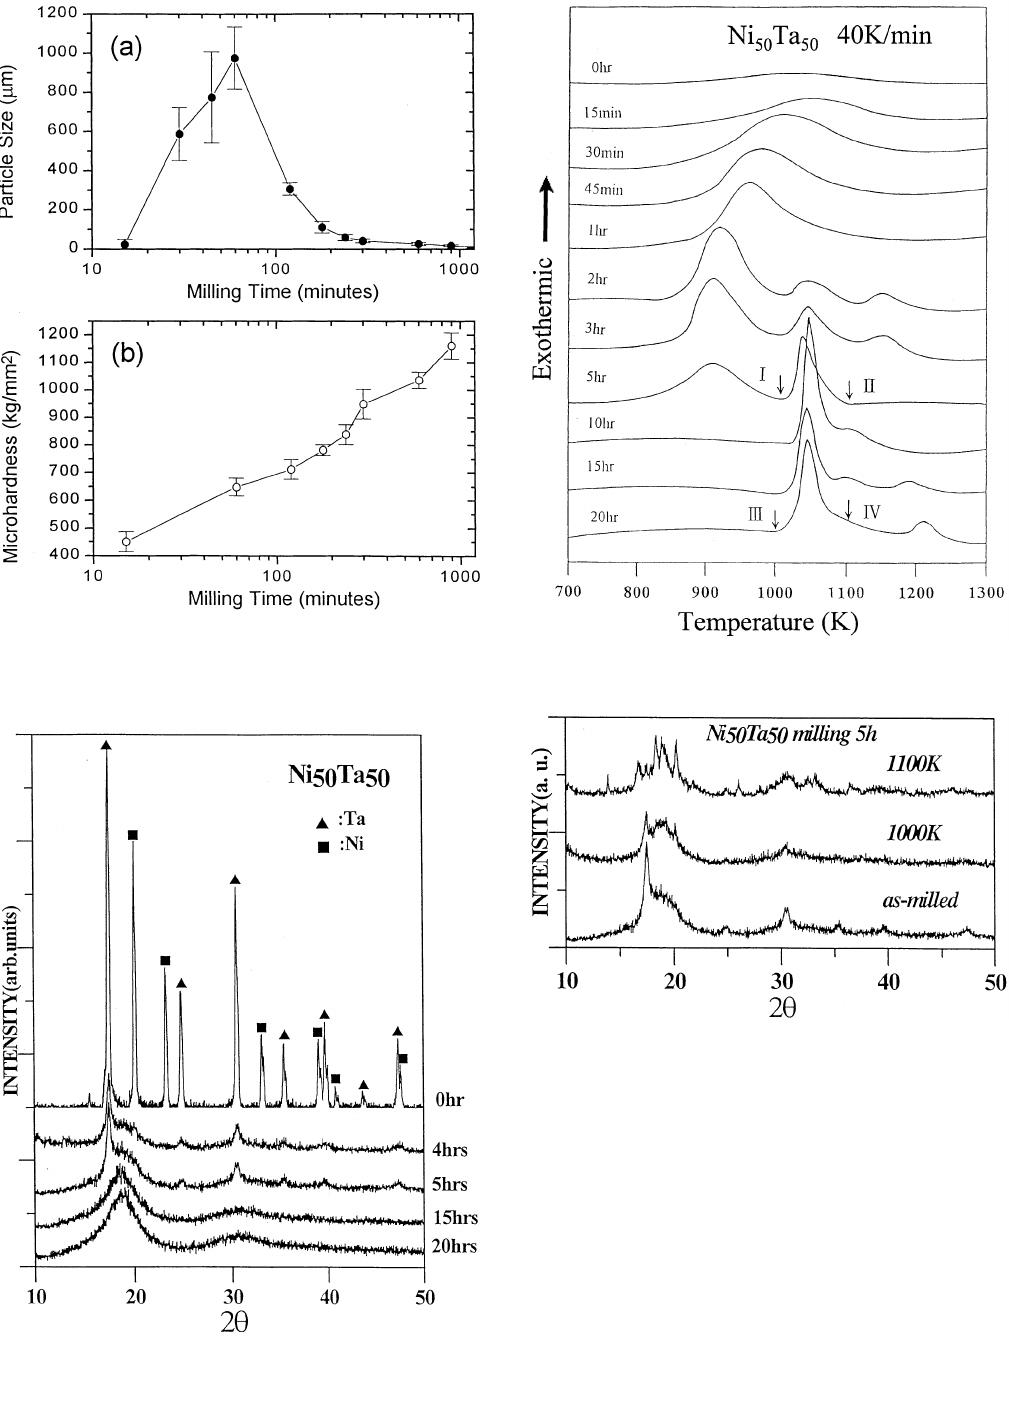
Figure 2(a) depicts the variation in particle sizes (mean
5 one standard deviation) for mechanically alloyed
Ni
50
Ta
50
powders as a function of milling time. In addition
to the change in particle size and the refinement of layer
thickness, microhardness measurements can be used to
monitor the progress of MA.
[12]
Figure 2(b) shows that mi-
crohardness increases throughout the cold welding and frac-
turing stages, and no significant change occurs during the
amorphization stage. This shows the same trend as reported
in the literature.
[12,13]
The refinement of layer thickness and
the increase in hardness have been used to model the MA
processing.
[13]
X-ray diffraction analysis is another conventional tech-
nique for monitoring the progress of amorphization. Figure
3 displays the X-ray diffraction patterns of as-milled
Ni
50
Ta
50
powders as a function of milling time. As this fig-
ure reveals, most Bragg peaks from pure Ni already dis-
appeared and the intensities of the Bragg peak from Ta
decreased after 5 hours of milling. The peaks of bcc Ta
also broadened asymmetrically toward the high-angle side
because of the dissolution of the smaller Ni atoms in the
bcc lattice. A decreasing intensity and broadening diffrac-
tion peaks are common during the early stage of the MA
process.
[10]
After 20 hours of ball milling, only a broad dif-
fraction peak appears around 2
u
5 18.7 deg, indicating that
fully amorphous powders have formed.
Furthermore, the crystalline-to-amorphous transforma-
tion behavior of Ni
50
Ta
50
was examined by differential ther-
mal analyses (DTA). Figure 4 presents the DTA traces of
the as-milled powders vs milling time, where two or three
exothermic peaks (indicating phase transformations) ap-
pear. Interestingly, as the milling time increases, the first
exothermic peak (850 to 1000 K) decreases and vanishes
after 5 hours; meanwhile, the second exothermic peak
(1000 to 1100 K) continuously increases. To further ex-
amine the implications of these peaks, two Ni
50
Ta
50
speci-
mens milled for 5 and 20 hours were annealed for 5 minutes
at 1000 and 1100 K, respectively, quenched to room tem-
perature, and then subjected to X-ray diffraction analysis.
Figure 5 shows the X-ray diffraction patterns of Ni
50
Ta
50
as milled for 5 hours and annealed powders. This figure
indicates that after annealing at 1000 K (marked as ‘‘I’’ in
Figure 4; i.e.,Ni
50
Ta
50
powders milled for 5 hours and an-
nealed at 1000 K for 2 minutes), the intensities for Ta (110)
and other high angle peaks decrease. This observation im-
plies that the percentage of amorphization increases after
annealing at 1000 K. Recall the refined lamellar structure
in Figure 1(g) after 5 hours of milling; the crystalline-to-
amorphous transformation has not yet been completed at
this stage. This layer structure, however, is still too ‘‘thick’’
for the interdiffusion of Ni or Ta to be completed. In ad-
dition, a previous study noted that the diffusivity of Ni
through amorphous Ni
50
Zr
50
film is at least 10,000 times
lower than that for Ni in Zr.
[14]
Therefore, the formation of
thin amorphous films at the layer boundaries may inhibit
any further diffusion of Ni or Ta. Annealing of the as-
milled (5 hours) powders at a temperature of 1000 K, which
is below the crystallization temperature of 1048 K of amor-
phous Ni
50
Ta
50
powder, may enhance the interdiffusion of
Ni-Ta layers and subsequently increase the proportion of
amorphous phase. Consequently, the phase transformation
of the first exothermic peak is a crystalline-to-amorphous
transition. This thermally activated solid-state amorphiza-
tion reaction exhibits the same trend as several rod-milled
Al
50
TM
50
(TM: transition metals) alloys.
[15,16]
On the other hand, crystalline phases form with powders
heat treated at 1100 K (marked as ‘‘II’’ in Figure 4), and
the second exothermic peak denotes an amorphous-to-crys-
talline transition.
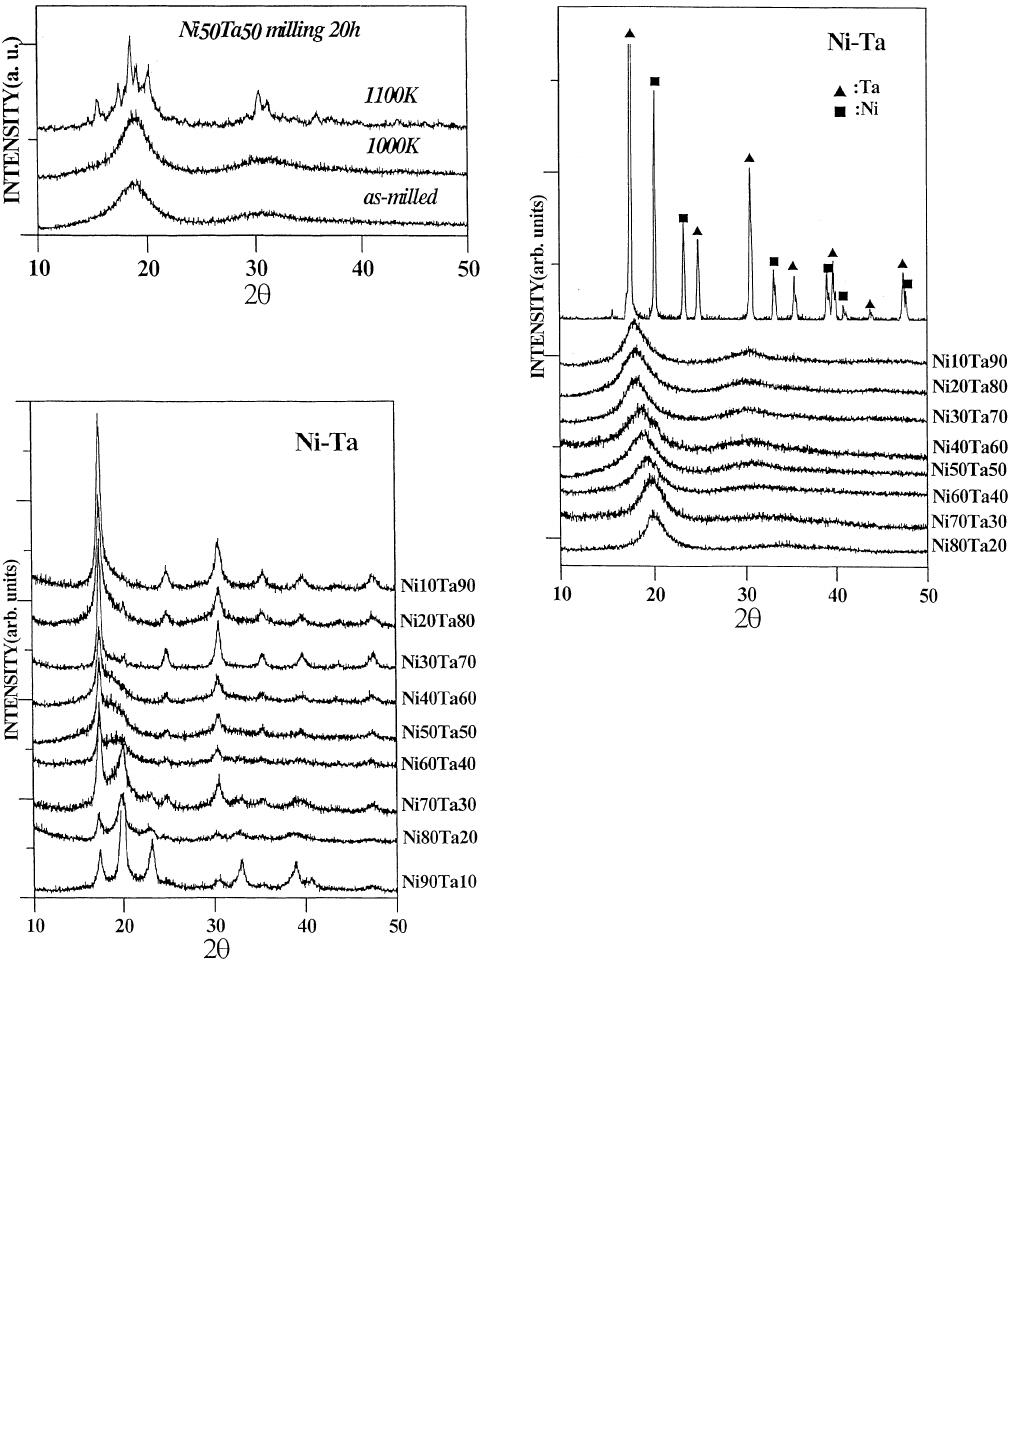
Similar procedures were followed for mechanically al-
loyed Ni
50
Ta
50
powders after 20 hours of processing. As
Figure 6 indicates, the X-ray diffraction patterns of as-
milled (20 hours) and annealed (at 1000 K, marked as
‘‘III’’ in Figure 4) powders exhibit an amorphous phase;
however, crystallization occurs after annealing at 1100 K
(marked as ‘‘IV’’ in Figure 4). This finding reconfirms that
an amorphous-to-crystalline transition occurs during the
second exothermic peak.
B. Mechanical Alloying of Ni-Ta System
1. Amorphization reaction
Weeber and Bakker
[10]
reported three different types of
amorphization reactions by MA of binary elemental powder
mixtures (A
x
B
y
). Type I denotes that the ‘‘effective crystal-

METALLURGICAL AND MATERIALS TRANSACTIONS A VOLUME 28A, JULY 1997—1431
Fig. 1—SEM micrographs of (a) through (d) powder morphologies and (e) through (h) particle cross sections of as-milled Ni
50
Ta
50
powders vs milling
time. Please note that different magnifications were used and the milling times were (a) and (e) 15 min, (b) and (f) 1 h, (c) and (g) 5 h, and (d) and (h)
20 h.
line size’’ continuously decreases and the peaks’ positions
shift, ultimately resulting in an amorphous alloy; i.e., the
solid solution is an intermediate stage. The second type
(type II) directly forms an amorphous alloy from the start-
ing elemental powders; i.e., the diffraction peak intensities
of the elements decrease and a broad peak’s intensity of
1432—VOLUME 28A, JULY 1997 METALLURGICAL AND MATERIALS TRANSACTIONS A
Fig. 2—The variations in (a) particle size and (b) microhardness of as-
milled Ni
50
Ta
50
powders vs milling time.
Fig. 4—DTA traces of mechanically alloyed Ni
50
Ta
50
powders as a
function of milling time.
Fig. 5—X-ray diffraction patterns of Ni
50
Ta
50
powders as milled for 5 h
and annealed at 1000 and 1100 K for 10 min.
Fig. 3—X-ray diffraction patterns of mechanically alloyed Ni
50
Ta
50
powders for different milling times.
the amorphous alloy increases. For the final type, inter-
metallics form as intermediate products and further milling
results in an amorphous alloy.
In this study, we observed the first two types of amor-
phization reactions. As Figure 7 illustrates, type I amor-
phization reaction (i.e., through a solid solution) occurs at
Ni- or Ta-rich compositions (Ni
10
Ta
90
; Ni
30
Ta
70
; and
Ni
70
Ta
30
; Ni
90
Ta
10
), where only a slight amount or no
amorphous phase appeared after 5 hours of MA processing.
However, for the composition range between Ni
40
Ta
60
and
Ni
60
Ta
40
, most Ni diffraction peaks disappeared, and a
broad diffraction peak, indicating the formation of amor-
phous alloy, was superimposed on the Ta (110) diffraction
METALLURGICAL AND MATERIALS TRANSACTIONS A VOLUME 28A, JULY 1997—1433
Fig. 6—X-ray diffraction patterns of Ni
50
Ta
50
powders as milled for 20 h
and annealed at 1000 and 1100 K for 10 min.
Fig. 7—X-ray diffraction patterns of Ni
x
Ta
1002x
powders after 5 h of
milling.
Fig. 8—X-ray diffraction patterns of amorphous Ni
x
Ta
1002x
powders.
peak at around 2
u
5 18 to 20 deg (Figure 7). This obser-
vation suggests that the 5 hour ball-milled powders were
mixtures of Ta deg solid solution and amorphous phases.
Such an amorphization reaction can be referred to as type
II.
As reported earlier, binary amorphous alloys form by
MA easier for compositions with a large negative heat of
mixing (H
m
).
[10]
The values of H
m
, as calculated by the Mie-
dema model,
[17]
indicate H
m
to be large between Ta-40 to
60 at. pct Ni and small at both Ni- and Ta-rich sides. Such
a discrepancy implies that the amorphization rate should be
higher in the middle compositions than at the Ni- or Ta-
rich compositions, possibly accounting for why type I is
preferred at the Ni- or Ta-rich compositions and type II
occurs in the middle composition ranges.
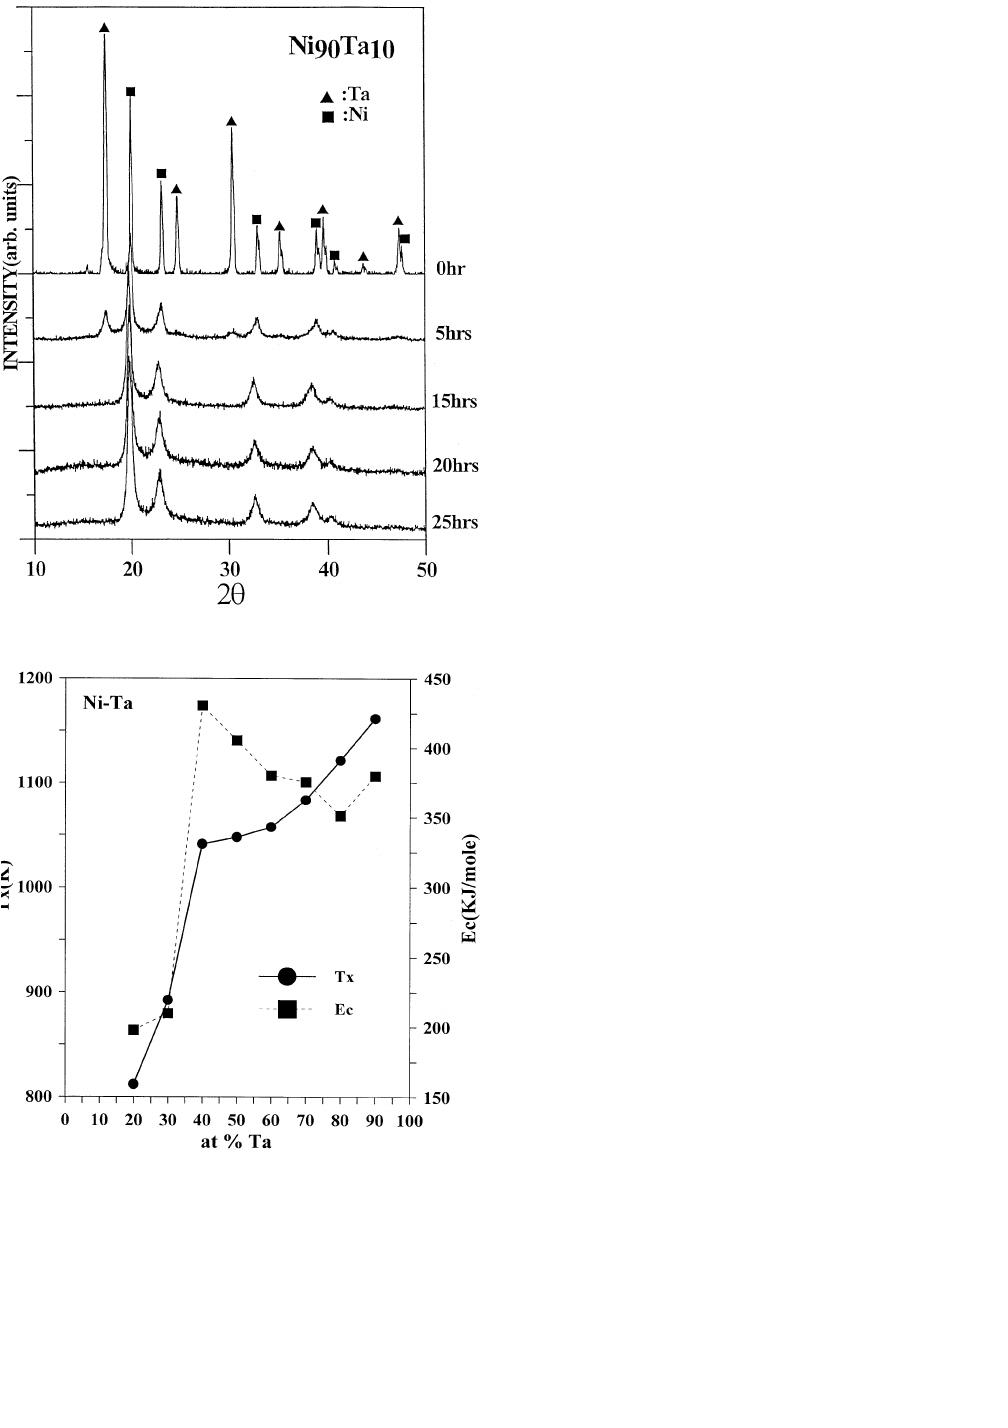
2. Glass formation and extended solid solution
Further milling causes amorphous alloys to form over a
wide composition range, i.e.,Ni
10
Ta
90
to Ni
80
Ta
20
. Figure 8
presents the corresponding X-ray diffraction patterns. Ac-
cording to this figure, this range is larger than for amor-
phous alloys produced by the rapid-quenching technique
(40 to 70 at. pct Ni by Giessen et al.,
[18]
35 to 65 at. pct
Ni by Rohr et al.,
[19]
and 50 to 70 at. pct Ni by Prokoshina
and Belousov
[20]
) or by the electron-gun-deposition tech-
nique (20 to 55 at. pct Ni by Schafer and Menzel
[21]
). To
our knowledge, amorphous Ni-Ta alloys have never formed
at compositions between 10 and 30 at. pct Ni, using the
rapid-quenching technique. The absence of a eutectic point
and a high liquidus temperature in this composition range
[22]
are presumably responsible for the inability of an amor-
phous phase to form by rapid solidification.
The Ni
90
Ta
10
powder, however, forms an fcc nickel-rich
solid solution and no significant difference arises after 25
hours of milling (Figure 9). According to the phase dia-
gram, the solubility at 800 7Cis;3 at. pct Ta,
[22]
although
the maximum solubility of nickel solid solution was found
to be 17.2 at. pct Ta at 1360 7C.
[23]
The lattice parameter
increases from 0.352 to 0.358 nm, which follows Vegard’s
law;
[24]
i.e., there is a linear relationship between the solu-
bility and expanded lattice parameters. An extended solid
solution can be prepared by MA, as reported in several
binary systems, such as Ni-Nb
[25]
and Cu-Ti.
[26]
3. Thermal stability of amorphous Ni-Ta alloys
Finally, the thermal stability of the Ni-Ta amorphous
powders was examined and the crystallization temperatures
were defined from the first peak’s position in the DTA
1434—VOLUME 28A, JULY 1997 METALLURGICAL AND MATERIALS TRANSACTIONS A
Fig. 9—X-ray diffraction patterns of Ni
90
Ta
10
powders vs milling time.
Fig. 10—The crystallization temperatures and activation energies of
amorphous Ni
x
Ta
1002x
powders.
scans of amorphous powders after 20 hours of milling. Fig-
ure 10 exhibits the crystallization temperature T
x
, corre-
sponding to a scanning rate of 40 K min
21
vs composition,
where T
x
generally increases with increasing Ta content.
Prokoshina and Belousov
[20]
noted a similar crystallization
temperature-composition dependence at compositions be-
tween 30 to 50 at. pct Ta for melt-spun samples, but with
lower crystallization temperatures. For most amorphous
metallic alloys, T
x
ranges between 0.4 and 0.6 of the melt-
ing temperature,
[27]
which suggests that the alloy composi-
tions with a high liquidus temperature are favorable for a
high T
x
. Examination of a Ni-Ta phase diagram reveals a
general monotonic increase in liquidus temperature for
large Ta compositions. Rohr et al.
[19]
measured T
x
of their
splat-quenched Ni
1002x
Ta
x
(x 5 35 to 60) amorphous sam-
ples by measuring resistivity. The T
x
values exceeded 950
K. Figure 10 reveals that T
x
lies between 1050 and 1150 K
at compositions between 40 and 90 at. pct Ta, in agreement
with Rohr’s results.
In addition, Figure 10 depicts the activation energy (E
c
)
of the Ni-Ta amorphous powders as a function of compo-
sition, where a maximum appears at Ni-40 at. pct Ta. In-
vestigations addressing the thermal stability of TM-Ni (TM:
Fe, Hf, Ti, or Zr) have indicated that a high value in
activation energy is associated with a eutectic composi-
tion.
[28,29,30]
Our results support this argument, since the eu-
tectic composition in the Ni-Ta system is Ni-36 at. pct Ta.
IV. SUMMARY
1. Complete amorphization is feasible for the composition
range between Ni
10
Ta
90
and Ni
80
Ta
20
. This range is larger
than for amorphous alloys prepared by the splat-cooling
process or by the electron-gun-deposition technique.
2. A supersaturated nickel solid solution formed for Ni-rich
compositions, such as Ni
90
Ta
10
.
3. Two different types of amorphization reactions were
identified: through an intermediate solid solution and by
direct formation of amorphous phase.
4. The crystallization temperatures of amorphous Ni-Ta
powders were proportional to the Ta content.
5. The activation energy of amorphous Ni-Ta powders ex-
hibited a maximum near the eutectic composition.
6. The amorphization rate at the early stage of MA is faster
for intermediate compositions and slower at both Ni-
and Ta-rich compositions.
ACKNOWLEDGMENT
The authors would like to thank the National Science
Council of the Republic of China for financially supporting
this work under Grant No. NSC 83-0405-E-019-002.
REFERENCES
1. S. Davis, M. Fischer, B.C. Giessen, and D.E. Polk: in Rapidly
Quenched Metals III, B. Cantor, ed., The Metal Society, London,
1978, vol. 2, pp. 425-30.
2. D. Turnbull: Metall. Trans. B, 1981, vol. 12B, pp. 217-30.
3. X.L. Yeh, K. Samwer, and W.L. Johnson: Appl. Phys. Lett., 1983,
vol. 42, pp. 242-44.
4. R.B. Schwarz and W.L. Johnson: Phys. Rev. Lett., 1983, vol. 51, pp.
415-18.
5. W.L. Johnson: Progr. Mater. Sci., 1986, vol. 30, pp. 81-134.
6. L. Schultz and J. Eckert: in Topics in Applied Physics, vol. 72, Glassy
Metals III H. Beck and H.-J. Gu¨therodt, eds., Springer-Verlag, New
York, NY, 1994, pp. 69-120.
7. J.S. Benjamin: Metall. Trans., 1970, vol. 1, pp. 2943-51.
8. J.S. Benjamin: Sci. Am., 1976, vol. 234, pp. 40-48.

METALLURGICAL AND MATERIALS TRANSACTIONS A VOLUME 28A, JULY 1997—1435
9. C.C. Koch: Mater. Sci. Technol., vol. 15, Processing of Metals and
Alloys, R.W. Cahn, ed., VCH, Weinheim, 1991, pp. 193-246.
10. A.W. Weeber and H. Bakker: Phys. B, 1988, vol. 153, pp. 93-135.
11. C.C. Koch, O.B. Cavin, C.G. McKamey, and J.O. Scarbrough: Appl.
Phys. Lett., 1983, vol. 43, pp. 1017-19.
12. J.S. Benjamin and T.E. Volin: Metall. Trans., 1974, vol. 5, pp. 1929-
34.
13. D. Maurice and T.H. Courtney: Metall. Mater. Trans. A, 1995, vol.
26A, pp. 2437-44.
14. J.C. Barbour, F.W. Saris, M. Nastasi, and J.W. Mayer: Phys. Rev. B,
1985, vol. 32, pp. 1363-65.
15. El-Eskandarany, K. Aoki, and K. Suzuki: J. Appl. Phys., 1992, vol.
72 (7), pp. 2665-72.
16. El-Eskandarany, K. Aoki, and K. Suzuki: Metall. Trans. A, 1992, vol.
23A, pp. 2131-40.
17. A.R. Miedema, P.F. Dechatel, and F.R. de Boer: Phys. B, 1980, vol.
100, pp. 1-28.
18. B.C. Giessen, M. Madhava, and D.E. Polk: Mater. Sci. Eng., 1976,
vol. 23, pp. 145-150.
19. L. Rohr, P. Reimann, P.T. Richmond, and H.-J. Guntherodt: Mater.
Sci. Eng., 1991, vol. A133, pp. 715-17.
20. G.F. Prokoshina and O.K. Belousov: Russ. Metall. Met., 1991, No. 6,
pp. 170-72.
21. A. Schafer and G. Menzel: Thin Solid Films, 1978, vol. 52, pp. 11-
21.
22. A. Nash and P. Nash: Bull. Alloy Phase Diagram, 1984, vol. 5 (3),
pp. 259-65.
23. R.C. Ruhl, B.C. Giessen, M. Cohen, and N.J. Grant: J. Less-Common
Met., 1967, vol. 13, pp. 611-18.
24. B.D. Cullity: Elements of X-ray Diffraction, Addison-Wesley
Publishing Co., Inc., Reading, MA, 2nd ed., p. 350.
25. P.Y. Lee and C.C. Koch: J. Non-Cryst. Solids, 1987, vol. 94, pp.
88-100.
26. C. Politis and W.L. Johnson: J. Appl. Phys., 1986, vol. 60, pp.
1147-51.
27. A. Calka, M. Madhava, D.E. Polk, B.C. Giessen, and J. Vandersande:
Scripta Metall., 1977, vol. 11, pp. 65-70.
28. Z. Altounian, G.-H. Tu, and J.O. Strom-Olsen: J. Appl. Phys., 1983,
vol. 54, pp. 3111-16.
29. Z. Altounian, C.A. Volkertand, and J.O. Strom-Olsen: J. Appl. Phys.,
1985, vol. 57, pp. 1777-82.
30. K.H. Buschow: J. Phys. F, 1984, vol. 14, pp. 593-607.
