Effects of Pressure on the Vibrational, Structural and Electronic Properties of C
60
Powder
and Thin Films
S. C. Sharma
*
, B. Ha, J. H. Rhee, Y. Li, D. Singh, and R. Govinthasamy
Department of Physics and Materials Science & Engineering Program
The University of Texas at Arlington, Arlington, TX 76019, USA
*
Author to whom correspondence should be addressed
ABSTRACT
We present results from a study of the vibrational, structural, and electronic properties of C
60
powder and thin films. Raman spectroscopy and diamond anvil cell have been used to study
pressure dependence of the Raman active modes of C
60
powder. The material undergoes
structural phase transition between 9 and 15 GPa. Some of the Raman modes soften, while
others harden with increasing pressure. Thin films of C
60
and La-doped C
60
have also been
studied by using Raman scattering, x-ray diffraction, x-ray photoelectron spectroscopy and uv
photoemission spectroscopy. Whereas the powder and La-doped C
60
films exhibit fcc crystalline
structure, the C
60
film appears disordered. Further, we observe a significant difference in the
electronic valence bands of the doped and undoped films.
INTRODUCTION
The vibrational, structural and electronic properties of C
60
are the subject of an increasing
level of interest [1, 2]. The C
60
molecule consists of a total of 60 equivalently bonded carbon
atoms making a soccer-ball cage structure. Each carbon atom in this cage structure is bonded
with three other carbon atoms through three bonds and one bond; with intercarbon distances of
0.145 nm and 0.140 nm for single and double bonds, respectively. In crystalline C
60
, the
molecules are bound by weak van der Waals forces in a closed packed face-centered-cubic (fcc)
lattice with a lattice constant of 0.142 nm. The material undergoes a structural phase transition,
from fcc to simple cubic structure, at T
c
= 260 K. Above T
c
, the molecules rotate around their
lattice positions, whereas this motion is restricted below T
c
; being frozen at 90 K. It has been
reported that C
60
can be polymerized above T
c
by optical excitations as well as by the
application of high pressure and high temperature [3, 4]. In the polymer phase, the adjacent
molecules are covalently bonded by a four-membered ring joining two molecular cages. A
photochemical [2 + 2] cycloaddition reaction has been proposed for the photoinduced
dimerization in crystalline C
60
. Details of the photo-induced formation of the intermolecular
covalent bonds, however, still remain the subject of discussion. Excellent reviews on the C
60
based materials and high-pressure techniques are available in the literature [1, 2, 5, 6]. Here we
present results from a series of experiments designed to further study the vibrational, structural,
and electronic properties of C
60
powder and thin films by using Raman scattering, x-ray
diffraction (XRD), x-ray photoelectron spectroscopy (XPS), and uv photoemission spectroscopy
(PES).
Mat. Res. Soc. Symp. Proc. Vol. 695 © 2002 Materials Research Society
L3.10.1
EXPERIMENTAL
C
60
powder of 99.9% purity and containing 1-10
µ
m particles was obtained from MER
[7]. Thin films were deposited by laser ablation under high vacuum (10
-8
Torr). Our Raman
Spectrometer consists of a 1.25 m, f/11 monochromator, 2400 g/mm, ion-etched blazed
holographic diffraction grating, 2048x512 pixel back illuminated liquid nitrogen cooled CCD
camera, Super-Notch-Plus filter, argon-ion laser operating at 514.5 nm, and SpectraMax for
Windows software. The powder sample was subjected to high pressures by using diamond anvil
cell. Applied pressures were calculated by measuring pressure-induced shifts in the Ruby
luminescence peaks [8]. XRD measurements were made by using Siemens D-500 powder
diffractometer and Siemens thin film spectrometer with Huber 651/652 Goniometer, and Cu x-
rays of wavelength = 0.154 nm. The electronic valence bands were measured by using uv
photoemission spectroscopy. This spectrometer consists of a multiport UHV spherical chamber
(10
-10
Torr), h
ν
= 21.2 eV He-I uv radiation source, double-pass cylindrical mirror electron
energy analyzer, x-y-z sample manipulator, and 3 kV argon-ion sputtering gun. A Physical
Electronics model 5100 XPS system was used to determine stoichiometry of the doped sample.
RESULTS AND DISCUSSION
The Raman scattering data for the A
g
(2) mode of C
60
powder and thin films under
ambient conditions as well as for several different modes of C
60
powder compressed under
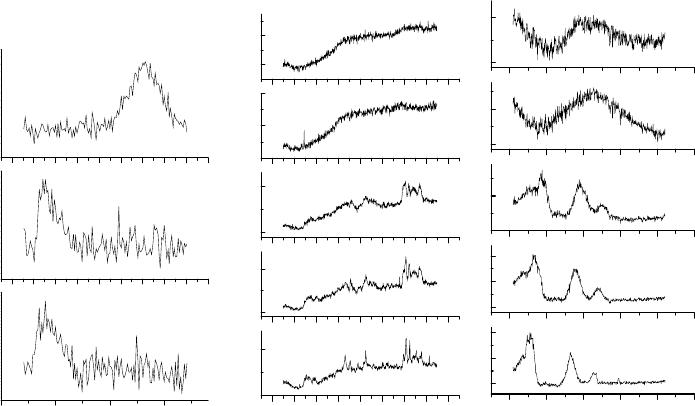
different pressures are shown in Fig. 1.
1455146014651470
La doped C
60
thin film
Wavenumber (cm
-1
)
C
60
thin film
C
60
Powder
100 200 300 400 500 600 700 800 900
0.55 GPa
Wavenumber (cm
-1
)
5.5 GPa
9.1 GPa
3.4 GPa
14.7 GPa
1400 1500 1600 1700 1800 1900
0.55 GPa
Wavenumber (cm
-1
)
5.5 GPa
9.1 GPa
14.7 GPa
3.4 GPa
Fig. 1. Raman scattering data for the A
g
(2) mode of C
60
powder and C
60
thin films under
ambient conditions, and for C
60
powder compressed under different pressures.
We observe a relatively large shift (
≈ 9 cm
-1
) in the A
g
(2) mode of thin films compared to
the value of this mode in the powder under ambient conditions. However, no significant shift is
observed in the A
g
(2) mode of the doped and undoped thin films. Possible reasons for these
L3.10.2
effects are under investigation. The pressure-dependent data in C
60
powder are in overall
agreement with previously published results [1, 9]. The Raman bands with frequencies ≥ 1300
cm
-1
harden with increasing pressure. The pressure dependence of the lower frequency modes
(≤ 1300 cm
-1
), however, is not so straightforward. The 775 cm
-1
mode hardens, 711 cm
-1
mode
softens, and 502 and 432 cm
-1
modes do not seem to change with pressure. The 273 cm
-1
mode
first hardens up to about 9 GPa and then softens at higher pressures. The C
60
powder is known
to undergo structural phase transition at high pressures (10 GPa), whereby the fcc phase material
that exists under ambient conditions, transforms into a disordered phase [10, 11]. A structural
phase transformation is indicated by our Raman data measured at 14.7 GPa followed by the
measurements at 3.4 GPa. The Raman bands in the 14.7 GPa data are much broader than those
observed in the lower pressure data measured during increasing pressure cycle of the experiment.
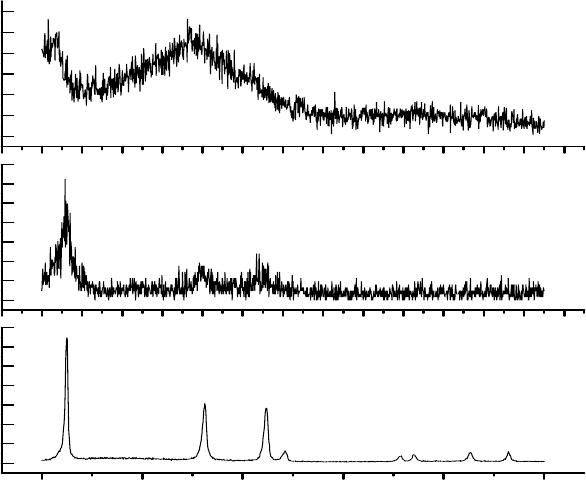
XRD data for C
60
powder and thin films of C
60
and La-doped C
60
are shown in Fig. 2. In
the case of the powder sample, the major peaks arise due to x-ray diffraction from the (111),
220), and (311) planes. (These peaks are relatively narrow; FWHM’s ranging from about 0.14 to
0.27 degrees). These peaks fit well with a fcc structure. The C
60
thin film shows an unusually
broad peak, FWHM ≈ 4 degrees at 2
θ
= 17.5 and the sample appears to be amorphous. In the
case of the La-doped C
60
thin film, we observe diffraction peaks from (111), (220), (311). These
three major peaks clearly show that the crystallographic quality of the film is much better than
that of the undoped C
60
thin film.
10 15 20 25 30 35
C
60
Powder Sam ple
2 θ
La-doped C
60
T h in F ilm
Undoped C
60
T h in F ilm
Fig. 2. XRD scans for the C
60
powder and thin films of C
60
and La-doped C
60
.
L3.10.3
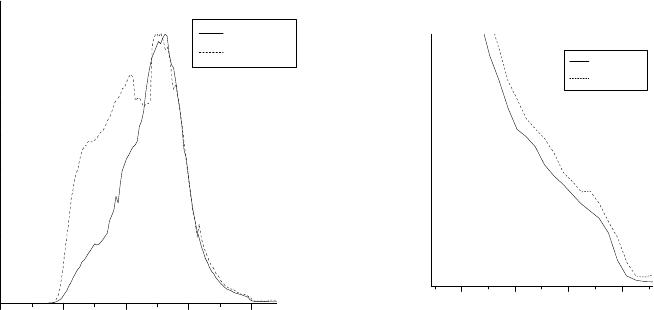
The PES data for C
60
and La-doped C
60
thin films are shown in Fig. 3. There is a significant
difference between the valence band structures of the undoped and La-doped C
60
thin films. In
the case of the La-doped C
60
thin film, we observe significantly higher DOS at the Fermi energy.
The calculations of the electronic density of states for isolated C
60
, C
60
in fcc lattice, and K
x
C
60
have shown that the K atoms transfer their 4s charge to the fullerene orbitals and the Fermi level
of the fullerides moves through the LUMO band with increased doping [12]. It is also known that
the effects like, the orientational disorder of the fullerenes and two-phase structure of the doped
samples, introduce additional features in the experimental data. The photoemission and inverse
photoemission data on K
x
C
60
have shown that doping of the fullerides at x = 1 broadens the
spectra substantially and shifts the Fermi level into the LUMO band [13]. The density of the states
(DOS) at the Fermi energy increases as the amount of the metallic phase increases until the
insulating x = 4 phase begins to form in the fullerides.
Fig 3. The valence bands of the thin films of C
60
and La-doped C
60
.
At a doping level, x = 6, the fullerides are saturated. When the LUMO band is filled, E
F
falls
in the gap between the now-occupied LUMO band and the empty LUMO+1 band. In this
configuration, the material is a filled-band insulator. In the light of the above known results, a
higher DOS near E
F
in the doped sample shows that the doping level is relatively low and the
film is an insulator. The XPS measurements on the La-doped thin film show C-1s, La-3d
3/2
and
La-3d
5/2
peaks at binding energies of about 285, 857, and 837 eV, respectively. Further, these
XPS measurements provide a value for the atomic concentration of La in the film. From these
measurements, the stoichiometry of the doped thin film turns out to be represented by La
0.1
C
60
.
Therefore, our observation of a higher density of states in the doped thin film compared to the
DOS in the C
60
thin film is in agreement with the above discussion. Details on the electronic
valence bands as functions of the doping level will be published elsewhere.
20 15 10 5 0
Counts (arb. units)
Binding Energy (eV)
C
60
film
La doped C
60
3210
Counts (arb. units)
Binding Energy (eV)
C
60
film
La doped C
60
L3.10.4
CONCLUSIONS
The Raman scattering data on C
60
powder, compressed in a diamond anvil cell,
indicate that the sample undergoes structural phase transition, from fcc to disordered, between 9
and 15 GPa. The high frequency Raman modes (≥ 1300 cm
-1
) harden with increasing pressure.
The behavior of the lower frequency Raman modes, however, is not straightforward. While some
of these modes soften, others remain unaffected under pressure applied in these experiments. In
the case of the thin film samples, the A
g
(2) mode shifts by almost 9 cm
-1
compared to its value
for the C
60
powder. XRD measurements show that the La-doped thin film is crystalline with fcc
structure and the C
60
thin film is amorphous. The electronic valance bands of these samples are
significantly different in that, in the case of the doped sample, we observe a higher density of the
electronic states at the Fermi energy.
ACKNOWLEDGMENTS
We thank Dr.’s R. Hemley and A. F. Goncharov for invaluable help. Research supported,
in part, by grants from the Department of Energy, grant No. DE-FG03-00ER45840/A000 and the
Welch Foundation, Houston, Texas.
REFERENCES
1. M. S. Dresselhaus, G. Dresselhaus, and P. C. Eklund, “Science of Fullerenes and Carbon
Nanotubes”, Academic Press, 1996, and references therein.
2. Solid State Physics, vol. 48, editors, H. Ehrenreich and F. Spaepen, Academic Press, 1994.
3. A. M. Rao, P. Zhou, K. Wang, G. T. Hager, J. M. Holden, Y. Wang, W. T. Lee, X. X. Bi, P.
C. Eklund, D. S. Cornett, M. A. Duncan, and I. J. Amster, Science, 259 (1993) 955.
4. Y. Iwasa, T. Arima, R. M. Fleming, T. Siegrist, O. Zhou, R. C. Haddon, L. J. Rothberg, K. B.
Lyons, H. L. Carter, Jr., A. F. Hebard, R. Tycko, G. Dabbagh, J. J. Krajewski, G. A. Thomas,
and T. Yagi, Science 264 (1994) 1570.
5. A. Jayaraman, Rev. Mod. Phys. 55 (1983) 65.
6. R. J. Hemley and N. W. Ashcroft, Physics Today (August 1998) 26.
7. MER Corporation, Tucson, Arizona.
8. H. K. Mao, P. M. Bell, J. W. Shaner, and D. J. Steinberg, J. Appl. Phys. 49 (1978) 3276.
9. D. W. Snoke, Y. S. Raptis, and K. Syassen, Phys. Rev. B 45 (1992)14419.
10. M. N. Regueiro, Mod. Phys. Lett. 6 (1992) 1153.
11. M. N. Regueiro, L. Marques, J. L. Hodeau, O. Bethoux, and M. Perroux, Phys. Rev. Lett. 74
(1995) 278.
12. S. C. Erwin in “Buckminsterfullerenes”, edited by W. E. Billups and M. A. Ciufolini, VCH
Publishers, N. Y., 1993, p. 217
13. P. J. Benning, D. M. Poirier, T. R. Ohno, Y. Chen, M. B. Jost, F. Stepniak, G. H. Kroll, J. H.
Weaver, J. Fure, and R. E. Smalley, Phys. Rev. B 45 (1992) 6899.
L3.10.5
