
ORIGINAL ARTICLE
Emotion Regulation in Depression and Anxiety: Examining
Diagnostic Specificity and Stability of Strategy Use
Catherine D’Avanzato
•
Jutta Joormann
•
Matthias Siemer
•
Ian H. Gotlib
Published online: 4 April 2013
Ó Springer Science+Business Media New York 2013
Abstract Many psychological disorders are characterized
by difficulties in emotion regulation. It is unclear, however,
whether different disorders are associated with the use of
specific emotion regulation strategies, and whether these
difficulties are stable characteristics that are evident even
after recovery. It is also unclear whether the use of specific
strategies is problematic across all disorders or whether
disorders differ in how strongly strategy use is associated
with symptom severity. This study investigated (1) the
specificity of use of emotion regulation strategies in indi-
viduals diagnosed with current major depressive disorder
(MDD), with social anxiety disorder (SAD), and in never-
disordered controls (CTL); and (2) the stability of strategy
use in formerly depressed participants (i.e., remitted;
RMD). Path analysis was conducted to examine the rela-
tion between strategy use and symptom severity across
diagnostic groups. Compared to the CTL group, partici-
pants in both clinical groups endorsed more frequent use of
rumination and expressive suppression, and less frequent
use of reappraisal. Specific to SAD were even higher levels
of expressive suppression relative to MDD, as well as a
stronger relation between rumination and anxiety levels. In
contrast, specific to MDD were even higher levels of
rumination and lower levels of reappraisal. Interestingly,
elevated rumination, but not decreased reappraisal, was
found to be a stable feature characterizing remitted
depressed individuals. These results may provide insight
into ways in which emotion regulation strategy use main-
tains psychological disorders.
Keywords Depression Social anxiety Emotion
regulation Rumination Suppression Reappraisal
Introduction
Difficulties in emotion regulation are proposed to be
associated with a range of emotional disorders such as
anxiety disorders and major depressive disorder (MDD)
(Campbell-Sills and Barlow 2007; Hofmann et al. 2012;
Mennin and Farach 2007). Emotion regulation is defined as
the use of cognitive or behavioral strategies in order to
modify the circumstances in which an emotion occurs, the
experience of an emotional response (including its intensity
and duration), or the way in which an emotion is overtly
expressed (Gross 2002). Previous research suggests that
emotion regulation strategies differ in their effectiveness in
reducing negative affect (e.g. Gross 1998; Campbell-Sills
et al. 2006b); consequently, these strategies may also differ
in their association with emotional disorders. Few studies,
however, have examined individual differences in the use
of specific emotion regulation strategies across carefully
diagnosed psychological disorders. This study examined
whether participants diagnosed with depression and social
anxiety disorder differ in the frequency of their use of
emotion regulation strategies. In addition, we examined
group differences in the association of the use of these
strategies with the severity of depression and anxiety
symptoms.
A strategy that has been linked to negative outcomes for
individuals’ mood and functioning is rumination, or the
tendency to think repetitively about one’s negative mood
C. D’Avanzato (&) J. Joormann M. Siemer
Department of Psychology, University of Miami, 5665 Ponce de
Leon Blvd, Coral Gables, FL 33124, USA
e-mail: [email protected]
I. H. Gotlib
Department of Psychology, Stanford University, Palo Alto, CA,
USA
123
Cogn Ther Res (2013) 37:968–980
DOI 10.1007/s10608-013-9537-0

state and its causes and consequences (Nolen-Hoeksema
1991). Rumination can lead to increases in negative mood
(see review by Nolen-Hoeksema et al. 2008) and is asso-
ciated with the activation of negative cognitions in memory
(Watkins and Teasdale 2001; Lyubomirsky and Nolen-
Hoeksema 1995). Rumination also impairs problem solv-
ing and interpersonal functioning (Lyubomirsky et al.
1999; Nolen-Hoeksema and Davis 1999). Expressive sup-
pression is frequently discussed as another maladaptive
emotion regulation strategy (Gross 1998). Expressive
suppression involves attempting to control emotional
responses by avoiding expressing them outwardly. This
strategy has been shown to be less effective in relieving
negative emotions and to be associated with increased
physiological arousal (Gross 1998; Campbell-Sills et al.
2006a, b; Hofmann et al. 2009). In addition, suppression is
cognitively taxing, resulting in impaired memory and
cognitive functioning (Richards and Gross 2000; Egloff
et al. 2006). In contrast, reappraisal is widely regarded as
an adaptive emotion regulation strategy, defined as think-
ing about a stressful event from a different perspective in a
way that minimizes its negative impact (Gross 1998; Gross
and John 2003). Reappraisal effectively reduces negative
affect and is not associated with the increased or sustained
physiological reactivity observed when individuals use
suppression (Augustine and Hemenover 2009; Denson
et al. 2012; Gross 1998; Gross and John 2003; Shiota and
Levenson 2012). Reappraisal has been demonstrated to be
less cognitively taxing than is suppression (Egloff et al.
2006; Richards and Gross 2000) and to be related to better
physiological stress recovery (Jamieson et al. 2012; Mauss
et al. 2007).
Given the differential effectiveness of these various
emotion regulation strategies, it is possible that habitual
use of specific strategies plays an important role in the
onset and maintenance of clinical depression and other
emotional disorders (Hofmann et al. 2012). Numerous
studies have in fact demonstrated an association between
rumination and depression (Nolen-Hoeksema et al. 2008).
Specifically, rumination is correlated with a greater number
of recurrences of depressive episodes over time, and in some
studies longer duration of depressive episodes (Nolen-
Hoeksema 1991; Roberts et al. 1998). Moreover, longitu-
dinal studies have indicated that rumination can predict
increased risk for developing depression in response to
stressful events (Moberly and Watkins 2008). Beyond the
well-established association between rumination and
depression, more frequent use of expressive suppression
and less frequent use of reappraisal have been found in
individuals with elevated symptoms of depression (e.g.
Moore et al. 2008; Nezlek and Kuppens 2008). In addition,
a recent meta-analysis found elevated depression scores to
be associated not only with greater use of rumination, but
also with greater suppression and, although to a lesser
extent than the maladaptive strategies, less reappraisal
(Aldao et al. 2010).
To date, studies that simultaneously examine more than
one disorder and more than one type of emotion regulation
strategy are rare, particularly studies utilizing diagnosed
samples (Aldao et al. 2010). Thus, it is unclear whether the
habitual use of certain strategies, such as rumination and
expressive suppression, is specific to depression or is a
general feature of psychopathology. The lack of studies
examining more than one emotion regulation strategy and
more than one diagnostic category also makes it difficult to
examine whether the use of specific emotion regulation
strategies is generally adaptive or maladaptive, or in con-
trast whether the consequences of using a particular strat-
egy are moderated by characteristics of individuals and
situations in which the strategies are deployed. For exam-
ple, it is possible that rumination increases negative affect
and cognition in general and, therefore, is associated with
the severity of symptoms of anxiety and depression not
only in depressed, but also in non-disordered participants.
Alternatively, for non-depressed individuals, rumination
may resemble reflection and problem-solving and, there-
fore, may not be strongly associated with symptoms of
depression and anxiety. Indeed, recent studies have shown
that strategies generally thought to be ‘‘maladaptive’’ are
associated with positive outcomes when used by individ-
uals with particular characteristics or in particular situa-
tions. For example, Liverant et al. (2008) reported that
expressive suppression was effective in reducing sadness
for individuals with low, but not with moderate to high,
levels of anxiety. Likewise, recent evidence suggests that
individuals’ variability in strategies used across a range of
situations, or their emotion regulation flexibility, may be
important to consider, with individuals drawing from
multiple strategies across different situations shown to
exhibit lower symptom levels (Aldao and Nolen-Hoeksema
2012b). To answer these questions, however, it is necessary
to examine multiple strategies and disorders simulta-
neously in order to understand how patterns of use across
these strategies relate to various forms of psychopathology,
a question which has not generally been addressed to date.
One exception is a study conducted by Aldao and Nolen-
Hoeksema (2010) which examined the relation between
rumination, thought suppression and reappraisal with
symptoms of depression, anxiety and disordered eating.
The authors found that all three emotion regulation strat-
egies loaded significantly onto one latent factor of cogni-
tive emotion regulation and that the cognitive emotion
regulation factor was significantly associated with symp-
toms of all three disorders. However, this study was limited
by use of an undiagnosed college sample, results of which
do not necessarily generalize to clinical populations.
Cogn Ther Res (2013) 37:968–980 969
123

It is also possible that clinical groups find it difficult to
implement adaptive strategies such as reappraisal effec-
tively and, thus, may exhibit a weaker relation between
reappraisal use and symptom severity. In their meta-anal-
ysis, Aldao et al. (2010) found that reappraisal was more
weakly associated with symptoms of various types of
psychopathology including depression and anxiety; this
finding has been replicated in several recent studies (Aldao
and Nolen-Hoeksema 2010; Aldao and Nolen-Hoeksema
2012a), and one interpretation that has been put forth is that
this may reflect difficulties with effective reappraisal or
interference related to elevated use of rumination and
suppression among individuals with psychopathology
(McRae et al. 2012). Consistent with this idea, Sheppes
et al. (2011) have found evidence that reappraisal may
become more taxing and less helpful when individuals are
regulating intense emotion, as is typically the case in the
context of emotional disorders. Differences between
depressed and non-depressed individuals in neural corre-
lates of reappraisal have also been documented and are
associated with less effective down-regulation of negative
affect (Johnstone et al. 2007; Siegle et al. 2007). Similarly,
one recent study demonstrated that, among college students
who had recently experienced a stressor, higher levels of
depressive symptoms were associated with reduced effec-
tiveness of reappraisal in a laboratory film task (Troy et al.
2010). McRae et al. (2012) found that individuals higher in
well-being exhibited more effective reappraisal in response
to a laboratory task, and reappraisal effectiveness on this
task interestingly was associated with more frequent
habitual reappraisal use. However, results are mixed and
some studies have found that reappraisal is equally effec-
tive in reducing subjective distress among individuals with
psychopathology as healthy controls (Aldao and Mennin
2012; Campbell-Sills et al. 2011). Studies that examine
differences in the strength of relations between particular
emotion regulation strategies and symptom severity across
different diagnostic groups are therefore critical because
they may illuminate potential diagnostic group differences
in the role of these strategies in the development and
maintenance of these disorders.
Recent studies have shown that difficulties with emotion
regulation also play a central role in anxiety disorders. In
the present study we examined individuals with SAD as a
comparison group because it is one of the most prevalent
anxiety disorders which often co-occurs with and precedes
MDD (Beesdo et al. 2007). MDD and SAD are both
marked by significant interpersonal impairment (Murray
and Lopez 1997; Schneier et al. 1994) and decreased
positive affectivity (Brown et al. 1998; Kashdan and Steger
2006). Previous findings suggest that SAD, like MDD, is
characterized by elevated rumination, often occurring in
anticipation of feared social situations (Vassilopoulos
2005), or following feared situations in the form of post-
event processing (Edwards et al. 2003; Abbott and Rapee
2004). Recent studies have also found evidence of diffi-
culties with reappraisal in SAD (Goldin et al. 2009a; b).
More frequent use of expressive suppression, however,
may be particularly prevalent in individuals with SAD and
is held to play a central role in the maintenance of this
disorder (Erwin et al. 2003; Kashdan and Steger 2006;
Turk et al. 2005).
The current study examines the self-reported use of
several emotion regulation strategies (rumination, reap-
praisal, expressive suppression) in individuals diagnosed
with current MDD, with MDD in full remission (RMD),
with social anxiety disorder (SAD), and with healthy
controls with no history of any DSM-IV Axis I disorder
(CTL). The first aim of this study was to examine the
specificity to MDD of the use of each strategy. We pre-
dicted greater use of maladaptive strategies (rumination,
expressive suppression) and less frequent use of reap-
praisal, an adaptive strategy, in both the MDD and SAD
groups, relative to the CTL group. We predicted further
that rumination would be specific to MDD
1
; that is, MDD
participants would report higher levels of rumination than
would SAD participants. In contrast, given the centrality of
suppression in recent conceptualizations of SAD, we pre-
dicted that we would find higher levels of suppression
among SAD participants relative to MDD participants. As
both MDD and SAD have been associated with reduced
reappraisal use and effectiveness and studies contrasting
these two disorders are lacking, analyses of the specificity
of reappraisal to MDD or SAD were exploratory.
The second aim of this study was to examine the sta-
bility of the use of specific strategies of emotion regulation
with recovery from a depressive episode. We expected to
find that increased use of maladaptive strategies and
decreased use of adaptive strategies are stable character-
istics of individuals at risk for depression and, therefore,
that the RMD participants do not differ from the MDD
participants in their reported frequency of use of these
strategies. Finally, we examined whether the relation
between frequency of strategy use and severity of symp-
toms of depression and anxiety is comparable among the
different groups. In particular, we conducted exploratory
analyses to investigate whether MDD and SAD participants
differ in the magnitude of the relation between the use of
emotion regulation strategies and symptom severity in
order to gain insight into potential unique factors that might
contribute to the maintenance of these disorders.
1
We use the term specificity to refer to relative specificity, indicating
that use of a particular strategy is more elevated in one group than
another, rather than present in one group and absent in another.
970 Cogn Ther Res (2013) 37:968–980
123

Method
Participants
Participants were 551 individuals with a mean age of
36 years who were recruited from the community. Four
groups of participants completed this study: 189 partici-
pants diagnosed with current MDD; 48 participants diag-
nosed with at least one past episode of MDD who were
currently in remission (RMD); 58 individuals diagnosed
with SAD; and 256 CTLs with no history of Axis-I dis-
order. Participants were recruited from the community
through online and newspaper advertisements.
2
Partici-
pants initially completed a brief telephone interview to
determine eligibility. Exclusion criteria included severe
head trauma and learning disabilities, a history of bipolar
disorder, psychotic symptoms, and alcohol and substance
use disorder within the past 6 months. Individuals who met
inclusion criteria were invited to come into the laboratory
to complete a diagnostic interview.
During the first study session, the Structured Clinical
Interview for the Diagnostic and Statistical Manual of
Mental Disorders-Fourth Edition Text Revision (DSM-
IV-TR; American Psychiatric Association 2000) (SCID;
First et al. 1997) was administered by trained interviewers
with extensive diagnostic interview experience. To assess
inter-rater reliability, an independent trained rater who was
blind to group membership evaluated 15 randomly selected
audiotapes of SCID interviews with depressed and social
phobic participants, and with nonpsychiatric controls. In
all 15 cases, diagnoses of depression, social phobia, and
nonpsychiatric control matched the diagnosis made by the
original interviewer, j = 1.00. This indicates excellent
inter-rater reliability, although we should note that the
interviewers used the ‘‘skip out’’ strategy of the SCID, which
may have reduced the opportunities for the independent
raters to disagree with the diagnoses. Participants were
included in the MDD group if they met DSM-IV-TR criteria
for current MDD but not SAD, in the SAD group if they met
DSM-IV-TR criteria for current SAD but not MDD, and in the
RMD group if they met DSM criteria for a past Major
Depressive Episode. In addition, a slightly modified version of
the SCID was used to verify that each participant in the RMD
group had fully recovered from depression, following guide-
lines recommended by the NIMH Collaborative Program on
the Psychobiology of Depression (e.g., Keller et al. 1992): 8
consecutive weeks with no more than 2 symptoms of no more
than a mild degree (i.e., ratings of 1 [no symptoms] or 2
[minimal symptoms, no impairment]). Finally, participants
were included in the CTL group if they did not meet DSM
criteria for any current or past DSM-IV-TR Axis I disorder.
Measures
Emotion Regulation Questionnaire (ERQ; Gross and John
2003)
The ERQ is a 10-item self-report measure of an individual’s
habitual use of expressive suppression and reappraisal to reg-
ulate emotion. This measure is composed of a 4-item expres-
sive suppression subscale and a 6-item reappraisal subscale.
Each item is rated on a 7-point Likert scale (1 = strongly
disagree; 7 = strongly agree). Subscales were summed, with
higher scores indicating greater use of the strategy. The ERQ
has demonstrated high internal consistency (.79 for reappraisal
and .73 for suppression) and test–retest reliability of .69 for
both subscales (Gross and John 2003). The present sample
demonstrated adequate internal consistency for both the reap-
praisal (a = .84) and suppression subscales (a = .68).
Ruminative Responses Scale (RRS; Nolen-Hoeksema and
Morrow 1991; Treynor et al. 2003)
The tendency to respond to negative events or emotions by
ruminating, or repetitively thinking about these events or
the reasons one is upset, was assessed using the 22-item
RRS. Each item is rated on a 4-point Likert scale
(1 = almost never; 4 = almost always). The RRS has
demonstrated adequate test–retest reliability (r = .67) and
internal consistency (a = .90) (Nolen-Hoeksema 2000), as
well as good predictive validity (Nolen-Hoeksema and
Morrow 1991). With regards to the present study sample,
the RRS demonstrated good internal consistency (a = .89).
Beck Depression Inventory, Second Edition (BDI-II; Beck
et al. 1996)
The BDI-II is a 21-item scale that assesses self-reported
severity of depressive symptoms. Each item assesses the
2
The data were collected as the first part of ongoing data collection
in our labs. Participants were assigned to participate in additional
tasks after completion of the diagnostic interview and the question-
naires, including tasks which were part of various sub- studies of
depression and social anxiety. Separate advertisements targeting
individuals currently experiencing (1) depression, (2) social anxiety,
and (3) individuals with no current or past depression or psychiatric
concerns (controls) were posted throughout the community. Individ-
uals in the remitted depressed group were drawn from individuals
responding to the depression ads who did not currently meet MDD
criteria, but met criteria for a past episode. The ads described the
symptoms of each disorder and invited individuals currently experi-
encing these symptoms to contact the lab if interested in taking part in
the study. Throughout the course of enrollment, a greater number of
depression ads were posted, reflecting a greater focus of studies in our
lab on depression. This contributed to different sample sizes across
diagnostic groups. Given the ads were identical with the exception of
the symptoms being described, the nature of the ads should not have
resulted in differential representativeness of the diagnostic groups.
Cogn Ther Res (2013) 37:968–980 971
123

severity of a specific symptom, with ratings ranging from 0
to 3. The BDI-II is a widely used self-report measure of
depression with high internal consistency, ranging from .73
to .92 (Beck et al. 1996).
State-Trait Anxiety Inventory-Trait (STAI-T; Spielberger
et al. 1983)
Self-reported trait anxiety, the general tendency to expe-
rience anxiety in daily life, was assessed using the 20-item
STAI-T. Each item is rated on a 4-point scale (1 = almost
never; 4 = almost always). The STAI-T has shown
excellent internal consistency (a = .90) and test–retest
reliability ranging from .73 to .86 (Spielberger et al. 1983).
Results
Participant Characteristics
Table 1 presents demographic and clinical characteristics
for the four groups of participants. The mean age of par-
ticipants was 35.95 (SD = 11.12), and one-third of the
participants were male. As expected, the four groups dif-
fered significantly in BDI-II scores, F(3,511) = 399.76,
p \ .001, with the MDD group obtaining significantly
higher BDI-II scores than did the CTL, RMD, and SAD
groups. The SAD participants had higher BDI-II scores
than did the RMD participants, who in turn had higher
BDI-II scores than did the CTL participants. The four
diagnostic groups also differed in trait anxiety levels,
assessed by the STAI-T, F(3,435) = 280.04, p \ .001. All
four groups differed significantly from each other on STAI-
T scores in the order MDD, SAD, RMD, and CTL.
Unexpectedly, diagnostic groups differed in mean age;
however, age was not found to be significantly associated
with use of any of the three emotion regulation strategies
we investigated (r’s =-.03–.02, all ps [.05).
Given that we focused only on one anxiety disorder in
the present study, we also examined rates of comorbidity
of other anxiety disorders besides SAD among the MDD
and SAD groups. One quarter (24.5 %) of depressed
participants had at least one or more current comorbid
anxiety disorders. In contrast, 25.9 % of socially anxious
individuals and 8.4 % of participants in the RMD group
met criteria for a comorbid anxiety disorder. MDD, RMD
and SAD groups did not differ significantly in the pres-
ence of comorbid anxiety disorders, V
2
= 7.43, p [ .05,
thus differences between the MDD, RMD and SAD
groups in emotion regulation were not confounded by
differential rates of other comorbid anxiety disorders in
these groups.
Use of Emotion Regulation Strategies
Table 1 presents mean scores on the RRS, ERQ-suppres-
sion, and ERQ-reappraisal measures by diagnostic group.
3
A multivariate analysis of variance (MANOVA) was
conducted to test the hypothesis that the CTL, RMD,
MDD, and SAD groups differ in the frequency with which
they report using each strategy. The MANOVA yielded
significant differences among the groups in the use of these
strategies, Wilks’s K = .48, F(9,978.5) = 38.55, p =
.000, g
2
= .22. Analyses of variance (ANOVAs) were
conducted on each dependent variable as follow-up tests to
the MANOVA. The three ANOVAs all yielded significant
group differences (RRS: F(3,538) = 175.06, p \ .001;
ERQ-suppression: F(3,413) = 7.59, p \ .001; ERQ-reap-
praisal: F(3,410) = 23.56, p \ .001). In follow-up analy-
ses for each emotion regulation strategy, we first contrasted
both clinical groups (MDD and SAD) with the CTL group.
As expected, compared with the CTL participants, partic-
ipants with a disorder (MDD and SAD participants com-
bined), exhibited higher scores on the RRS, t(492) =
17.69, p \ .001, d = 1.75, and the ERQ-suppression scale,
t(366) = 4.54, p \ .001, d = .50, and lower scores on the
ERQ reappraisal scale, t(368) = 6.70, p \ .001, d = .76.
We then conducted planned comparisons to evaluate
whether the use of rumination is specific to MDD and
expressive suppression specific to SAD. Indeed, the MDD
group obtained significantly higher scores on the RRS than
did the SAD group, t(244) = 6.19, p \ .001, d = .88.
Moreover, there was evidence for specificity of expressive
suppression to SAD: SAD participants exhibited signifi-
cantly higher ERQ-suppression scores than did MDD par-
ticipants, t(190) = 3.00, p = .003, d = .45. Finally, MDD
participants had lower levels of ERQ-reappraisal than did
participants diagnosed with SAD, t(188) = 2.02, p = .04,
d = .31.
To test the third hypothesis that greater use of rumination
and expressive suppression, and decreased use of reap-
praisal, is stable following recovery from MDD, planned
comparisons were conducted contrasting MDD, RMD, and
CTL groups in their mean use of each strategy. In partial
support of our hypothesis, the RMD participants obtained
higher scores on the RRS than did CTLs, t(294) = 6.27,
p \ .001, d = 1.01, but had lower RRS scores than did the
3
As data on suppression and reappraisal was not collected until mid-
way into enrollment for the study, this resulted in smaller sample
sizes for analyses of these variables. Individuals missing this data
were included in analyses of diagnostic group differences in
rumination frequency, as well as in the SEM analyses, as missing
data on these emotion regulation variables was missing at random.
972 Cogn Ther Res (2013) 37:968–980
123

MDD participants, t(234) = 7.52, p \ .001, d = 1.16.
4
With respect to expressive suppression, RMD participants
did not differ from either the MDD, t(188) = .17, p = .87,
or CTL, t(223) = 1.41, p = .16, participants. Contrary to
hypotheses, RMD and CTL participants did not differ in
their ERQ-reappraisal scores, t(222) = 1.12, p = .27,
suggesting that less use of reappraisal is not a stable feature
that endures beyond depressive episodes. Indeed, the RMD
participants obtained higher scores on the ERQ-reappraisal
scale than did MDD participants, t(186) = 4.33, p \ .001,
d = .72.
Specificity: Group Differences in Relations Among
Strategy Use and Depression and Anxiety Symptoms
To examine whether the use of specific emotion regulation
strategies is generally adaptive or maladaptive, we further
examined whether the groups differed in their relation
between strategy use and severity of anxiety and depres-
sion symptoms by conducting a path analysis using M plus
Version 4 (Muthe
´
n and Muthe
´
n 2006). Specifically, we
conducted multiple group comparisons to test whether the
degree to which RRS, ERQ-suppression, and ERQ-
reappraisal scores predict BDI and STAI-T scores differs
among groups (see Kline 2005 for a description of this
technique). This approach involved first testing the fit of a
base model, in which mean RRS score, ERQ-suppression
score, and ERQ-reappraisal scores predict BDI and STAI-T
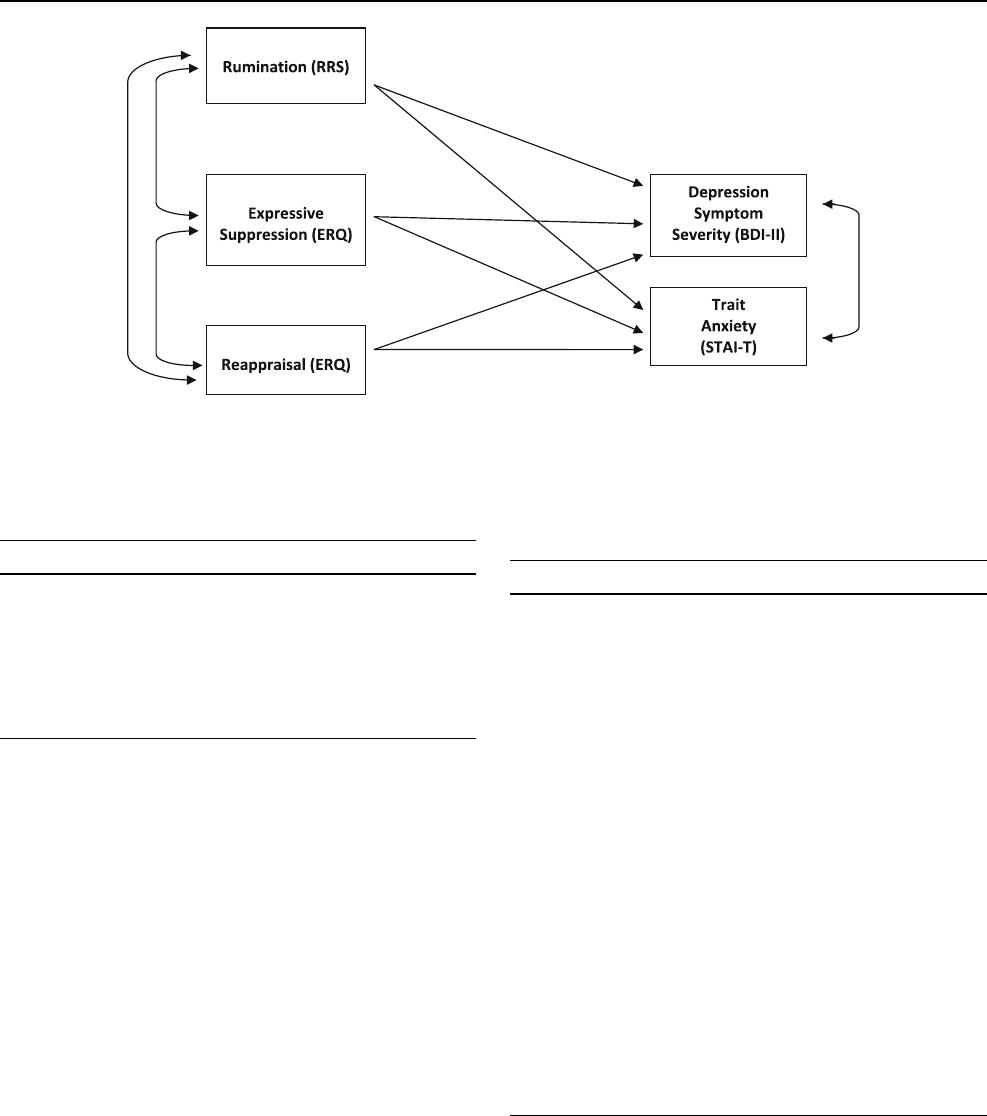
scores (see model displayed in Fig. 1). In the base model,
paths from each strategy (RRS, ERQ-suppression, ERQ-
reappraisal) to BDI and STAI-T, as well as relations among
emotion regulation strategies, were estimated for each
diagnostic group separately. We then compared the base
model to a model in which different diagnostic groups were
constrained to be equal on a given path linking an emotion
regulation strategy with BDI/STAI-T scores. We con-
ducted a Chi square test to determine whether constraining
groups to be equal in these paths yielded a significantly
higher model fit value, indicating a poorer fit to the data,
compared to the base model.
The base model included three inter-correlated predic-
tors (RRS score, ERQ-suppression score, ERQ-reappraisal
score), each of which was proposed to predict both BDI-II
and STAI-T scores. This model provided an excellent fit to
the data, v
2
(20, N = 546) = 14.54, p = .80, comparative
fit index = 1.00, root mean square error of approxima-
tion = .00. As expected, higher RRS as well as lower
ERQ-reappraisal scores predicted significantly higher BDI-
II and STAI-T scores for all four diagnostic groups. The
path from ERQ-suppression to BDI-II, and to STAI-T,
however, was not significant for CTLs, MDDs, and SADs;
for RMDs the relation between ERQ-suppression and
STAI-T scores was statistically significant.
Table 2 displays complete results for the best-fitting final
model that was retained for each diagnostic group after
conducting all multi-group comparisons; in these models,
paths on which diagnostic groups did not differ were con-
strained to be equal among groups, while paths on which
groups were found to differ were estimated separately
Table 1 Mean emotion regulation strategy use and demographic characteristics by diagnostic category
CTL (N = 256) RMD (N = 48) MDD (N = 189) SAD (N = 58)
Age 35.10 (11.47)
b
36.40 (8.90)
bc
38.33 (10.73)
c
31.56 (10.87)
a
% Women 65
a
68
a
69
a
67
a
% Caucasian 64
a
77
a
74
a
71
a
RUM 1.54 (.46)
c
2.04 (.51)
b
2.64 (.53)
a
2.17 (.53)
b
SUPPRESS 13.63 (4.39)
c
14.64 (4.78)
bc
14.89 (5.23)
b
17.23 (5.57)
a
REAP 29.85 (6.05)
a
28.79 (6.22)
ab
23.67 (7.51)
c
26.08 (6.95)
b
STAIT 30.50 (6.82)
d
38.86 (11.12)
c
56.98 (10.10)
a
50.70 (10.55)
b
BDI 2.53 (3.88)
d
7.75 (10.66)
c
27.90 (9.07)
a
12.57 (9.51)
b
Diagnostic categories sharing a subscript are not significantly different from one another (p \ .05; e.g. MDD and SAD groups differed in mean
rumination levels, but RMD and SAD groups did not differ from one another). Values in parentheses represent standard deviations
STAIT Spielberger Trait Anxiety Inventory-Trait, BDI Beck Depression Inventory-II, RUM rumination (Ruminative Responses Scale), Suppress
expressive suppression (Emotion Regulation Questionnaire), Reap reappraisal (Emotion Regulation Questionnaire)
4
As some prior studies have found different subcomponents of
rumination to differ in relation to symptoms of psychopathology, we
also examined diagnostic group differences in brooding, a subscale of
the RRS assessing more maladaptive rumination, and reflection, the
RRS subscale assessing a more adaptive form of rumination.
Brooding and reflection were significantly correlated in the present
sample, r = .47, p = .00. The MDD and SAD groups were elevated
on both the brooding and reflection subscales compared to CTLs.
However, the MDD compared to SAD group was elevated only in
brooding, t(244) = 3.47, p = .00, not reflection, t(244) = .1.65,
p = .10. In addition, compared to the CTL group, t(297) = 5.23,
p = .00, only elevated brooding, but not reflection, t(294) = 1.84,
p = .07, was seen in the RMD group. Both brooding and reflection
showed significant positive correlations with BDI and STAI-T levels
for all diagnostic groups, with the exception that only brooding, but
not reflection, was correlated with BDI and STAI-T in the RMD
group.
Cogn Ther Res (2013) 37:968–980 973
123
across those groups. We first examined whether the diag-
nostic groups differ in the degree to which RRS predicts
BDI-II. Elevated RRS scores more strongly predicted ele-
vated BDI-II scores among both MDD and SAD partici-
pants than CTL participants (see Tables 2, 3). There was no
evidence for specificity, however, in that SAD versus MDD
individuals did not differ from one another in the path from
RRS to BDI-II. With regard to the relation between RRS
levels and trait anxiety, however, we did find evidence for
specificity. RRS scores more strongly predicted elevated
STAI-T levels in SAD than in CTL participants. Further,
RRS predicted STAI-T levels more strongly among SAD
than among MDD participants.
ERQ- suppression (expressive suppression) was not a
significant predictor of scores on the BDI-II or STAI-T,
regardless of diagnosis. Therefore, we did not conduct
multiple group comparisons including ERQ-suppression.
Finally, we examined whether ERQ-reappraisal differen-
tially predicts BDI-II and STAI-T across different diag-
nostic categories. We found the relation between elevated
ERQ- reappraisal and lower BDI-II scores to be stronger
among both MDD and SAD participants than CTL par-
ticipants but did not find evidence of specificity, with MDD
and SAD participants not differing from one another in this
path. With regard to trait anxiety, self-reported reappraisal
predicted lower STAI-T levels to a comparable degree in
CTL, MDD and SAD groups.
Fig. 1 Association among self-reported use of rumination, expressive suppression, and reappraisal with depression and anxiety symptom
severity
Table 2 Path coefficients from ER strategies to BDI and STAI-T
levels by diagnostic category
CTL RMD MDD SAD
Rumination to BDI .35**
a
.41**
ab
.49**
b
.54**
b
Rumination to STAIT .57**
a
.42**
a
.49**
a
.76**
b
Reappraisal to BDI -.17*
a
-.20**
b
-.28**
b
-.29**
b
Reappraisal to STAIT -.27**
a
-.19**
a
-.25**
a
-.23**
a
R square (BDI) .17 .23 .35 .36
R square (STAI-T) .42 .29 .33 .61
Path coefficients are standardized B’s. Diagnostic categories sharing a
subscript do not significantly differ from one another
* p \ .05, ** p \ .01
Table 3 Multiple groups comparisons results: Chi square difference
values between diagnostic groups constrained versus unconstrained in
paths from ER strategies to BDI and STAI-T
Comparison Dv
2
Rumination to BDI
CTL versus MDD 10.91***
CTL versus SAD 18.74***
MDD versus SAD 3.15
CTL versus RMD 3.52
RMD versus MDD .02
Rumination to STAIT
CTL versus MDD .03
CTL versus SAD 8.73**
MDD versus SAD 17.03***
CTL versus RMD .26
RMD versus MDD .00
Reappraisal to BDI
CTL versus MDD 5.89*
CTL versus SAD 5.86*
MDD versus SAD .31
CTL versus RMD 7.52**
RMD versus MDD .27
Reappraisal to STAIT
All groups constrained versus unconstrained 1.23
* p \ .05, ** p \ .01, ** p \ .001
974 Cogn Ther Res (2013) 37:968–980
123

Stability: Differences Across MDD, RMD, and CTL
Groups in the Strength of Association Among Emotion
Regulation Strategies and Symptom Severity
To test whether the strength of the relation between emo-
tion regulation strategy use and symptom severity remains
stable following a depressive episode, multigroup com-
parisons among MDD, RMD, and CTL groups were con-
ducted (see Table 3). We first examined whether the
stronger relation between RRS scores and symptoms
observed in the MDD group would also be evident in the
RMD group, indicating stability in these paths. In fact,
RMD participants did not differ significantly from MDD
participants in the path from RRS to BDI-II scores, nor
from RRS to STAI-T scores. However, evidence for sta-
bility was mixed in that RMD participants also did not
differ significantly in these paths from CTLs. With regards
to reappraisal, we found evidence for stability among the
RMD group in the relation between reappraisal and BDI
scores, but not reappraisal and STAI-T scores. ERQ-reap-
praisal more strongly predicted lower BDI-II scores among
RMD participants than among CTLs, with RMD and MDD
participants not differing from one another. RMD, MDD,
and CTL groups did not differ in the path between ERQ-
reappraisal and STAI-T, and no groups differed from one
another.
Discussion
Previous studies have helped to elucidate differences
among various emotion regulation strategies in their
effectiveness in regulating negative affect. This study
expanded on previous research by examining the frequency
of use of emotion regulation strategies in diagnosed sam-
ples and by addressing whether greater use of maladaptive
strategies, and less use of an adaptive strategy, is specific to
SAD or MDD, or a general feature of psychopathology.
Given that both MDD and SAD participants reported
greater use of expressive suppression and rumination and
less frequent use of reappraisal than did CTLs, the use of
maladaptive strategies is, to some degree, a general feature
of these disorders. Diagnostic groups also differed, how-
ever, in their use of rumination, reappraisal and expressive
suppression, providing support for diagnostic specificity. In
particular, MDD participants reported more frequent use of
rumination and less frequent use of reappraisal than did
SAD participants, who in turn reported more use of
expressive suppression than did their MDD counterparts.
The finding that rumination is particularly common in
the MDD group is not surprising given that the majority of
research on rumination has demonstrated that rumination
plays a significant role in risk for and maintenance of this
disorder (Nolen-Hoeksema et al. 2008). SAD is also
characterized by self-focused attention and negative self-
evaluation, however, and in recent years research has
emerged showing evidence of elevated rumination in
individuals with SAD in anticipation of (Vassilopoulos
2005) and following feared social situations (Edwards et al.
2003), even when controlling for depressive symptoms
(e.g. Abbott and Rapee 2004). Rumination in SAD and
MDD may involve similar processes characterized by
repetitive, self-focused thinking about personal shortcom-
ings. Indeed, in this study, rumination was associated with
more severe depressive symptoms in both groups. Rumi-
nation in SAD, however, frequently termed post-event
processing or post-event rumination, typically focuses on
perceived shortcomings, or negative images of oneself or
one’s performance, during a recent social-evaluative situ-
ation and may differ slightly in its content from depressive
rumination. Post-event rumination, however, has been
found to have similar consequences as depressive rumi-
nation, prolonging anxiety and increasing negative cogni-
tions surrounding a social situation (Wong and Moulds
2009; Morgan and Banerjee 2008). This is consistent with
the results obtained in this study that the relation between
rumination and anxiety was specifically strong in the SAD
participants. These results suggest that rumination in SAD
plays an important role in maintaining both elevated
depression and anxiety.
The results of this study also show that socially anxious
individuals attempt to suppress their emotions to a signif-
icantly greater degree than depressed individuals. These
findings are consistent with results of a recent study that
documented that expressive suppression is more common
among university students who are high versus low in
social anxiety; this study further demonstrated that greater
use of expressive suppression was mediated by beliefs
about the consequences of expressing emotions (Spokas
et al. 2009). Concerns about physical symptoms of anxiety,
including sweating, blushing, and shaking, being noticed
and judged negatively by other people are common in, and
may be unique to, SAD (Scholing and Emmelkamp 1993).
This finding is also consistent with cognitive models of
SAD, which predict that worries about the negative con-
sequences of anxiety symptoms becoming visible to others
may prompt socially anxious people to suppress their
anxiety as a safety behavior to prevent embarrassment
(Clark and Wells 1995; Rapee and Heimberg 1997). Such
safety behaviors are predicted to play a central role in the
maintenance of SAD by preventing disconfirmation of
fearful thoughts. It is important to note that a greater ten-
dency to suppress emotion has also been found to be
associated with other anxiety disorders aside from SAD,
such as panic disorder (Baker et al. 2004; Tull and Roemer
2007) and PTSD (Moore et al. 2008). In fact, reducing use
Cogn Ther Res (2013) 37:968–980 975
123

of suppression and replacing it with more adaptive strate-
gies, such as acceptance and approach-related behaviors, is
a central target of acceptance-based psychotherapy
approaches for a range of psychological disorders (e.g.
acceptance and commitment therapy, ACT, Hayes et al.
1999). Therefore, in future studies it will be important to
examine differences in the implementation and conse-
quences of this strategy across multiple anxiety disorders in
comparison to depression.
Interestingly, in this study the frequency of use of
expressive suppression was not associated with increased
severity of depression or anxiety symptoms in the SAD
group. This result is surprising given previous studies that
have found an association among use of suppression and
increased depression and anxiety, and given that elevated
suppression frequency was found among the SAD partici-
pants relative to MDD and CTL participants (Aldao et al.
2010). As we examined a clinical sample of individuals
with SAD who on average were elevated in suppression, it
is possible that restricted variability in suppression within
the SAD group and the relatively small SAD group size
prevented the detection of an association with symptom
severity. It is also possible that this reflects a limitation in
our measure of anxiety severity and that stronger relations
between suppression and symptom severity would be seen
with a measure which assesses social anxiety specifically,
as opposed to a more general measure of anxiety such as
the STAI. Alternatively, it is possible that suppression is
not uniformly related to greater symptom severity among
all individuals and that we may have omitted important
variables moderating the relation between suppression and
symptom severity; in fact, prior studies have found that
suppression frequency is not uniformly related to negative
outcomes. Eftekhari et al. (2009), who classified partici-
pants on the basis of their frequency of both suppression
and reappraisal use and examined associations with
symptom levels, found that people classified as frequent
users of both strategies represented the most common
pattern of emotion regulation. Although people high in
reappraisal and low in suppression reported the lowest
symptom levels among the categories examined, people
high in use of both strategies also reported effective ER and
relatively low symptom levels. Thus, a subset of individ-
uals who are coping effectively may frequently draw from
both suppression and reappraisal (also see Lam et al. 2009,
who found a positive correlation between reappraisal and
suppression use). Future research is needed to examine the
role of expressive suppression in SAD and the relation
between the use of this emotion regulation strategy and
symptom severity.
Decreased use of reappraisal was reported by both SAD
and MDD participants. Unexpectedly, the results of this
study also provide support for the specificity of reappraisal,
in that depressed individuals reported using reappraisal
significantly less frequently than did socially anxious par-
ticipants. One explanation for this finding is that individ-
uals with MDD may have more difficulty reappraising,
which could result in less frequent use of reappraisal.
Previous studies have documented impairment in the
ability to inhibit the processing of negative emotional
material in MDD, a deficit that is also associated with
greater use of rumination in MDD. In a recent study,
Joormann and Gotlib (2010) demonstrated that difficulty
with inhibition, present to a greater degree in MDD par-
ticipants, was also associated with less frequent use of
reappraisal. However, results did not support the hypoth-
esis that reappraisal exhibits a weaker inverse relationship
with depression and anxiety symptoms among depressed
individuals, which could reflect reduced effectiveness of
this strategy.
The present results also demonstrate that some diffi-
culties with emotion regulation documented in MDD are a
stable feature that endures beyond a depressive episode.
Specifically, RMD participants reported higher levels of
rumination than did CTLs. This finding is consistent with
the results of a recent study reporting greater use of
rumination in RMD individuals than in never-depressed
controls (Ehring et al. 2008). This finding is important
because the overuse of strategies, such as rumination, is
often conceptualized as a vulnerability factor which con-
tributes to the development and maintenance of depression,
yet few studies to date have investigated whether prob-
lematic emotion regulation strategies precede or persist
beyond the acute depressive episode. Our finding suggests
that the use of rumination may not be merely a symptom of
MDD, but may possibly play a role in the development and
maintenance of this disorder. It is important to point out the
limitations of using a remitted depression design to infer
that the use of rumination is a risk factor which may be
causally related to depression, however (see review by Just
et al. 2001). The experience of depression may lead to
important changes in cognitive and biological processes, or
scarring, which in turn fuels increased rumination per-
sisting beyond the offset of the disorder. However, our
finding is consistent with a growing literature supporting
that by adolescence elevated rumination serves as a trait-
like vulnerability factor which is associated with increased
risk for subsequent increases in depression (Abela et al.
2012; Hankin 2009; Hilt et al. 2010). High trait rumination
has been linked to stable characteristics such as deficits in
executive control processes (Hilt et al. 2012; Joormann
2006; Joormann and Gotlib 2010). Moreover, given the
highly recurrent nature of MDD, elevated rumination
enduring beyond the offset of a depressive episode may be
an important factor influencing depressed individuals’ risk
for future recurrences. Interestingly, however, RMD and
976 Cogn Ther Res (2013) 37:968–980
123

CTL participants did not differ in their use of reappraisal,
suggesting it is possible that difficulty reappraising is
confined to the acute depressive episode. Reappraisal may
become more cognitively demanding and thus more diffi-
cult to effectively implement when it is used to regulate
intense emotions (Sheppes et al. 2011). Reappraisal may
therefore be easier for individuals to implement once they
are no longer depressed, accounting for the increased use of
this strategy reported in the RMD relative to the MDD
group. It is further possible that individuals in the RMD
group may have been more likely to receive prior treatment
focused on increasing reappraisal use, such as cognitive
therapy; as we do not have data on participants’ prior
experience in cognitive therapy, this would be an inter-
esting question for future research. As previously noted,
few studies have examined reappraisal ability in clinically
depressed samples, and even less is known about both the
use and effectiveness of reappraisal in remitted individuals.
Reappraisal has been shown to be less consistently related
to symptoms of psychopathology (Aldao et al. 2010), and
some studies have failed to find reduced reappraisal ability
in clinical samples (e.g. Aldao and Mennin 2012). Con-
verging with these prior studies, the magnitude of relations
between reappraisal use and both BDI and STAI in the
present study were all small. The consequences of reap-
praisal may be more sensitive to contextual factors and
other individual traits, thus it may be premature to con-
clude that difficulties with reappraisal do not characterize
remitted individuals. Clearly, more research on the stability
of the use of emotion regulation strategies is needed.
Despite the strengths of this study, perhaps most notably
that it permitted the examination of the role of multiple
strategies in different diagnostic groups, we should note
several limitations. First, this study relied on self-report
measures of the frequency of strategy use. There are many
challenges in assessing the dispositional use of emotion
regulation strategies, such as limitations in individuals’
awareness and ability to report accurately on their daily
strategy use. Therefore, we cannot be sure that participants’
self-reported use of emotion regulation strategies corre-
sponds to characteristics of their actual use of these strat-
egies in their daily life. In addition, it has been argued that
single emotion regulation strategies are not likely to be
universally adaptive or maladaptive, but that a person’s
ability to select strategies which appropriately fit a situation
at hand and to flexibly draw from a wide variety of strat-
egies are more important indicators of adaptive emotion
regulation (e.g. Hofmann et al. 2012). An experience
sampling approach would allow investigation of these
variables, as well as ensuring greater generalizability of
results to participants’ day to day lives. In addition, given
that the present study was cross-sectional and did not
include laboratory measures which assess diagnostic group
differences in the deployment and effectiveness of each
strategy, this limits our ability to draw conclusions about
specific ways in which elevated use of specific maladaptive
strategies and underuse of reappraisal may contribute to
MDD and SAD. However, self-reported use of these
strategies has been found in recent studies to be related to
other laboratory measures of emotion regulation, including
psychophysiological measures of stress response (e.g.
Mauss et al. 2007) and recently, to enhanced reappraisal
ability (McRae et al. 2012).
Second, as the STAI is a general measure of anxiety
severity, as opposed to a specific measure of social anxiety
symptoms, this presented a limitation in drawing conclu-
sions about emotion regulation specificity to MDD versus
SAD. For instance, it is possible that use of a SAD symp-
tom-specific measure would have yielded significant rela-
tions between suppression and symptom severity. In
addition, depression is often characterized by elevated
general anxiety symptoms, and the MDD group was com-
parably elevated on the STAI as the SAD group in the
present study. In contrast, as the BDI is a measure that is
more specific to MDD, it is difficult to gauge whether MDD
and SAD groups differed in clinical severity, which may
also be associated with the use of emotion regulation
strategies. Therefore, it would be important to replicate our
results using a measure of anxiety specific to social anxiety
symptoms. Third, while the use of ‘‘pure’’ MDD and SAD
groups was necessary in the present study in order to
address the question of which features of emotion regula-
tion are specific to one disorder versus the other, a limitation
of this approach is reduced external validity. Given the high
rates of comorbidity of MDD and SAD, it would be ideal in
future studies also to include a comorbid MDD-SAD group
in order to better understand the role of emotion regulation
in this subpopulation. In addition, due to the nature of
participant recruitment, we obtained small SAD and RMD
samples relative to the MDD and CTL groups, reducing
power to detect significant effects in these groups particu-
larly within the multiple group comparisons. Finally, it is
possible that restricted variability in anxiety and depression
symptom severity within the CTL group compared to the
clinical groups may have contributed to the weaker rela-
tionships between emotion regulation strategy use and
symptom severity observed within this group.
This study increases our knowledge of the use of emo-
tion regulation strategies in MDD and SAD. The results
indicate that individual differences in the use of emotion
regulation strategies may play a significant role in the
maintenance of both SAD and MDD, although these dis-
orders may differ in the types of strategies most commonly
used and in the mechanisms underlying the relation among
strategy use and symptom severity. To summarize, both
SAD and MDD are characterized by increased use of both
Cogn Ther Res (2013) 37:968–980 977
123
