
Effect of Gas Composition on Nitriding and Wear Behavior
of Nitrided Titanium Alloy Ti-15V-3Cr-3Al-3Sn
C. Anandan, P.Dilli Babu, and L. Mohan
(Submitted November 8, 2012; in revised form December 26, 2012; published online April 6, 2013)
Titanium alloy, Ti-15V-3Cr-3Al-3Sn was nitrided at different temperatures with low pressure plasma with
100% nitrogen, and nitrogen diluted with hydrogen and argon. The nitrided layers were characterized for
hardness, structure, and composition. Nitrided samples show weight gain that depended on temperature
and duration of nitriding. EDS results show that intake of nitrogen is significant at temperatures above
750 °C. Hydrogen dilution increases intake of nitrogen. Samples nitrided with hydrogen dilution have
lower surface roughness and higher nitrogen concentration. Depth profiling by XPS shows the formation of
nitride in the near-surface region and also that nitrogen concentration in the interior of the nitrided layers is
higher at higher temperatures. Micro Raman shows that formation of nitride takes place at higher tem-
peratures. XRD shows that the nitrided layers consist predominantly of alpha Ti and Ti
2
N. This is reflected
in the hardness increase and hardness profile in the nitrided samples. The low intake of nitrogen by the
alloy is attributed to the low solubility of nitrogen in beta alloy and low diffusion coefficient of nitrogen.
Reciprocating wear studies showed a lower coefficient of friction and lower wear loss for nitrided samples
compared to that of substrate.
Keywords gas dilution, hardness, plasma nitriding, Ti-15-3,
titanium alloy, wear, XPS
1. Introduction
Titanium and its alloys have high strength-to-weight ratio
and possess excellent corrosion resistance. Pure Titanium is an
a alloy, and the a-to-b transformation occurs at about 885 C.
Depending on the nature of alloying elements and their
concentration, titanium alloys can exist in a, b,ora + b form,
and the transformation temperature may be higher or lower than
pure titanium (Ref 1). In case of a + b alloy, Ti-6Al-4V, the
a-to-b transformation occurs at 980 C. On the other hand, beta
alloys are a class of alloys for which the transus temperature
can be as low as 750 C (Ref 1, 2). Most of the metal-forming
operations of the titanium alloys are performed at high
temperatures because of the high temperatures needed for
inducing plastic flow. However, these high temperatures are
energy intensive. Also these thermomechanical treatments may
induce unwarranted metallurgical changes in the base material.
The low beta transus temperature of titanium alloys make them
amenable to lower-temperature operations compared with
a + b alloys. Among the several b alloys, vanadium-containing
alloys such as Ti-10-2-3 and Ti-15-3—find prominent place in
aerospace sector. For example, Ti-10-2-3 has been used in
landing gear application in aircraft and Ti-15-3 has found
several applications in aerospace industry (Ref 2).
While titanium alloys possess high strength-to-weight ratio
and good corrosion resistance, they suffer from poor wear
resistance. They are prone to severe galling and scouring in the
presence of moving contacts (Ref 3, 4). Therefore, usage of
titanium alloys is mainly restricted to components under static
loading conditions in many industries, mainly in aerospace and
chemical industries (Ref 2, 3, 5). For applications that require
wear resistance, therefore, it is necessary to increase the surface
hardness of these alloys (Ref 5-7). Surface modifications by ion
implantation, (Ref 4, 8-11) nitriding, (Ref 11-13), and duplex
treatments (Ref 6, 7) have been carried out on titanium alloys.
The nitriding behaviors of pure titanium and the most popular
titanium alloy Ti-6Al-4V have been well documented (Ref 11,
14-17). These studies show that effective nitriding takes place
at temperatures close to the beta transus temperatures. Since the
beta transus temperature of beta alloys is low, it is expected that
effective nitriding of these alloys can be carried out at lower
temperatures. However, in the case of beta alloys, only limited
reports are available on their nitriding behavior. Of these, the
study by Zhecheva et al. is notable (Ref 18-20). Those
experiments were carried out in gas phase in the temperature
range of 800-1050 C and at pressures of few Pascals. Their
main observation has been that the extent to which beta alloys
can be nitrided is limited. For example, their investigations of
Ti-10-2-3 and LCB have shown that the nitride-layer thick-
nesses in these alloy are low, and hardness increase is also low
(Ref 20).
The present article reports the results of a detailed inves-
tigation on nitriding of the beta alloy Ti-15V-3Cr-3Al-3Sn
(Ti-15-3)—in a low-pressure nitrogen plasma in the temperature
range of 600-900 C instead of gas nitriding. The results show
that the alloyÕs nitridability is low and higher temperatures, i.e.,
>800 C, as in the case of Ti-6Al-4V, are needed to effectively
nitride these alloys. Also, effects of hydrogen and argon dilution
of nitrogen on nitriding of the alloy are discussed.
C. Anandan, P. Dilli Babu, and L. Mohan, Surface Engineering
Division, CSIR—National Aerospace Laboratories, P.O. Box 1779,
Old Airport Road, Bangalore 560 017 Karnataka, India. Contact
e-mail: [email protected].
JMEPEG (2013) 22:2623–2633 ASM International
DOI: 10.1007/s11665-013-0540-0 1059-9495/$19.00
Journal of Materials Engineering and Performance Volume 22(9) September 2013—2623
2. Materials and Methods
Titanium alloy, Ti-15-3, was procured in the form of 2-mm-
thick sheets from M/s. Titanium Metal Corporation, USA. The
composition of the material is 15V, 2.98Cr, 3.12Al, 3.05Sn,
0.15Fe and the balance Ti. The beta transus temperature is in
the range of 750-775 C. Flat samples of dimensions
25 9 25 9 2mm
3
, size were used for nitriding experiments.
These samples were prepared for plasma nitriding by grinding
with silicon carbide sheets of grit sizes varying from 400 to
1200 and polished with 0.3 lm alumina. Finally, they were
ultrasonically cleaned with acetone for 10 minutes and weighed
using a Sartorius balance before loading into the vacuum
chamber. The roughness of the samples after polishing was
0.07 lm. The vacuum chamber was evacuated to a pressure of
less than 4 9 10
6
mbar, and the samples were heated to the
required temperature on a heating stage. Plasma nitriding was
carried out at 600, 700, 750, 800, 850, and 900 C with
atmospheres of 100% N, 80% N-20% H, and 80% N-20% Ar.
Plasma was generated using 13.56-MHz RF generator at 50 W.
The details of the temperature and duration of the experiments
are given in Table 1. After nitriding, the samples were cooled to
room temperature under vacuum and analyzed for change in
weight, roughness, hardness, and composition.
The nitrided samples were weighed after treatment. The
surface hardness values of the nitrided samples were measured
using the Buehler
Micromet Testing Machine with KnoopsÕ
indenter at loads of 25, 50, 100, and 200 gf. The substrate
hardness is in the range of 350-360 HK at 50-gf load. The cross-
sectional hardness profile of the samples was measured at 50-gf
load after molding them in resin mould and polishing. The
cross-sectional optical micrographs of the nitrided edge were
obtained after etching the polished samples using KrollÕs reagent
(25 mL H
2
O + 2 mL conc. HNO
3
+ 1 mL conc. HF) for 15 s.
The roughness of the samples was measured using Mitutoyo
surface profiler. The presence of various phases in the nitrided
layer was identified by means of X-Ray diffraction (XRD) using
PHILIPS X-ray diffractometer (BRUKER, Germany). A mono-
chromatic source, Cu K
a
radiation (k = 0.1548 nm), was used,
Table 1 Plasma-nitriding temperatures and durations for
different gas compositions
Temperature (°C)
Duration in hours
100% N 80:20 (N:H) 80:20 (N:Ar)
700 4 4 …
700 8 8 …
750 4 4 …
750 8 8 …
800 4 4 4
800 8 8 8
850 4 4 …
850 8 8 …
900 8 4 …
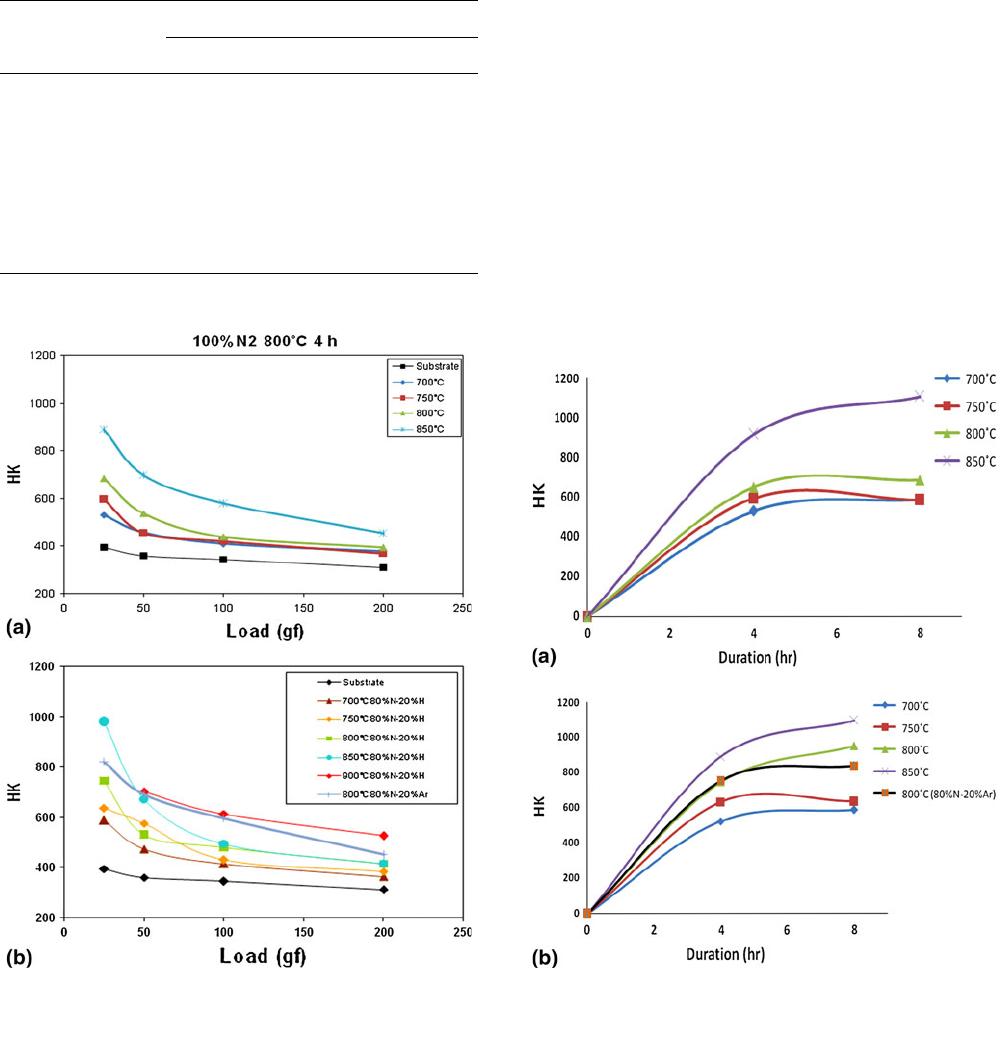
Fig. 1 Surface Hardness of samples nitrided for 4 h at different
temperatures with different gas compositions: (a) 100% nitrogen,
(b) 20% hydrogen-diluted nitrogen and argon-diluted nitrogen
Fig. 2 Variation of hardness with nitriding time for different gas
compositions: (a) 100% N and (b) 80% N-20% H and 80% N-20%
Ar
2624—Volume 22(9) September 2013 Journal of Materials Engineering and Performance
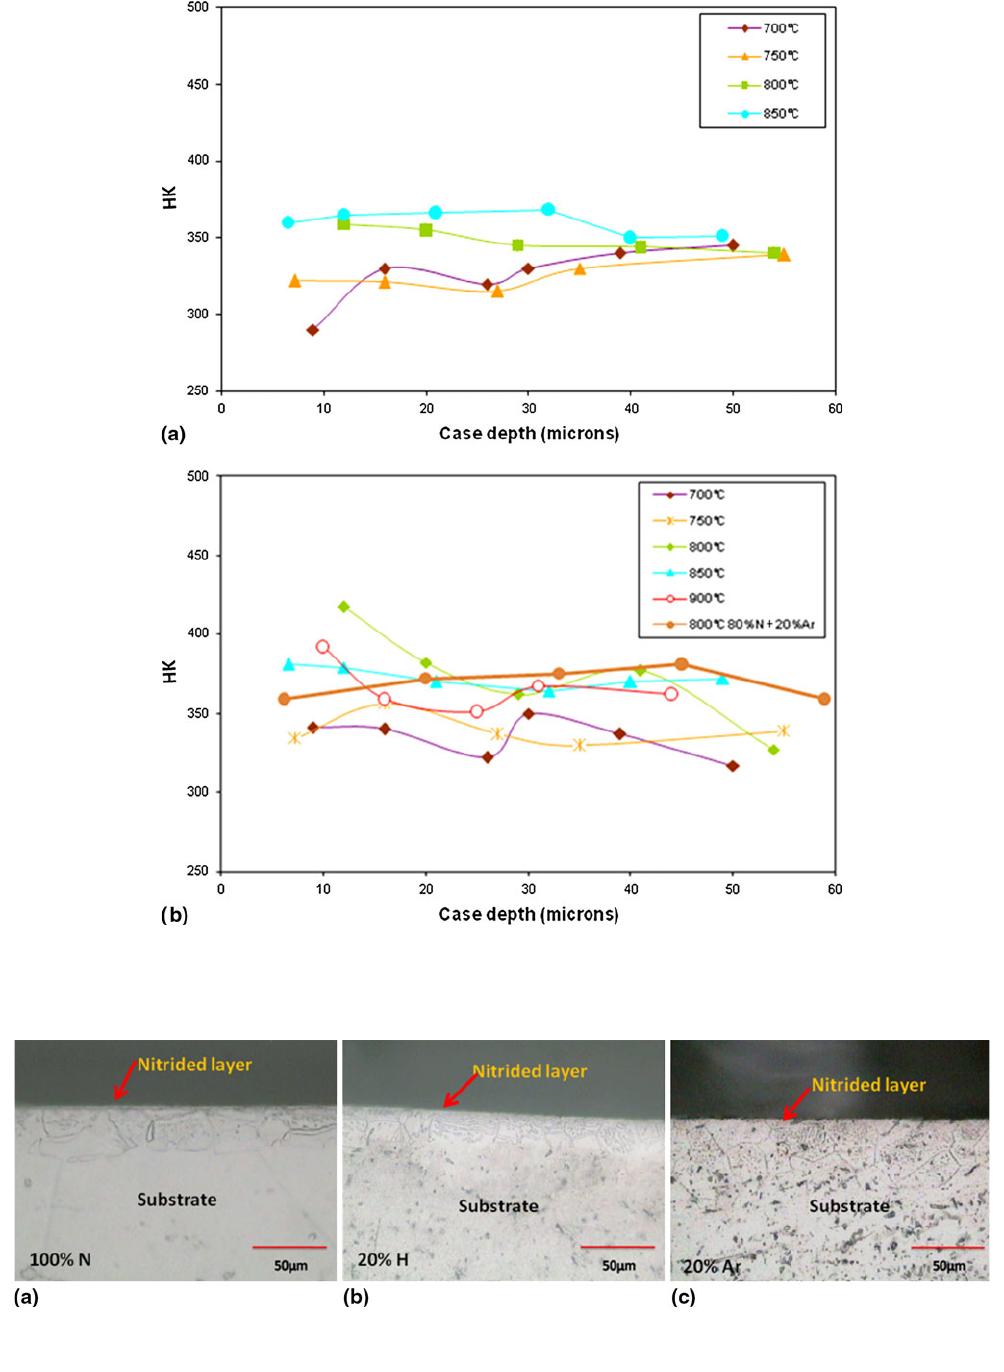
Fig. 3 Cross-sectional hardness for samples nitrided at different temperature and gas compositions: (a) 100% N and (b) 80% N-20% H and
80% N-20 % Ar
Fig. 4 Cross-sectional optical micrographs of samples nitrided at different gas compositions: (a) 8 h/800 C in 100% N, (b) 4 h/800 C in 80%
N-20% H, and (c) 4 h/800 C in 80% N-20% Ar (5009)
Journal of Materials Engineering and Performance Volume 22(9) September 2013—2625
and the samples were scanned from 0 to 80 at a scanning rate
of 0.5/min. Micro Raman spectra were obtained using Labram
010 Model of DILOR-JOBIN-YVON-SPEX Micro Raman
spectrometer with 623.4-nm laser. The surface morphologies of
the samples were examined through Carl Zeiss Supra 40 VP
FESEM. The composition of the nitrided layer was obtained
using Inca Penta Fetx3 (Oxford) EDAX analyzer attached to the
FESEM and also by means of X-ray Photoelectron Spectros-
copy (XPS). The XPS spectra were obtained on a SPECS XPS
system equipped with a hemispherical analyzer and a single-
channel detector, and twin anode X-ray source. Core level
spectra of Ti2p and N1s were obtained using 100-W Al K
a
radiation at a pass energy of 25 eV. The spectra were obtained in
the as-received condition, and after sputter etching with argon
ions. Elemental distribution in the nitrided layer was obtained by
sputter profiling using 1 keV argon ions at a pressure of
1 9 10
5
mbar and recording the spectra after each sputtering.
Wear studies were carried out on a reciprocating-type wear tester
(Model CM 9084 DuCom) (Ref 21). An alumina ball of 6-mm
diameter was used as the counter surface. A stroke length of
10 mm and a frequency of 100 Hz/min were used at 3 and 5N
normal forces. The duration of experiment was 20 min. After
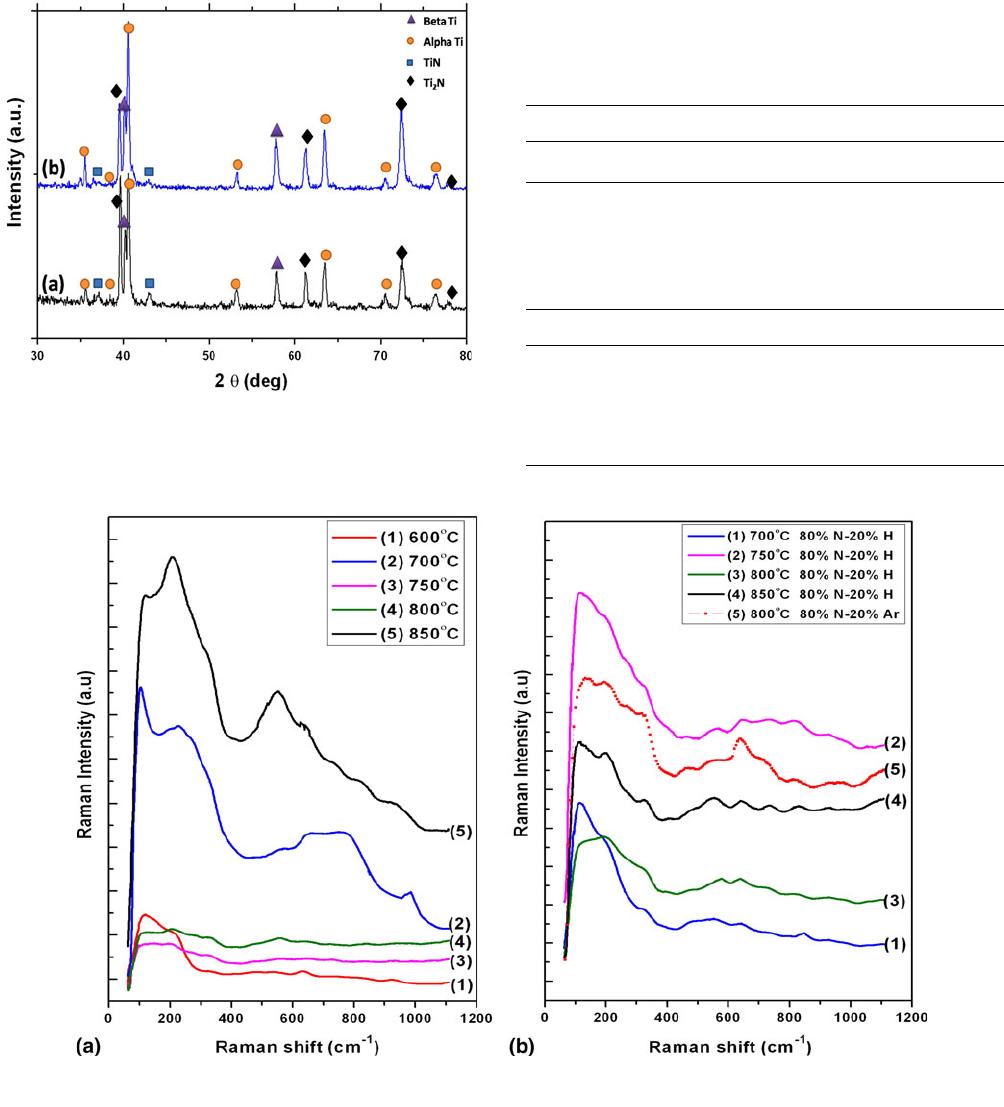
Fig. 6 Raman spectra of samples treated at different temperatures for 8 h (a) 100% N and (b) 80% N-20% H and 80% N-20% Ar
Table 3 Comparison of N at.% after nitriding for 8 h
with different gas compositions
Temperature (°C) Gas composition N (at.%)
750 100% N 17.92
750 80% N-20% H 20.25
800 100% N 18.13
800 80% N-20% H 24.26
800 80% N-20% Ar 17.68
Table 2 Nitrogen concentration in at.% in samples
nitrided in 100% N for 8 h
Temperature (°C) 600 700 750 800 850
N (at.%) 2.56 12.99 17.92 18.13 33.77
Fig. 5 X-ray diffraction pattern for (a) sample nitride at 850 C for
4 h in 100% nitrogen, and (b) sample nitride at 800 C for 4 h in
hydrogen-diluted nitrogen
2626—Volume 22(9) September 2013 Journal of Materials Engineering and Performance
the experiments, the samples were examined for wear profile
using 2D and 3D profilometer, Nanomap 500 LS.
3. Results and Discussion
The roughness of the substrate before nitriding was
0.07 lm. The roughness increased marginally to about
0.08 lm after nitriding in 100% nitrogen, especially at higher
temperatures. After nitriding with hydrogen dilution, the
roughness was 0.05 lm. There was marginal effect of temper-
ature in this case. With argon dilution, the roughness increased
slightly to 0.09 lm. With increasing duration of nitriding, the
roughness also increased in this case. All the nitrided samples
showed a weight gain. The weight gain depended on the
nitriding temperature, duration and gas composition. Significant
weight gain was observed only after nitriding at greater than
750 C. Dilution of nitrogen with hydrogen seems to increase
nitrogen intake by the sample.
The surface hardness of samples nitrided at different
temperatures for 4 h in 100% nitrogen and nitrogen diluted
with 20% hydrogen and 20% argon, are shown in Fig. 1(a) and
(b), respectively. It can be observed from the figures that the
hardness of the samples increases with temperature. The
hardness at 25 gf has increased by 2-3 times after nitriding at
higher temperatures. A comparison of the graphs shows that
increase in hardness is higher after nitriding with hydrogen-
diluted nitrogen compared with nitriding in 100% nitrogen- or
Ar-diluted nitrogen. Also, the decrease of hardness with load is
less steep in this case. Figure 2(a) and (b) shows the
dependence of hardness on nitriding duration at different
temperatures. The graphs show that the hardness increases with
time, but significant increase is again found only after nitriding
at greater than 750 C.
Hardness profiles are shown in Fig. 3(a) and (b) for samples
nitrided at different temperatures with different gas composi-
tions. The data were obtained at a load of 50 gf. As can be seen
in the graphs, hardness has not increased in the subsurface
region of the nitrided layers. The expected trend of a high
hardness at the surface that decreases with depth into the
substrate is not observed. The hardness remains almost
constant. Similar observations have been made by Sha and
Malinov (Ref 20) and Zhecheva et al. (Ref 17, 18) in their gas-
nitriding experiments on beta titanium alloys. Samples treated
under 80% N-20% H show a comparatively higher hardness up
to about 20 lm.
Optical micrographs of the cross section of the sample
nitrided at 800 C for 8 h using 100% nitrogen and samples
nitrided at 800 C for 4 h using hydrogen- and argon- diluted
nitrogen are given in Fig. 4(a)-(c), respectively. Very thin
nitrided layers can be seen in the figures, implying very thin
nitride-layer formation along with a-phase in the near-surface
region. The thin nitrided edge shows that the alloy is difficult to
nitride. This is further discussed later.
X-ray diffraction patterns from the samples nitrided at
850 C using 100% N and at 800 C using hydrogen diluted
nitrogen are given in Fig. 5(a) and (b). The location of different
peaks pertaining to (b) beta phase, (a) alpha phase, and nitrides,
TiN and Ti
2
N, are shown in the figures (Ref 20, 22, 23). After
nitriding, appearance of a phase can be seen along with the
nitrides. The intensity of the TiN phase is much lower than that
of Ti
2
N. This shows that predominantly Ti
2
N is formed along
with alpha-phase formation. In the sample nitrided with
hydrogen dilution, the intensities of the alpha and Ti
2
N peaks
are higher implying greater intake of nitrogen.
Figure 6(a) and (b) shows the micro Raman spectra of
samples nitrided at different temperatures using 100% nitrogen
and 20% hydrogen- and argon-diluted cases. For TiNx, the
transverse optical and longitudinal optical (TO + LO) phonon
peaks occur in the 500-800 cm
1
wave number range, which
correspond to titanium vacancies in the lattice. The transverse
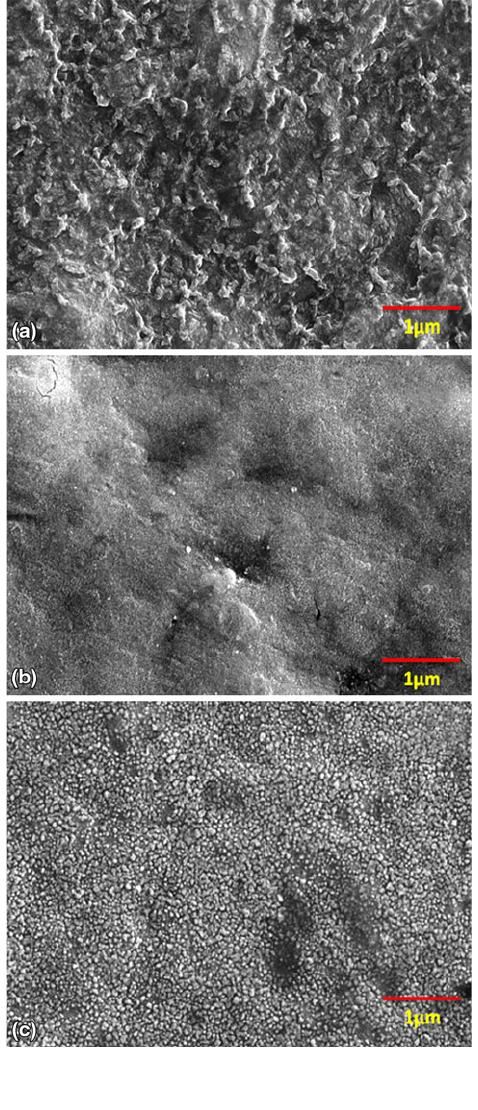
Fig. 7 FESEM images of samples nitride for 8 h at 800 C:
(a) 100% N, (b) 80% N-20% H, and (c) 80% N-20% Ar
Journal of Materials Engineering and Performance Volume 22(9) September 2013—2627

acoustic and longitudinal acoustic (TA + LA) phonons occur in
the 200-400 cm
1
wave number range, which correspond to
nitrogen vacancies in the lattice (Ref 24). As seen in the
spectra, significant intensities can be observed only after
800 C nitriding, and at lower temperatures, the intensities of
the peaks are low, especially in the 550-800 cm
1
wave
number range. For samples treated for 8 h in 100% N, Raman
peaks were observed in the wave number range of 210-
220 cm
1
, close to that of standard nitride TA/LA peaks. In the
case of samples nitrided with hydrogen dilution, the spectral
features do not resemble that of TiN, and at higher wave
number range of 500-800 cm
1
, peaks are not clear. The ratio
of the TO + LO phonon peak intensities to that of TA + LA
acoustic phonon intensities in TiN
x
has been used as a measure
of concentration of nitrogen vacancies in TiN
x
. If the intensity
ratio is lower than 1, then the nitrogen concentration, x, is lower
than unity (Ref 25-27). From a qualitative assessment of the
Raman spectra shown in Fig. 6(a) and (b), it is clear that x is
less than 1 in these samples. This shows that nitrogen intake by
the samples is lower than that needed for stoichiometric TiN
formation.
Table 2 shows the atomic percentage of nitrogen under
samples after 8 h of nitriding in 100% N at different
temperatures, and Table 3 compares the nitrogen concentrations
in samples nitrided for 8 h at 750 C and 800 C under 100%
N, 80% N-20% H, and 80% N-20% Ar gas compositions. It can
be observed from the above tables that significant increase in
nitrogen concentration can be observed only after nitriding at
greater than 750 C, and after nitriding at 850 C, nitrogen
concentration reaches 33.7 at.%. Further, it can be seen from
Table 3 that hydrogen dilution increases nitrogen concentration
in the nitrided layers, whereas argon dilution leads to a nominal
decrease. In stoichiometric TiN, the nitrogen concentration is
50 at.% and in Ti
2
N, it is 33.3 at.%. Therefore, as deduced
from Raman spectral intensities and X-ray diffraction data, the
nitrogen concentration is lower than that expected from the one
that is needed for TiN formation, and the EDS results shown in
Table 3 support is conclusion.
Fig. 8 Distribution of nitrogen (a) and titanium (b) in samples nitrided at different temperatures in 100% N (inset: XPS spectra of (a) N1s and
(b) Ti2p core levels obtained at different depths from samples nitrided for 4 h at 800 C)
2628—Volume 22(9) September 2013 Journal of Materials Engineering and Performance
FESEM images of the surface morphologies of the samples
nitrided at 800 C for 8 h are shown in Fig. 7(a)-(c) for various
gas compositions. It can be seen from the micrographs that in
the case of samples nitrided with 100% nitrogen, the surface
has ridge-like structure whereas that in argon the diluted-case
the surface appears rough with nanometer-sized precipitates
present on the surface. In the case of samples nitrided with
hydrogen-diluted nitrogen, the surface appears smoother. This
is in conformity with earlier results of surface roughness
measurements, where samples nitrided with hydrogen dilution
had lower surface roughness values.
Figure 8(a) and (b) shows nitrogen and titanium distribution
in the samples after nitriding in 100% nitrogen at different
temperatures. The insets in the figures show the Ti2p and N1s
core level spectra after sputter etching for different durations. In
the case of Ti2p core level spectra, oxide as well as nitride
peaks are present on the surface with Ti2p3/2 core level-
binding energies at 458 and 456 eV, respectively (Ref 28-30).
After etching for few minutes, the oxide is removed, and only
nitride is present. Further etching shifts the peak position to
lower binding energy values with increasing sputtering time. In
the case of N1s core level, the peak binding energy is at
398.5 eV, corresponding to nitrogen in nitride form and shifts
to lower BE values with sputter etching. After nitriding for 4 h
at 800 C, the surface nitrogen concentration is about 23 at.%
and decreases sharply with respect to sputtering time. After
nitriding for 2 h at 850 C the surface concentration is 17 at.%
and decreases with increasing sputter depth less steeply. After
nitriding at 900 C for 1 h, the surface concentration is 15 at.%,
but its decreases very slowly with increasing sputter time. These
profiles show that at temperatures lower than 850 C, the
diffusion of nitrogen is low, and significant diffusion takes place
only at higher temperatures. This trend in diffusion is reflected
in the intake of nitrogen in the near-surface region and
consequent hardness increase and its profile that could be
achieved. The hardness profiles shown in Fig. 1(a) and (b)
shows that hardness decreases rapidly with load and also that the
hardness profile is nearly flat as shown in Fig. 2(a) and (b).
Since intake of nitrogen is low, alpha titanium is observed as
nitrogen is an alpha stabilizer, and Ti
2
N is the predominant
phase formed. Precipitates of TiN may be formed as evidenced
from the low intensity of TiN peaks in the XRD. As nitrogen
diffusion coefficient is low in titanium at temperatures lower
than 800 C, the nitrided layer thickness is also low.
0 5 10 15 20
0.0
0.2
0.4
0.6
0.8
1.0
Substrate
3N
5N
COF
Time (in mins)
(a)
0 5 10 15 20
0.0
0.2
0.4
0.6
0.8
1.0
COF
Time (in mins)
100% N
(b)
0 5 10 15 20
0.0
0.2
0.4
0.6
0.8
1.0
(c)
80% N-20%H
COF
Time (in mins)
0 5 10 15 20
0.0
0.2
0.4
0.6
0.8
1.0
(d)
Time (in mins)
COF
80% N-20%Ar
3N
5N
3N
5N
3N
5N
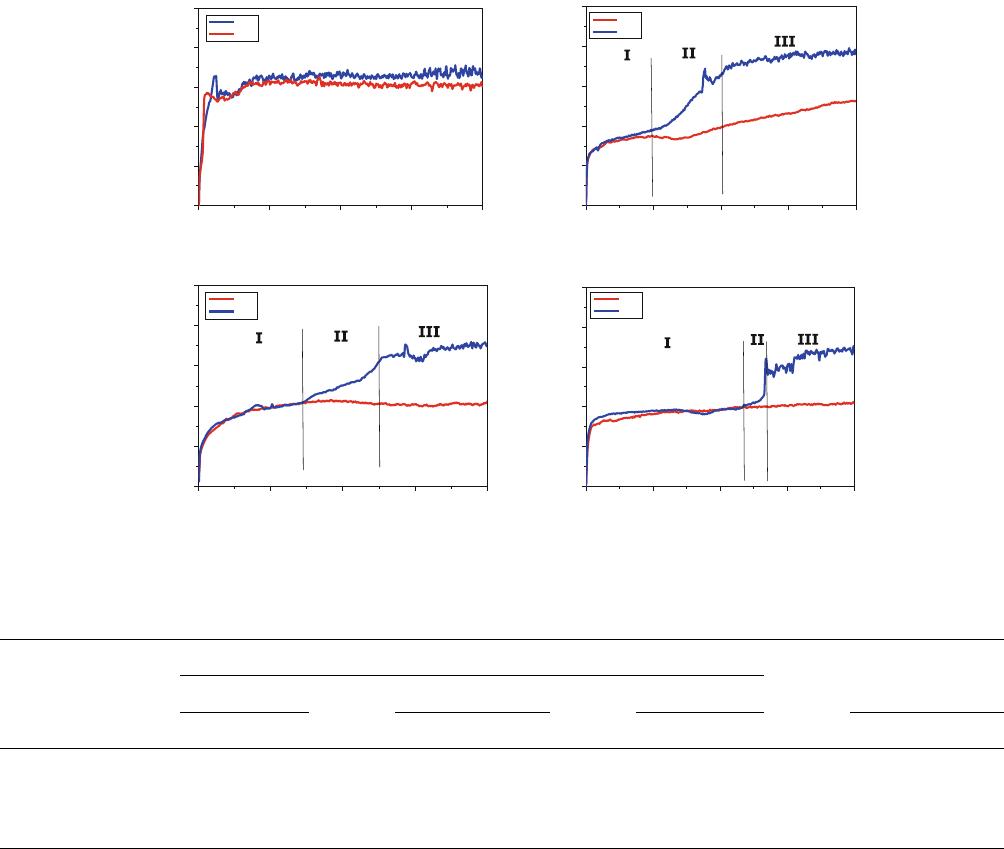
Fig. 9 COF versus time on (a) substrate and samples nitride at 800 C for 4 h, (b) 100% N, (c) 80% N-20% H, and (d) 80% N-20% Ar
Table 4 COF and wear loss for substrate and nitrided samples
Average COF under different loads
Wear loss (mm
3
)Region-I Region-II Region-III
3N 5N 3N 5N 3N 5N 3N 5N
Substrate 0.6 0.6 …………0.14 0.225
100% N 0.3 0.3 0.3 0.5-0.7 0.3 0.7 … 0.155
80-20% N-H 0.3 0.3 0.3 0.4-0.6 0.3 0.6 … 0.075
80-20% N-Ar 0.3 0.3 0.3 0.4-0.6 0.3 0.6 … 0.075
Journal of Materials Engineering and Performance Volume 22(9) September 2013—2629
The wear and frictional properties of the substrate and
samples nitrided at different conditions were investigated in a
linear reciprocating wear test. The evolutions of coefficient of
friction (COF) for different loads in the linear reciprocating
wear test are shown in Fig. 9(a)-(d). The average values of
COF and wear loss for the Ti-15-3 substrate and nitrided
samples are given in Table 4. While in the case of substrate the
COF increases rapidly to a high value of 0.6 at both 3N and 5N
loads, the nitrided samples behave differently. In these cases,
the COF is low at 3N load, especially for the samples nitrided
with diluted nitrogen; at 5N load, three regimes can be seen in
the figures in the evolution of the friction coefficient. In region-
I, the COF is low (0.3-0.4), and in region-III, it is close to that
of substrate with a transition in region-II. The COF increases
gradually in the transition region. Thus, nitriding considerably
reduces the friction at low loads, and at higher loads, once the
nitrided layer is removed, the COF reaches that of substrate.
Dilution of nitrogen with hydrogen or argon increases duration
of region-I, the low-COF region. Hydrogen dilution further
provides a gradual transition to region-III.
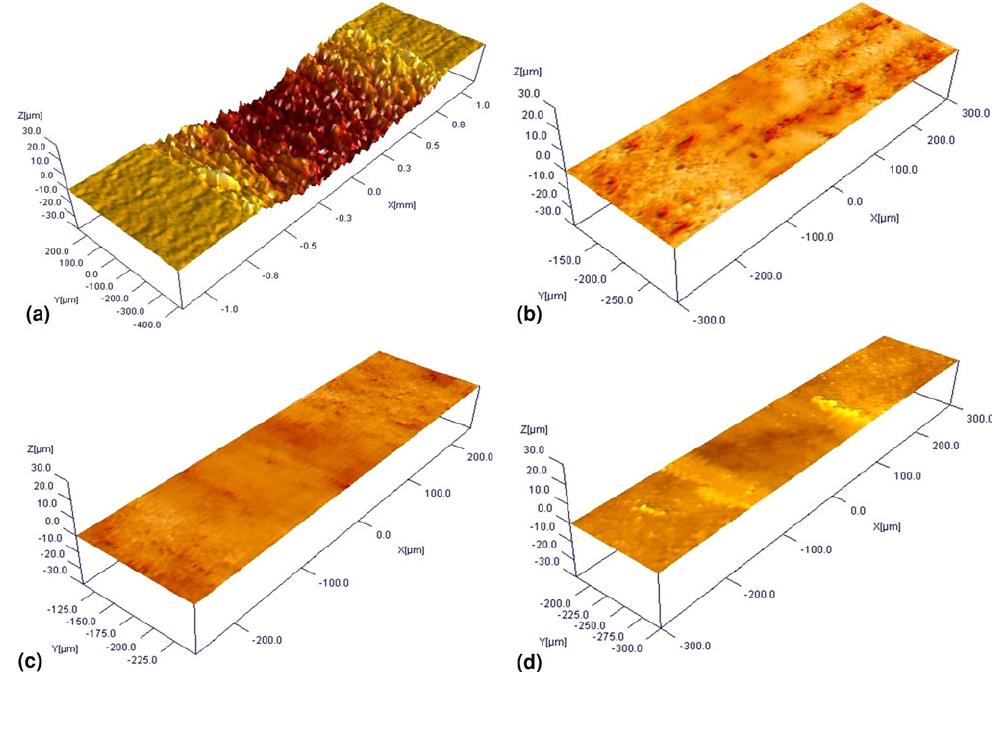
The 3D profiles of wear tracks on the substrate and nitrided
samples are shown in Fig. 10 for 3N load. In the case of
substrate, the profile shows clear wear profile, from which wear
loss can be estimated. For the nitrided samples, the wear profile
was smoother with no clear wear profile, suggesting negligible
wear. The 2D and 3D wear profiles of the wear tracks at 5N
load are shown in Fig. 11(a) for the substrate and for nitrided
samples in Fig. 11(b)-(d). It can be seen from the 2D and 3D
profiles in Fig. 11(a) that the wear profile on the substrate has
deep grooves of several microns depth, while the wear tracks
on the nitrided samples appear less deep. The 2D wear
profiles of the samples at higher magnification are shown in
Fig. 11(a)-(d). The figs show that nitriding with dilution
decreases wear, as the wear tracks appear smoother than those
on the substrate and sample nitrided with 100% nitrogen. Wear
loss shown in Table 4 indicates that nitriding reduces the wear
loss. In the case of substrate, the wear loss nearly doubles to
0.225 mm
3
from 0.14 mm
3
for increase in load from 3N to 5N.
After nitriding, the wear is negligible for 3N load. For 5N load,
after nitriding with 100% N, wear loss is reduced by 50% to
0.15 mm
3
, while for samples nitrided with dilution of nitrogen
with H and Ar, it is further reduced to 0.07 mm
3
. Thus, the
appearance of deep grooves in wear tracks and the considerable
wear loss at 3N load itself suggest that the wear is abrasive in
nature in the case of substrate. In the case of nitrided samples,
the 3D wear profile is smoother, and wear loss is negligible at
3N load. The COF is also lower during the entire duration of
wear testing. At 5N load, the wear loss is lower than that of
substrate, and the COF is low in region-I. This shows that the
wear mechanism has changed from abrasive wear on the
substrate to adhesive wear after nitriding. At higher loads, once
the nitrided layer is removed, the wear mechanism changes to
abrasive wear as seen from the wear profile and higher COF at
the end of the wear test. Further, the transition from region-I to
III is gradual in the case of samples nitrided with hydrogen
dilution. Thus, nitriding with diluted nitrogen, especially with
Fig. 10 Profiles of wear tracks in 3D at 3N load on (a) substrate and samples nitrided at 800 C for 4 h, (b) 100% N, (c) 80% N-20% H, and
(d) 80% N-20% Ar
2630—Volume 22(9) September 2013 Journal of Materials Engineering and Performance
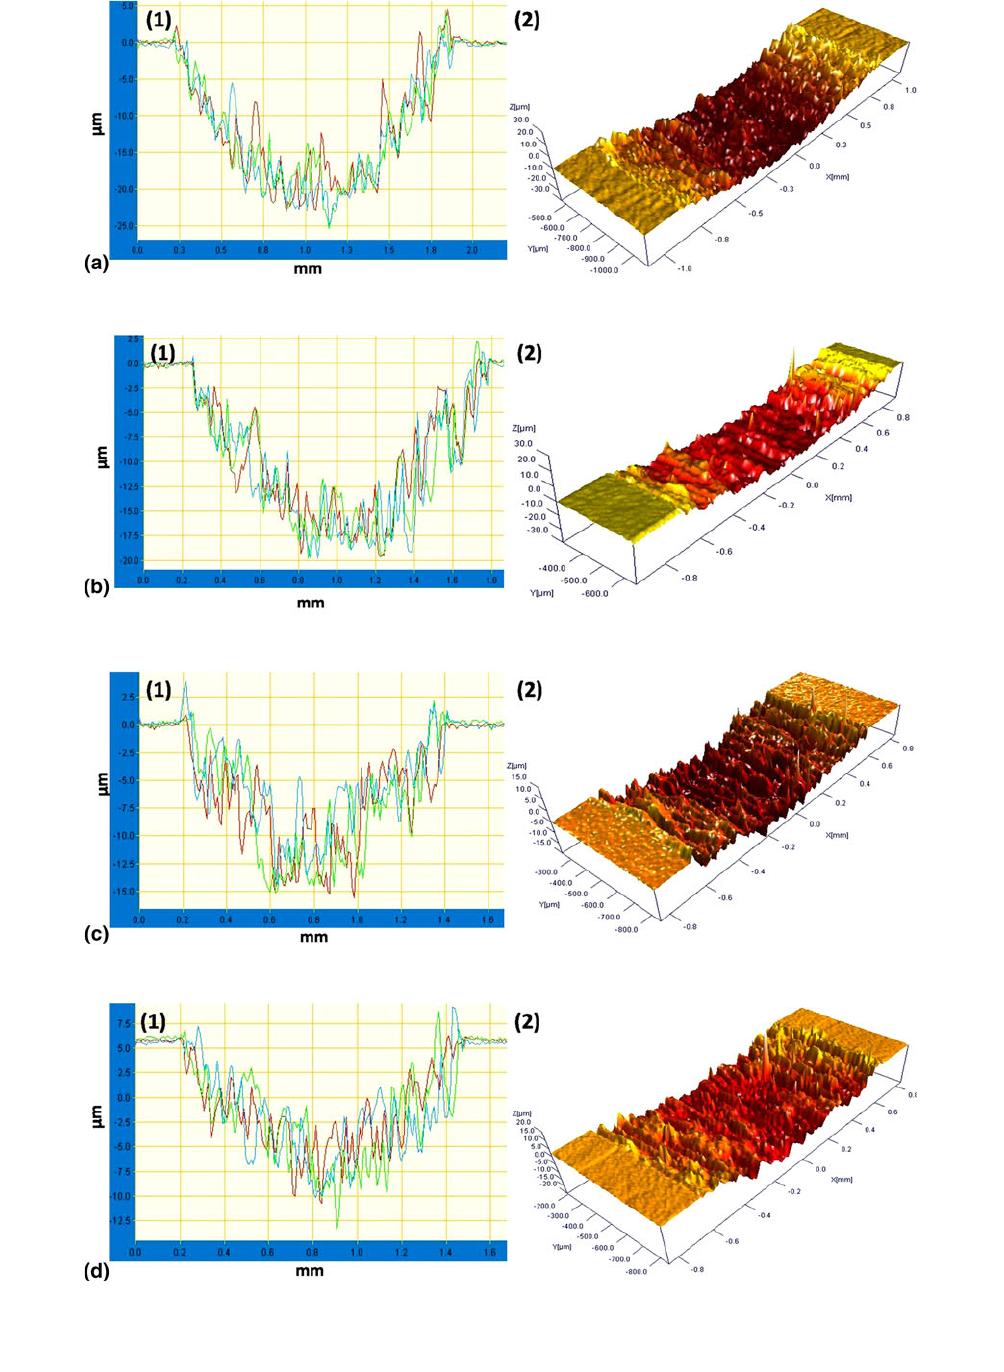
Fig. 11 (1) 2D and (2) 3D profiles of wear tracks at 5N load at high resolution on (a) substrate and samples nitrided at 800 C for 4 h,
(b) 100% N, (c) 80% N-20% H, and (d) 80% N-20% Ar
Journal of Materials Engineering and Performance Volume 22(9) September 2013—2631
hydrogen, improves the wear behavior of the titanium
alloy Ti-15-3 by reducing the COF and decreasing the wear
loss.
The above results on nitrided titanium alloy Ti-15-3 show that
the alloy has poor nitridability. Even though the beta transus
temperature of the alloy is low, i.e., 750-770 C, the alloy has to
be heated to temperatures >800 C for effective nitriding to take
place. This implies that irrespective of beta transus temperatures,
titanium alloys have to be heated to temperatures greater than
800 C for effective nitriding. Hydrogen dilution helps in
increasing the nitrogen intake as can be seen from the hardness
data and EDS results. It is known that hydrogen removes the
surface oxide by etching and also increases ionization of nitrogen
in the plasma. The removal of the oxide barrier and the
availability of more nitrogen ions and atoms due to increased
ionization increase the intake of nitrogen by the sample. Even
then, the nitriding kinetics is low at temperatures lower than
800 C. With argon dilution, the sample surface is sputtered
during the nitriding process, and also the partial pressure of
nitrogen is lowered. While sputtering removes the oxide as well
as nitrided layers, the reduced nitrogen partial pressure decreases
the intake of nitrogen and helps in controlling the composition of
nitrided layer. Analyses of the nitrided layers by EDS, micro
Raman, and XPS show that intake of nitrogen is lower at
temperatures lowers than 800 C. The lower intake of nitrogen
leads to the formation of a phase and predominantly Ti
2
N
formation, as seen in XRD. Depth profiling of the nitrided layers
by XPS shows that diffusion of nitrogen into the interior of the
sample is low. All these factors determine the hardness, the
hardness profile, and the wear behavior of the nitrided samples as
discussed above.
4. Conclusions
Beta titanium alloy, Ti-15V-3Cr-3Al-3Sn (Ti-15-3) was
plasma nitrided in low-pressure RF plasma using nitrogen
and nitrogen diluted with hydrogen and argon at tempera-
tures less than and greater than the beta transus temperature
of the material. The results show that effective nitriding of
the alloy can occur only at temperatures higher than the beta
transus temperature, and even then the intake of nitrogen is
low. XRD shows the formation of alpha phase, and
predominantly, Ti
2
N. Micro Raman spectra, EDS, and XPS
show that nitrogen concentration in the nitrided layer is low.
Depth profiling by XPS shows that nitrogen profile in the
material is shallow. This is reflected in the hardness and its
profile in the nitrided layers. Wear studies show a low COF
and lower wear loss for plasma-nitrided samples, especially
with hydrogen dilution.
Acknowledgments
The study was carried under the 11th five-year plan projects on
enhancement of knowledge base in aerospace materials project
SIP-SED-05 funded by CSIR-NAL. The authors would like to
thank Director, NAL for permission to publish this research; and
Head, SED for constant encouragement. The authors would like
to thank Mr. Siju, Mr. NT. Manikandanath, Mr. Praveen, and
Mr. Muniprakash for various characterizations.
References
1. R. Boyer, G. Welsch, and E.W. Collings, Materials Properties
Handbook: Titanium Alloys, ASM International, Materials Park, 2003
2. C. Leyens and M. Peters, Titanium and Titanium Alloys: Fundamentals
and Applications, Wiley-VCH, Germany, 2003
3. K.G. Budinski, Tribological Properties of Titanium Alloys, Wear,
1992, 151, p 203–217
4. S.M. Johns, T. Bell, M. Samandi, and G.A. Collins, Wear Resistance of
Plasma Immersion Ion Implanted Ti6A14V, Surf. Coat. Technol., 1996,
85, p 7–14
5. H. Dong and T. Bell, Designer Surfaces for Titanium Components, Ind.
Lubr. Tribol., 1998, 50(6), p 282–289
6. H. Dong and T. Bell, Ti-2003 Science and Technology, Proceedings of
the 10th World Conference on Titanium: Volume-II, G. Lutjering and
J. Albrecht, Eds., Wiley-VCH, Germany, 2004
7. X. Liu, P.K. Chu, and C. Ding, Surface Modification of Titanium,
Titanium Alloys, and Related Materials for Biomedical Applications,
Mater. Sci. Eng. R, 2004, 47, p 49–121
8. X. Qiu, J.R. Conrad, R.A. Dodd, and F.J. Worzala, Plasma Source
Nitrogen Ion Implantation of Ti-6Al-4V, Metall. Trans. A, 1990, 21A,
p 1663–1667
9. B.Y. Tang, P.K. Chu, S.Y. Wang, K.W. Chow, and X.F. Wang, Methane
and Nitrogen Plasma Immersion Ion Implantation of Titanium Metal,
Surf. Coat. Technol., 1998, 103-104, p 248–251
10. S.Y. Wang, P.K. Chu, B.Y. Tang, X.C. Zeng, Y.B. Chen, and X.F.
Wang, Radio Frequency Plasma Nitriding and Nitrogen Plasma
Immersion Ion Implantation of Ti6Al4V, Surf. Coat. Technol., 1997,
93, p 309–313
11. E.S. Metin and O.T. Inal, Microstructure and Microhardness Evalua-
tions in Ion Nitrided Titanium, Mater. Sci. Eng. A, 1991, 145, p 65–77
12. C. Lugmair, R. Kullmer, A. Gebeshuber, C. Mitterer, M. Stoiber, H.
Patrovsky, and M. Adley, Ti-2003 Science and Technology, Proceed-
ings of the 10
th
world conference on Titanium: Volume-II, G. Lutjering
and J. Albrecht, Eds., Wiley-VCH, Germany, 2004
13. U. Huchel and S. Stramke, Ti-2003 Science and Technology, Proceed-
ings of the 10th world conference on Titanium: Volume-II, G. Lutjering
and J. Albrecht, Eds., Wiley-VCH, Germany, 2004
14. K.N. Strafford and J.M. Towell, The Interaction of Titanium and
Titanium Alloys with Nitrogen at Elevated Temperatures. I. The
Kinetics and Mechanism of the Titanium-Nitrogen Reaction, Oxid.
Met., 1976, 10, p 41–67
15. K.N. Strafford and J.M. Towell, The Interaction of Titanium and
Titanium Alloys with Nitrogen at Elevated Temperatures. II. The
Nitridation Behaviour of Alloys Containing 5 wt.% Percent of
Aluminium and Chromium, Oxid. Met., 1976, 10, p 69–84
16. E. Metin and O.T. Inal, Kinetics of Layer Growth and Multiphase
Diffusion in Ion Nitrided Titanium, Metall. Trans. A, 1989, 20A,
p 1819–1832
17. N.R. McDonald and G.R. Wallwork, The Reaction of Nitrogen with
Titanium Between 800 and 1200C, Oxid. Met., 1970, 2-3, p 263–
283
18. A. Zhecheva, W. Sha, S. Malinov, and A. Long, Enhancing the
Microstructure and Properties of Titanium Alloys Through Nitriding
and Other Surface Engineering Methods, Surf. Coat. Technol., 2005,
200, p 2192–2220
19. A. Zhecheva, S. Malinov, and W. Sha, Titanium Alloys After Surface
Gas Nitriding, Surf. Coat. Technol., 2006, 201, p 247–2467
20. W. Sha and S. Malinov, Titanium Alloys: Modelling of Microstructure,
Properties and Applications, Woodhead Publishing Ltd., Cambridge,
2009
21. Prateek Kumar, P. Dilli Babu, L. Mohan, C. Anandan, and V.K.
William Grips, Wear and Corrosion Behavior of Zr-Doped DLC on
Ti-13Zr-13Nb Biomedical Alloy, J. Mater. Eng. Perform., 2012, doi:
10.1007/s11665-012-0230-3
22. S.L.R. da Silva, L.O. Kerber, L. Amaral, and C.A. dos Santos, X-Ray
Diffraction Measurements of Plasma Nitrided Ti6Al4V, Surf. Coat.
Technol., 1999, 116-119, p 342–346
23. F.M. El-Hossary, N.Z. Negm, S.M. Khalil, and M. Raaif, Surface
Modification of Titanium by Radio Frequency Plasma Nitriding, Thin
Solid films, 2006, 497, p 196–202
24. M.A.Z. Vasconcellos, R. Hinrichs, C.S. Javorsky, G. Giuriatti, and
J.A.T. Borges da Costa, Micro-Raman Characterization of Plasma
Nitrided Ti6Al4V-ELI, Surf. Coat. Technol., 2007, 202, p 275–279
2632—Volume 22(9) September 2013 Journal of Materials Engineering and Performance
