Vol.:(0123456789)
International Journal of Thermophysics (2020) 41:139
https://doi.org/10.1007/s10765-020-02709-5
1 3
Density ofLiquid Iridium andRhenium fromMelting
uptotheCritical Point
M.Leitner
1
· G.Pottlacher
1
Received: 18 June 2020 / Accepted: 7 July 2020
© The Author(s) 2020
Abstract
The density as a function of temperature was determined for liquid iridium (Ir) and
rhenium (Re) by means of shadow imaging in ohmic pulse-heating experiments.
In addition to regular experiments at
0.23 MPa
, high-pressure experiments at static
pressures between
0.18 GPa
to
0.30 GPa
were performed to increase the metals’ boil-
ing point and thus determine density data at temperatures far exceeding the boiling
temperature at atmospheric pressure. By this means, the experimentally accessible
liquid range could be extended by roughly
2000 K
(Ir) and
6000 K
(Re) compared to
data reported in the literature. In a second step, the experimental data were used to
estimate critical temperature, critical density, and the complete phase diagram in the
density–temperature plane. A comprehensive comparison with literature data was
conducted.
Keywords Critical point data· High pressure· Iridium· Liquid metals· Liquid-
phase density· Phase diagram· Pulse-heating· Rhenium
1 Introduction
The density of liquid metals and alloys is of high interest in many fields of engi-
neering and science. Density data are for instance used to calculate mass balance in
refining operations or to deduce further thermophysical properties such as thermal
conductivity and diffusivity, viscosity, or surface tension. Most importantly, density
data are used in various simulations that model physical processes, such as ther-
mal natural convection in furnaces and ladles or casting and solidification [1–3].
Many of these physical models show a relatively strong sensitivity on density input
* G. Pottlacher
M. Leitner
1
Institute ofExperimental Physics, Graz University ofTechnology, NAWI Graz, Petersgasse 16,
Graz8010, Austria

International Journal of Thermophysics (2020) 41:139
1 3
139 Page 2 of 17
data compared to other thermophysical properties applied during the modeling pro-
cess [4]. Therefore, precise data on density as a function of temperature in the liq-
uid phase are needed. While the density is mostly well known throughout the solid
phase, the situation is different in the liquid phase, where data are scarce for some
transition metals. Furthermore, data reported in the literature are often inconsistent
with each other, do not reach far into the liquid phase, or exhibit large uncertain-
ties. These observations motivate a complementary revisit on the liquid-phase den-
sity of selected metals, such as iridium and rhenium. While typical pulse-heating
experiments performed previously at Graz University of Technology addressed a
multitude of thermophysical properties simultaneously, Schmon suggested to con-
duct exclusive density measurements in combination with other measures in order to
improve density data quality [5]. Metals and alloys already addressed in this exclu-
sive approach are Ni and Cu [6],
Cu
86
Mn
12
Ni
2
[7],
TiAl
6
V
4
[5], Al [8], Ta [9], Nb
and W [10],
Cr
18
Ni
12
Mo
2
(NIST SRM 316L) [11] and now Ir and Re. For the latter
six examples, the experimental setup was recently further improved in terms of bet-
ter signal-to-noise ratio, faster image acquisition rate, and reduced camera exposure
times [12].
The experimentally obtained liquid-phase density as a function of temperature
can be used to estimate the metal’s full phase diagram, i.e., how the density of the
liquid and gaseous metal changes with temperature up to the critical point. This
unique point in the phase diagram, where liquid and vapor saturation lines meet and
all properties of the coexisting phases are equal to each other, is not only of scientific
interest but is also important in high temperature technologies, such as in aerospace
and in power engineering. In the latter, critical point data are applied in potential fis-
sion-reactor accident calculations and are used for future fusion reactor designs [13].
Besides, phase diagrams and critical points are of immediate interest in astro- and
planetary physics, where modelers rely on data describing the response of metals at
extreme temperatures and pressures [14]. The approach used in this work follows a
recent publication of Schröer and Pottlacher, where the measured liquid-phase den-
sity is extrapolated according to simplified non-linear models yielding estimates for
the phase diagram and the critical point [15]. This extrapolative approach is limited
by the metal’s boiling point, which poses a natural upper temperature limit for the
input data. Therefore, efforts were taken to increase the boiling point by performing
high-pressure pulse-heating experiments in addition to those performed at almost
ambient pressure.
1
Opposed to the boiling temperature, the melting temperature
of metals shows only a very weak pressure dependence. Thus, the liquid phase is
greatly extended and provides a richer basis for the extrapolative estimation of the
investigated metal’s phase diagram and critical point.
1
The latter will be referred to as low-pressure experiments in the following.

1 3
International Journal of Thermophysics (2020) 41:139
Page 3 of 17 139
2 Experimental Method
The method of ohmic pulse-heating was applied to resistively heat Ir and Re
sample wires with
0.5 mm
in diameter and an approximate length of
40 mm
from
room temperature (
295 K
) up to their boiling point. At this point, the sample
explodes due to the large discontinuous jump in volume and gives the method its
popular name exploding wire technique. Energy for the heating process is pro-
vided by a
540 μF
capacitor bank that can be charged to a voltage between 3kV to
10kV. Once the experiment is started, a current that can peak in more than 10kA
runs through the wire sample and rapidly heats it with heating rates on the order
of
10
8
K ⋅ s
−1
. These high heating rates lead to a very short experimental duration
of typically
35 μs
to
80 μs
, depending on the specimen and experimental parame-
ters used, and offer several advantages: First, the method can be considered quasi-
containerless, i.e., chemical reactions with the surrounding atmosphere may be
neglected. Second, the wire sample remains unaffected by gravity which allows
the experimenter to perform measurements in the liquid phase as the wire speci-
men does not collapse upon melting. Third, high heating rates additionally sup-
press an axial expansion of the wire specimen. As the experiment can be con-
sidered quasi-static, which implies an increased radial expansion to compensate
for the absent axial expansion, it is sufficient to monitor the radial expansion
throughout the experiment to derive the sample’s volume expansion as a func-
tion of time. For this purpose, a specialized CCD-camera system was used (PCO
imaging, controller unit by Theta System and Graz Univ. of Technol.) in com-
bination with a high-power photo flash (Multiblitz X10AC/DC,
1000 W ⋅ s
) that
allows an image acquisition rate of
4 × 10
5
fps
, i.e., approximately one shadow
image every
2.5 μs
at an exposure time of
300 ns
. Each shadow image has a reso-
lution of
(8 × 384) pixel
. For further details on the expansion measurement setup,
the reader is referred to [5, 12].
In addition to the measurement of thermal radial expansion, the sample’s sur-
face radiance is monitored throughout the experiment by means of pyrometry to
derive the sample temperature as a function of time. The pyrometer used operates
at a central wavelength of
649.7 nm
(FWHM =
37.2 nm
, sampling rate:
10 MHz
).
Neutral density filters are applied to cover a broad temperature range.
To physically extend the accessible temperature range by raising the sample’s
boiling point, low-pressure pulse-heating experiments at
0.23 MPa
were com-
plemented by high-pressure pulse-heating experiments at
0.18 GPa
to
0.30 GPa
.
While the low-pressure experiments were conducted in nitrogen (Alphagaz 1
N
2
,
99.999 %
), distilled water was used in high-pressure experiments to build up
pressure. A detailed description of the setups may be found in [12, 16]. Note,
that the high static pressure has negligible impact on density measurement due
to the very small compressibility of these metals of
𝜅
T,Ir
= 0.0082 GPa
−1
and
𝜅
T,Re
= 0.0092 GPa
−1
[17]. Therefore, density data obtained on different isobars
in the kbar-regime are typically indistinguishable for most metals, compare also
[13].

International Journal of Thermophysics (2020) 41:139
1 3
139 Page 4 of 17
All sample wires were treated with abrasive paper (grade 1200) and cleaned
with acetone prior to the experiment. Reported data for Ir consist of nine inde-
pendent experiments (six low-pressure and three high-pressure experiments),
those of Re are composed of seven independent experiments (four low-pressure
and three high-pressure experiments). Table1 lists the specifications of the wire
samples used.
3 Data Evaluation
Thermal expansion and surface radiance of the sample are both measured as a func-
tion of time. These quantities are evaluated as described in the following by using
literature data for melting temperature, normal spectral emissivity, and room-tem-
perature density, as specified in Table2. From the resulting density as a function
of temperature, a phase diagram and the critical point can be estimated. In-depth
details on the data evaluation as well as an exemplary thermogramme and expansion
sequence have been published recently [9, 12]. Therefore, the authors focus only on
the most important details here.
3.1 Temperature
The temperature evaluation is based on Planck’s law of radiation. In a first step, the
radiance temperature at melting is calculated using the known melting temperature
T
m
and the normal spectral emissivity at melting
𝜀
m
, compare Table2. This tempera-
ture is then assigned to the melting-plateau that is visible in the radiance-over-time
development to derive a radiance temperature
T
r
(t)
as a function of time t. The radi-
ance temperature as a function of time is then used in conjunction with normal spec-
tral emissivity
𝜀(𝜆, T
r
)
to calculate the true temperature T(t) as a function of time t
Table 1 Specifications of investigated wire specimens
Purity/wt
%
Diameter/mm Condition Supplier Catalog no. ID no.
Ir 99.9 0.5 Temper annealed Advent IR524809 Gi2147
Re 99.99 0.5 Temper annealed Advent RE545909 Gi4101
Table 2 Utilized literature data for temperature deduction and density conversion of the metals iridium
and rhenium
Normal spectral emissivity
𝜀(𝜆, T
r
)
at a wavelength of
684.5 nm
as a function of radiance temperature
T
r
,
true melting temperature
T
m
and room-temperature density
𝜌
0
Metal
𝜀(684.5 nm, T
r
)∕1
Validity range/K
T
m
∕K
𝜌
0
∕kg
⋅
m
−3
Ir
0.3293 +
7.988
×
10
−6
T
r
∕K
[18]
2365
<
T
r
<
3650
2719 [19] 22562 [20]
Re
0.3130 −
8.5186
×
10
−
6
T
r
∕K
[21]
2870
<
T
r
<
4100
3458 [22] 21020 [23]

1 3
International Journal of Thermophysics (2020) 41:139
Page 5 of 17 139
according to Eq.1, where
𝜆
is the mean effective wavelength of the pyrometer and
c
2
is the second radiation constant,
Note that applying a gray-body assumption, the slight shift of approximately
30 nm
between pyrometer wavelength and the wavelength at which emissivity data are
reported can be neglected. The reported normal spectral emissivity was further
assumed to continue linearly above the stated temperature validity range. A more
detailed description of the evaluation procedure was already published elsewhere [9,
12].
3.2 Density
The acquired shadow images of the thermally expanding vertical wire are processed
by summation over the pixel lines. The resulting intensity values as a function of
x-pixel position show a clear cup-shaped intensity profile, compare [9]. The FWHM
of each of these profiles at specific instants in time t is used as diameters d(T) at
the corresponding temperatures T. These values are related to the room-temperature
pixel-diameter
d
0
that is captured before the pulse-heating start. Due to the suppres-
sion of axial wire expansion, and the quasi-static behavior of the method, the wire’s
volume expansion
(
V
(
T
)∕
V
0
)
may be simply described by the square of the radial
expansion
(
d
(
T
)∕
d
0
)
2
[24, 25]. The conversion to density as a function of tempera-
ture
𝜌(T)
is achieved in relating this measured thermal radial expansion to the room-
temperature density
𝜌
0
,
3.3 Critical Point andPhase Diagram Data
On the basis of experimentally obtained liquid-phase density data, the material’s
phase diagram in the temperature–density plane and its critical temperature and den-
sity are estimated. The algorithm used follows a recent publication by Schröer and
Pottlacher [15]. For a complementary detailed step-by-step description, the reader
is also referred to [12]. The core of the algorithm is a non-linear extrapolation of
the experimentally obtained density–temperature behavior according to simplified
models. The approach uses a heuristic crossover from Ising to mean-field behavior
to estimate the critical temperature
T
c
and uses a combination of the rule of rectilin-
ear diameter and the theory of complete scaling to estimate the critical density
𝜌
c
. In
particular, the arithmetic mean between the critical temperature estimates obtained
from an Ising-like extrapolation (exponent
𝛽 = 1∕3
) and from a mean-field-like
(1)
T
(t)=
c
2
𝜆 ⋅ ln
{
𝜀(𝜆, T
r
) ⋅
[
exp
(
c
2
𝜆⋅T
r
(
t
)
)
− 1
]
+ 1
}
.
(2)
𝜌
(T)=𝜌
0
⋅
(
d
0
d
(
T
)
)
2
.

International Journal of Thermophysics (2020) 41:139
1 3
139 Page 6 of 17
extrapolation (exponent
𝛽 = 1∕2
) serves as a reasonable estimate for
T
c
. Similarly,
the arithmetic mean between critical density obtained assuming a linear phase dia-
gram diameter variation (exponent
𝛾 = 1
) and a non-linear diameter variation (expo-
nent
𝛾 = 2∕3
) is reported as reasonable estimate for
𝜌
c
. With
T
c
and
𝜌
c
fixed, a sim-
plified phase diagram is then constructed according to Eq.3,
where
𝜌
+
(T)
and
𝜌
−
(T)
describe the saturated liquid and saturated vapor line, i.e.,
how liquid and vapor density change as a function of temperature up to the critical
point.
𝜌
diam
(T)
describes the phase diagram diameter which is the average between
saturated liquid and saturated vapor density, modeled by
The phase diagram coefficients a, c, b and
b
2
in Eqs.3 and 4 are obtained during fit-
ting this phase diagram model to the experimentally obtained density data.
4 Results andDiscussion
4.1 Density
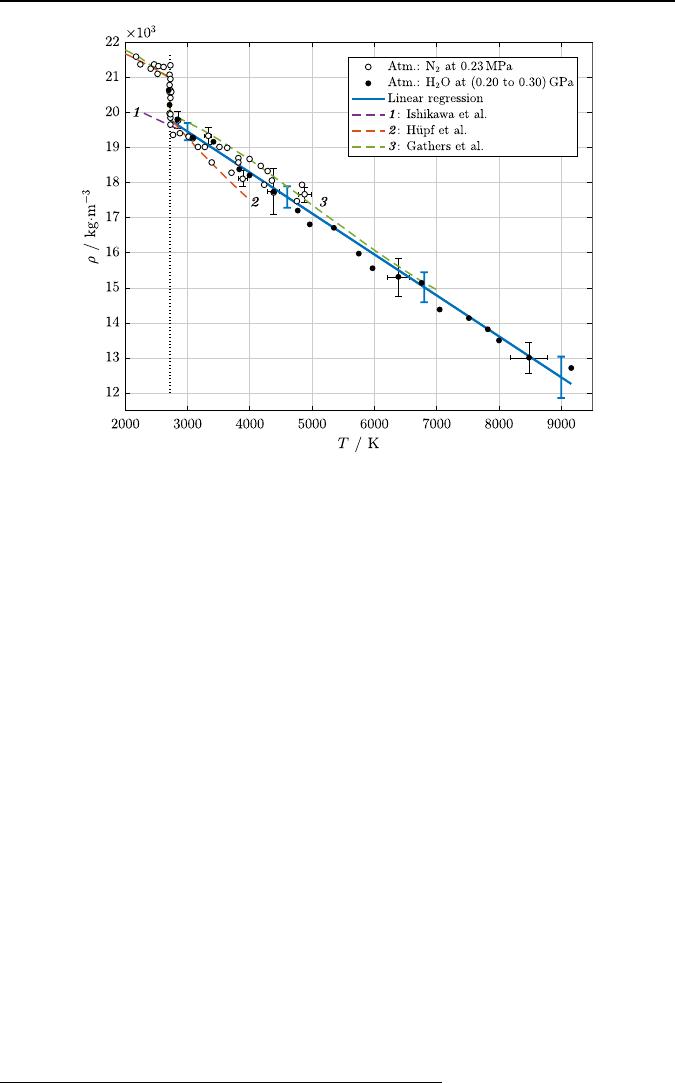
Iridium Density as a function of temperature of iridium is depicted in Fig.1. The
plotted linear regression was calculated combining high-pressure and low-pressure
data sets and considering their individual T and
𝜌
uncertainties. The correspond-
ing fit coefficients are given in Table3. Experimental data points are tabulated in
Table4.
The obtained density as a function of temperature exhibits a very good consist-
ence with the literature at the end of the solid phase and at the beginning of the
liquid phase, where a density of
𝜌
(T
m,l
)=(19.78 ± 0.24)×10
3
kg ⋅ m
−3
ensues from
the combined linear regression. This value is in excellent agreement to all three lit-
erature sources, residing within the stated
k = 2
uncertainty interval.
(3)
𝜌
±
(T)=𝜌
diam
± b ⋅ (T
c
− T)
1
∕
3
(
1 + b
2
⋅ (T
c
− T)
2
∕
3
)
,
(4)
𝜌
diam
(T)=𝜌
c
(
1 + a ⋅ (T
c
− T)+c ⋅ (T
c
− T)
2
∕
3
)
.
Table 3 Fit coefficients a and b for the liquid-phase density
𝜌
as a function of temperature T in the form
𝜌(T)=a − b
⋅
T
The fit was calculated combining the obtained high-pressure and low-pressure data sets. The temperature
range of applicability is given. The relative combined expanded density uncertainty
U
c
(𝜌)
⋅
𝜌
−1
at a fixed
temperature T is given from the beginning of the liquid phase (first value) up to the highest temperature
measured (second value). All uncertainties are reported at a
95 %
confidence level (
k = 2
)
a b
U
c
(𝜌)
⋅
𝜌
−1
Temperature range
10
3
kg
⋅
m
−3
kg
⋅
m
−3
⋅
K
−1
1 K
Ir
22.96 ± 0.20
1.17 ± 0.05
0.012 to 0.049
2719 ≤ T ≤ 9160
Re
21.0 ± 0.4
0.77 ± 0.05
0.021 to 0.065
3485 ≤ T ≤ 11 800
1 3
International Journal of Thermophysics (2020) 41:139
Page 7 of 17 139
Ishikawa etal. [26] report a density value at the liquidus point that is
0.75 %
lower
than this work’s value. The decrease in density with temperature reported by Ishi-
kawa etal. is slightly less pronounced than in this work but in very good agree-
ment. The authors used a levitation method, undercooling a liquid metal droplet in
vacuum. Owing to the undercooling, density data at temperatures below the melting
temperature are to be understood as an extension of the liquid phase.
Previous data reported by our group
2
(Hüpf etal. [27]) are in excellent agree-
ment at the beginning of the liquid phase, being
0.35 %
higher than this work’s data.
However, the extraordinary strong decrease of liquid-phase density with temperature
could not be reproduced. Data reported by Hüpf etal. were acquired with the low-
pressure setup in argon atmosphere.
Gathers etal. [28] report a value at the beginning of the liquid phase that is
0.92 %
higher than this work’s value. The consistence in both solid and liquid phase is
remarkable and resides within or very close to the
95 %
uncertainty interval through-
out the whole reported data range. These data were acquired with a pulse-heating
technique at a pressure of
0.3 GPa
in inert gas atmosphere.
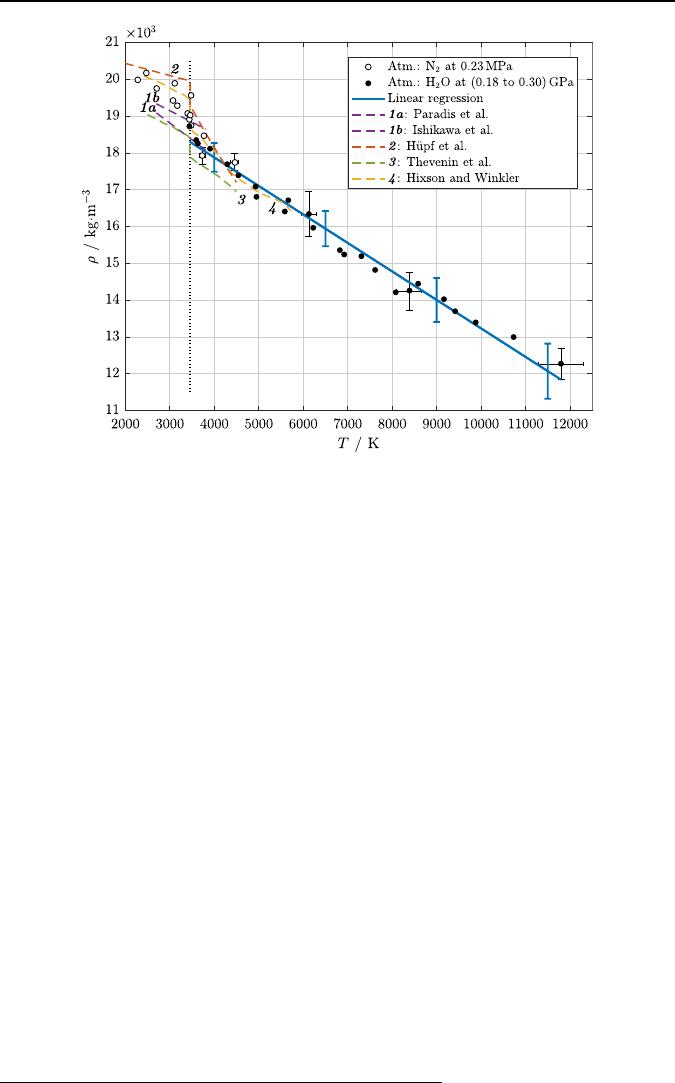
Rhenium Density as a function of temperature of rhenium is depicted in
Fig. 2. The linear regression shown was calculated combining low-pressure and
Fig. 1 Density
𝜌
as a function of temperature T of iridium. The dotted vertical line marks the melting
temperature. Symbols and solid line: This work’s experimental data and corresponding linear regression
of the combined data set. All uncertainties are given at a
95 %
confidence level (
k = 2
). Dashed lines rep-
resent data reported in the literature: Ishikawa etal. [26], Hüpf etal. [27], Gathers etal. [28]
2
Published thermal expansion data were converted into density data with the room-temperature density
stated in Table2.

International Journal of Thermophysics (2020) 41:139
1 3
139 Page 8 of 17
high-pressure data sets and considering their individual T and
𝜌
uncertainties. The
corresponding fit coefficients are given in Table3. Experimental data points are tab-
ulated in Table5.
Only a few valid data points in the liquid phase could be obtained by means of
low-pressure pulse-heating because of evolving inhomogeneities in sample diam-
eter. These inhomogeneities, leading to an apparent increased expansion, render an
evaluation impossible. However, this problem could be suppressed by increasing the
static pressure acting on the sample’s surface in high-pressure experiments.
At the beginning of the liquid phase, the combined data evaluation yields a den-
sity of
𝜌
(T
m,l
)=(18.3 ± 0.4)×10
3
kg ⋅ m
−3
.
This value is in excellent agreement with that reported by Paradis et al. [29],
being only
0.34 %
higher than this work’s value. The concordance of the slope of
liquid density as a function of temperature with this work’s data is in extraordinary
Table 4 Iridium:
Experimentally obtained data
points of density
𝜌
as a function
of temperature T obtained
in low-pressure (atm.:
N
2
at
0.23 MPa
) and high-pressure
pulse-heating experiments (atm.:
H
2
O
at
0.20 GPa
to
0.30 GPa
)
Density values were derived applying a room-temperature den-
sity of
𝜌
0
= 22 562 kg
⋅
m
−3
[20]. Combined expanded uncertainty
between the beginning of the liquid phase (
T
m
=
2719 K
) up to
the highest temperatures measured:
U
c,LP
(T)∕T = 0.016 to 0.022
,
U
c,LP
(𝜌)∕𝜌 = 0.013
and
U
c,HP
(T)∕T = 0.018 to 0.037
,
U
c,HP
(𝜌)∕𝜌 = 0.038 to 0.034
. Uncertainties stated at a
95 %
confi-
dence level (
k = 2
)
LP-data HP-data
T∕K
𝜌∕kg
⋅
m
−3
T∕K
𝜌∕kg
⋅
m
−3
T∕K
𝜌∕kg
⋅
m
−3
2173 21600 3009 19321 2695 20632
2237 21383 3084 19256 2714 20229
2412 21247 3164 19030 2836 19809
2462 21367 3276 19021 3080 19280
2514 21109 3331 19331 3409 19167
2534 21336 3383 18586 3828 18391
2613 21290 3511 19021 3993 18221
2708 21092 3633 18987 4378 17745
2715 19965 3701 18294 4775 17204
2716 20595 3810 18700 4965 16823
2718 20793 3820 18582 5355 16710
2720 19844 3889 18122 5755 15985
2723 19946 4003 18667 5972 15567
2724 20642 4178 18487 6386 15303
2726 21340 4230 17930 6756 15134
2729 19664 4285 18333 7051 14393
2731 20412 4350 18070 7521 14137
2735 20586 4388 17716 7829 13830
2768 19354 4756 17470 7997 13502
2844 19791 4843 17942 8482 13003
2884 19400 4882 17663 9163 12717
1 3
International Journal of Thermophysics (2020) 41:139
Page 9 of 17 139
agreement. However, recently published data by the same working group (Ishikawa
etal. [26]) are
3.1 %
higher than our data at the liquidus point. Data reported by
these authors were acquired by investigating a levitated liquid metal droplet at a
pressure of
10
−5
Pa
in a super-cooled liquid state. Data reported below the melting
temperature are thus an extension of the liquid-phase density to lower temperatures.
Data published previously by our group
3
(Hüpf etal. [30]) show a deviation in
density already at the end of the solid phase. At the beginning of the liquid phase,
the Hüpf value is
5.2 %
higher than this work’s data imply, thus outside the uncer-
tainty boundaries. Especially the decrease in density with temperature reported in
these previous data is questionably strong and inconsistent with this work’s data as
well as with other data reported in the literature. The data were acquired with the
low-pressure setup in argon atmosphere. Given the arising problems observed when
using this very same setup suggests that evolving inhomogeneities in sample diam-
eter may be the reason for the strong density gradient reported previously by Hüpf
etal.
Density data reported by Thévenin etal. [31] are inconsistent with our data
at the end of the solid phase. There, the density is as low as other authors report
at the beginning of the liquid phase. In the liquid phase, the slope of density as
Fig. 2 Density
𝜌
as a function of temperature T of rhenium. The dotted vertical line marks the melting
temperature. Symbols and solid line: This work’s experimental data and corresponding linear regression
of the combined data set. All uncertainties are given at a
95 %
confidence level (
k = 2
). Dashed lines
represent data reported in the literature: Paradis etal. [29], Ishikawa etal. [26], Hüpf etal. [30], Thévenin
etal. [31], Hixson and Winkler [32]
3
Published thermal expansion data were converted into density data with the room-temperature density
stated in Table2.

International Journal of Thermophysics (2020) 41:139
1 3
139 Page 10 of 17
a function of temperature is highly consistent with this work’s data and with
most of the literature data. The value at the beginning of the liquid phase is
2.6 %
lower than this work’s value and thus just outside the
95 %
confidence interval.
These data were acquired with a pulse-heating setup at a pressure of
0.12 GPa
in
an argon atmosphere.
Density data reported by Hixson and Winkler [32] are in very good agree-
ment both at the end of the solid and at the beginning of the liquid phase. At
the beginning of the liquid phase, the reported value is
1.9 %
higher than this
Table 5 Rhenium
Experimentally obtained data
points of density
𝜌
as a function
of temperature T obtained
in low-pressure (atm.:
N
2
at
0.23 MPa
) and high-pressure
pulse-heating experiments (atm.:
H
2
O at
0.20 GPa to 0.30 GPa
)
Density values were derived applying a room-temperature den-
sity of
𝜌
0
= 21 020 kg
⋅
m
−3
[23]. Combined expanded uncertainty
between the beginning of the liquid phase (
T
m
= 3458 K
) up to
the highest temperatures measured:
U
c,LP
(T)∕T = 0.018 to 0.021
,
U
c,LP
(𝜌)∕𝜌 = 0.013
and
U
c,HP
(T)∕T = 0.020 to 0.043
,
U
c,HP
(𝜌)∕𝜌 = 0.039 to 0.036
. Uncertainties stated at a
95 %
confi-
dence level (
k = 2
)
LP-data HP-data
T∕K
𝜌∕kg
⋅
m
−3
T∕K
𝜌∕kg
⋅
m
−3
2284 19985 3444 18727
2478 20176 3595 18354
2698 19744 3630 18256
3065 19432 3899 18104
3117 19879 4299 17690
3164 19274 4552 17379
3401 19080 4935 17097
3449 18916 4947 16803
3468 19026 5584 16413
3473 18748 5656 16710
3477 19558 6128 16333
3728 17931 6234 15957
3773 18471 6828 15361
4460 17748 6915 15251
7308 15186
7616 14822
8079 14212
8382 14252
8580 14443
9173 14031
9409 13695
9887 13405
10738 13004
11801 12265
