
Landslides
DOI 10.1007/s10346-020-01451-1
Received: 26 September 2019
Accepted: 28 May 2020
© Springer-Verlag GmbH Germany
part of Springer Nature 2020
Zhichen Song I Xiang Li I José J. Lizárraga I Lianheng Zhao I Giuseppe Buscarnera
Spatially distributed landslide triggering analyses
accounting for coupled infiltration and volume change
Abstract Rainfall infiltration in unsaturated slopes alters the effective
stress through pore water pressure changes, thus causing ground defor-
mation. Although important to assess the timescale over which the
margin of safety of a slope decreases, such coupled processes are rarely
accounted in the context of spatially distributed hazard assessment
procedures. In this paper, a physically based, spatially distributed model
accounting for full hydro-mechanical coupling is discussed. The model
relies on a vectorized finite element (FE) solver to calculate the stability
of deformable unsaturated infinite slopes subjected to transient flow .
First, the FE solver is used to study the response of individual slopes to a
prolonged rainfall for three scenarios (i.e., rigid, swelling, and collapsible
soil). Then, the model is used in the context of spatially distributed
computations to assess spatiotemporal variations of factor of safety over
a large area. For this purpose, a series of shallow landslides occurred in a
mountainous landscape covered by collapsible loess deposits in north-
western China was used as test site. The analyses show that hydro-
mechanical couplings affect the performance of the model in terms of
computed failure time and areal extent of the unstable zones. Specifi-
cally , volume collapse due to suction decrease is found to reduce the
time of failure compared with uncoupled computations obtained for a
rigid soil scenario. The most substantial advantages of using coupled
analyses have been reported with reference to gentle slopes, for which
the higher rate of suction reduction driven by volume change was crucial
to capture landslide source areas that would otherwise be overlooked by
uncoupled analyses. The proposed methodology offers a complete tool
for landslide hazard assessment, in that it incorporates sources of
coupling between hydrology and mechanics that are crucial to replicate
the physics of landslide initiation.
Keywords Hydro-mechanical coupling
.
Infiltration
.
Spatially
distributed analysis
.
Unsaturated soils
.
Collapse
Introduction
Rainfall-induced landslides are among the most widespread and
frequent hazards around the world (Petley 2012). Water infiltration
is indeed a well-known source of soil strength deterioration, either
by increasing pore water pressure (hence reducing the frictional
resistance) or by changing the soil rheology through enhanced
deformability and wetting-induced volume change (Alonso et al.
1990; Rahardjo and Fredlund 1995; Mihalache and Buscarnera
2016). Specifically, as water infiltrates in an unsaturated soil, suc-
tion and degree of saturation vary, eventually giving rise to alter-
ations of the stresses acting on the skeleton and volume changes.
At the same time, changes in the state of saturation controlled by
the volume change response may affect the hydraulic characteris-
tics of the soils, thus influencing the timescale of the infiltration
process and the rate at which deformation and failure may occur
(Wu and Zhang 2009; Garcia et al. 2011; Kim et al. 2016a, b). It is
therefore apparent that, under the most general circumstances,
water infiltration and soil are coupled, in that they affect each
other and determine the hydro-mechanical response of natural
unsaturated soil slopes (Zhang et al. 2005).
Several approaches have been used to evaluate rainfall-induced
landslide hazards at regional scale, such as empirical rainfall threshold
methods (Ti ranti and Rabuffetti 2010;Godtetal.2006; Brunetti et al.
2010;Salciarinietal.2012;DeVitaetal.2013) or statistical and proba-
bilistic methods based on historical records (Ohlmacher and Davis John
2003;Coeetal.2004). Over the last decades, a growing number of
physically based regional models for the assessment of rainfall-induced
landslide susceptibility have also been proposed (Montgomery and
Dietrich 1994;Iverson2000; Salciarini et al. 2008;Baumetal.2010;
Lepore et al. 2012;Parketal.2013;Suetal.2015;Buietal.2017;Zhaoetal.
2019). The recent improvement of the computing performance and the
development of increasingly accessible geographical information system
(GIS) platforms and remote-sensing technology have further contribut-
ed to the widespread use of such physically based models, by making
them increasingly more powerful and reliable for regional-scale land-
slide forecasting. A crucial characteristic of such class of landslide
assessment tools is the simulation of subsurface hydrologic processes
in light of well-defined balance equations and constitutive relations.
Although such models proved useful in several geological settings, they
often recur to simplified descriptions of the soil behavior by neglecting
the deformability prior to failure or hypothesizing frictional slip as the
only mechanism originating instability . However, recent studies on the
mechanics of shallow landslides have shown that volume changes prior
tofrictionalfailureplayacrucialroleforthetriggeringofshallow
landslide in so-called collapsible soil, i.e., deposits which may experience
volume loss upon water infiltration (Buscarnera and Prisco 2012;
Buscarnera and Di Prisco 2013; Lizárraga et al. 2017). Such studies
suggest that neglecting the coupling between water intake and soil
rheology may lead to inaccurate assessments of the rate and magnitude
of the deterioration of the margin of safety during a storm, thus
potentially rendering the analysis unconservative.
The purpose of this paper is to take into account the coupling
between fluid flow and deformation throughout the course of a rain-
storm, thus acknowledging the role of volume changes on the transients
that control the variation of pore pressure within a slope. In standard
uncoupled models, a seepage analysis is used to predict pore water
pressures within a given time, eventually using them as input in stability
calculations (Cai and Ugai 2004;YooandJung2006). In such analyses,
the soil is essentially assumed rigid, in that no soil property enters into
the mass balance equations used to compute pore pressure transients.
Abundant field and laboratory evidence, however, suggests that the
hypothesis of rigid soil during infiltration may be overly restrictive.
For example, T abarsa et al. (2018) conducted a series of collapse poten-
tial tests on loess samples taken from a site susceptible to landslides,
showing a significant risk for wetting-induced collapse. Along the same
lines, Schulz et al. (2018) found a considerable role of swelling in the
dynamics of slow-moving landslides in clay soils subjected to seasonal
rainfall infiltration. In all these cases, it is arguable that the infiltration
processes responsible for the strength deterioration that eventually led
to ground failure took place within deformable soil slopes, thus being
influenced by coupled fluid flow-deformation processes. The impor-
tance of hydro-mechanical couplings has been extensively documented
Landslides
Original Paper

in the context of individual slopes, for which the simultaneous solution
of water mass and momentum balance equations leads to a better
representation of the triggering process (Oh and Lu 2015;Yangetal.
2017;Huetal.2018;Sogaetal.2016). By contrast, no attempts have been
made to explore the impact of hydro-mechanical couplings at the
regional scale, where a more accurate description of pore pressure
transients across a site may lead to substantial improvements of the
landslide susceptibility computations (Lizárraga et al. 2017; Lizárraga
and Buscarnera 2018).
For this purpose, in this paper a physically based model enabling for
coupled hydro-mechanical computations is presented. The model re-
lies on a vectorized finite element (FE) algorithm that combines stabil-
ity analyses for infinite slopes with a transient, one-dimensional
numerical solution of the hydrologic response of layers made of rigid,
swelling, or collapsible soil. For this purpose, a brief description of the
numerical model, as well as of the implementation procedures, is
presented first. Afterwards, the model performance is illustrated with
reference to individual slope units, with the purpose to elucidate
differences between coupled and uncoupled scenarios. Finally , the
model has been tested at the regional scale by using as a reference test
site a series of shallow landslides that took place in northwestern China
across a landscape covered by collapsible loess.
Model description
Equilibrium conditions
For an infinite slope as shown in Fig. 1, the balance of lin ear
momentum for an incremental loading process is given by:
∂
˙
σ
z
∂z
þ
˙
γ
s
cosα ¼ 0;
∂
˙
τ
∂z
−
˙
γ
s
sinα ¼ 0 ð1Þ
where α is the slope angle, h the soil thickness, σ
z
the total normal
stress, τ the shear stress, z is the direction normal to the slope, γ
s
the unit weight of the soil, and the upper dot denotes a time
derivative. The constitutive relationships for the soil skeleton are
hypothesized to be governed by the constitutive stress σ′ (Sheng
et al. 2003), which here will be used in a linear elastic context, as
follows:
σ ¼ σ
0
þ χ
k
s ð2Þ
where s is the matric suction and χ
k
is the coefficient that quan-
tifies the effects of suction on the constitutive stress. This stress
formulation is versatile enough to encompass both effective stress
theories (e.g., Khalili and Khabbaz 1998; Lu and Likos 2006) and
approaches based on dual independent variables (Rahardjo and
Fredlund 1995; Alonso et al. 1990 ). For convenience, hereafter the
latter approach will be followed, thus assuming χ
k
= 0. This choice
gives flexibility to incorporate either swelling or collapse into the
flu id flow equations by following the pseudo-elas tic approach
proposed by Lloret et al. (1987). At this reference, it must be noted
that the stress expression in (2) can in principle be used also in
other contexts, and may thus be used in future extensions of the
methodology proposed here. An example is the case of constitutive
laws modeling volume collapse as a plastic phenomenon, either in
the context of effective stress formulations or through double
variable approaches (Buscarnera 2014).
Hydro-mechanical coupling governing equation
Based on water mass balance and Darcy’s law, the governing
equations for 1D hydro-mechanical coupling in unsaturated soils
can be given by (Richards 1931):
n
∂S
r
h
˙
h þ S
r
B
˙
ε ¼ K∇
2
h þ
∂K
∂z
cosα ð3Þ
where h is the water pressure head, ε the normal strain, n the
porosity, S
r
the degree of saturation, B the Biot’s coupling coeffi-
cient, and K the hydraulic conductivity.
The 1D stress -strain relationship associated with the normal
strain can be expressed in increme ntal form as follows (Lloret
et al. 1987):
∂ε
∂t
¼
1
E
∂σ
∂t
þ
1
F
∂s
∂t
ð4Þ
where σ isthenormalnetstress,whileE and F are the elastic
moduli of the soil with respect to changes in the net stresses
and soil suction, respectively. F is negative for collapsible soils,
while is positive for swelling soils. Hereafter, the infilt ration
process is assumed to take place under fixed geometry and
mechanical boundary conditions, thus implying constant total
normal stress. As a result, changes in constitutive stress state
within the unsaturated slope are uniquely related to pore water
pressure (i.e., suction) variation. Under these hypotheses, Eq.
(4) reduces to:
∂ε
∂t
¼
1
F
∂s
∂t
ð5Þ
The mechanical constitutive relations are completed by the
expression linking shear strain and stress, which in a linear elastic
context is given by:
∂γ
∂t
¼
1
G
∂τ
∂t
ð6Þ
where G is the elastic shear modulus.
Based on Eq. (5), combining Eqs. (1) and (3), the system of
coupled partial differential equations (PDEs) can be recast as
follows:
∂
∂y
E
˙
ε
þ
∂
∂y
E
F
˙
s
þ
˙
γ
s
cosα ¼ 0
∂
∂y
G
˙
γ
−
˙
γ
s
sinα ¼ 0
n
∂S
r
h
˙
h þ S
r
B
1
F
∂s
∂t
¼ K∇
2
h þ
∂K
∂z
cosα
ð7Þ
Original Paper
Landslides

Additionally, suitable constitutive relations for the hydraulic
variables have to be defined, by specifying a water retention
curve ( WRC) and a hydraulic conductivity funct ion (HCF).
Hereafter, the Gardner model i s used for both the WRC and
HCF, as follows:
θ hðÞ¼θ
r
þ θ
s
−θ
r
ðÞexp −ahðÞ ð8Þ
KhðÞ¼K
s
exp −ahðÞ ð9Þ
where θ is the volumetric water content; θ
r
and θ
s
are the
residual and saturated volumetric water content, respectively;
K
s
is the hydraulic conductivity at sat urated condition; and a
is a material consta nt that controls the suction sensit ivity of
both hydraulic conductivity and moisture content. Finally, the
initial bounda ry-value problem (IBVP) can be solved by i n-
corporating appropriate initial and b oundary conditions.
Factor of safety
In order to assess stability conditions for an unsaturated slope, the
factor of safety (FS) has to be defined. Although multiple FS
expressions are in principle available, here the following expres-
sion valid for frictional failure will be used (Lizárraga et al. 2017):
FS ¼
tanφ
0
tanα
1 þ
ks
σ
net
ð10Þ
where φ′ and α are friction angle of soil layer and slope angle,
respectively; σ
net
is the net stress and k is the parameter th at
quantifies the effect of suction on the shearing resistance. In other
words, the following analyses postulate two independent contri-
butions in the strength of unsaturated soils, namely f rictional
strength and suction. This approach is consistent with classical
strength criteria for unsaturated soils and implies that the increase
of shear stress at failure scales with suction increments through
the constant coefficient tanφ
b
= k tanφ′ (Fredlund et al. 1978).
Implementation
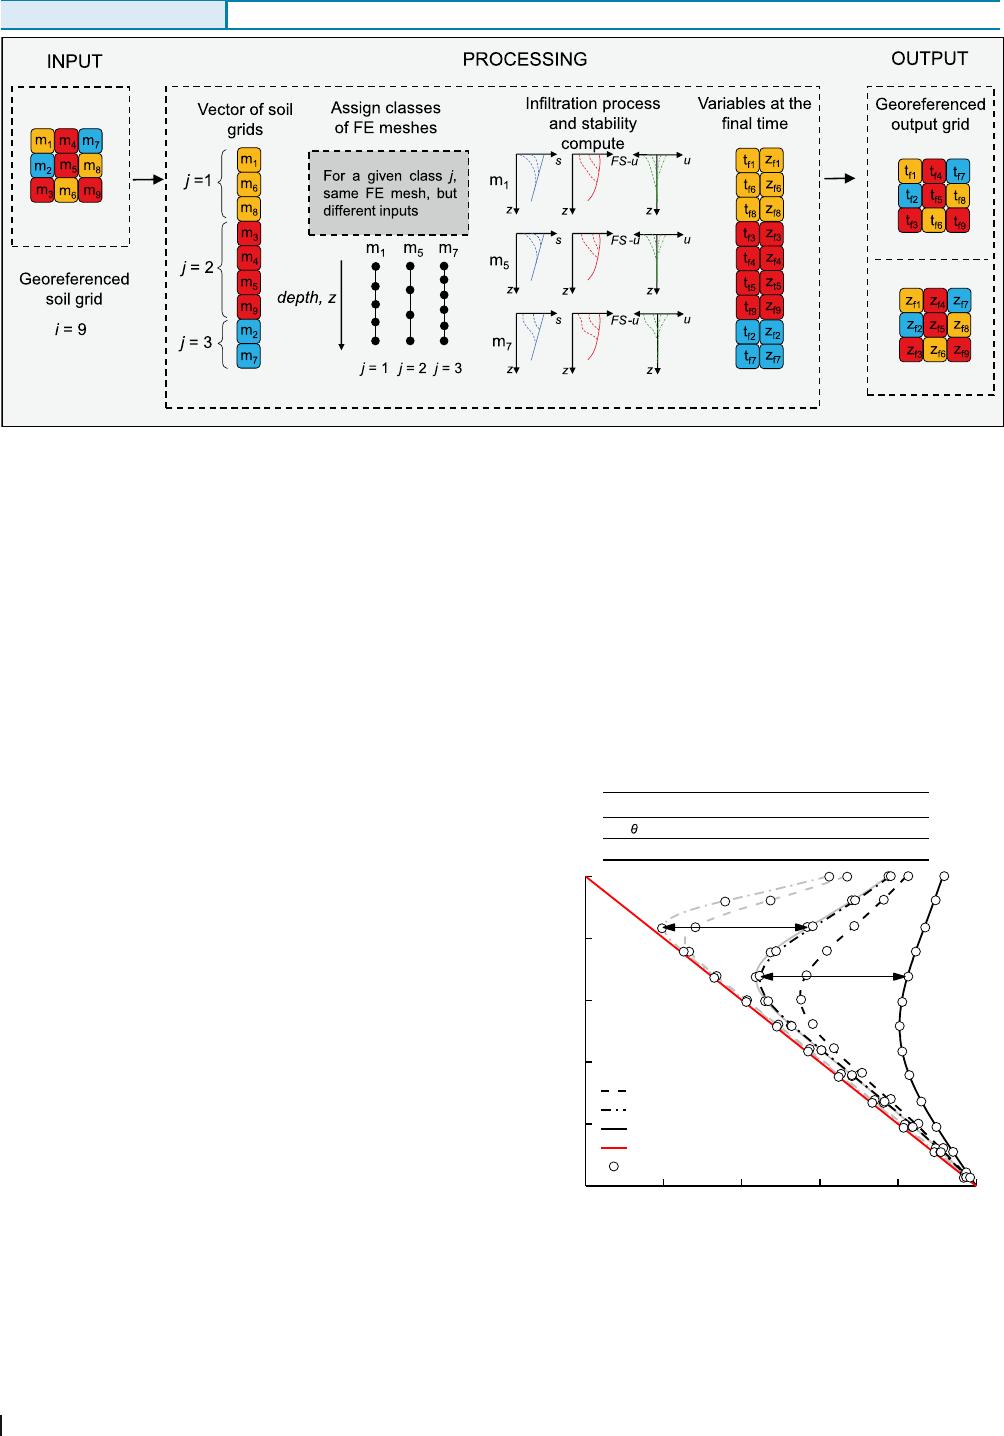
Performing spatially distributed analyses through the
vectorization s cheme proposed by Lizárraga and Buscarnera
(2018) involves three stages, referred to as input, processing, and
output. Here, this procedure has been further elaborated to solve
coupled hydro-mechanical problems at each individual slope unit.
Figure 2 illustrates the methodology. The first step involves a
discretization procedure, by which features of the FE model such
as mesh size and time steps are defined by taking into account the
geometric attributes of the cells of the georeferenced grid (e.g.,
thickness). Then, the slopes of the landscape are arranged into j
subsets sharing the same discretization parameters (marked as j =
1 to 3 in Fig. 2 and denoted by different colors). The vectorized
structure of the selected FE algorithm implies that the computa-
tions are performed simultaneously for all the slope units within a
given subset j. Prior to the processing stage, meshing and time
discretization is assigned to each classified subset (j) to guarantee
reduced computational cost and accuracy.
During the second stage, the pore pressures and correspondent
displacements are computed simultaneously. Next, the computed
pore pressure is used to update FS for each cell in every time step.
If at any time step, the condition FS ≤ 1 is met at certain depth
throughout the analyzed slopes, the corresponding failure time
and depth (t
f
and z
f
) are saved into output column vectors. Oth-
erwise, the program keeps searching until the end of the storm
(which is prescribed as the input loading), eventually assigning a
non-data index to all the cells for which FS > 1 at all the stages of
the analysis.
Finally, the computed output column vectors are mapped back
to the original georeferenced grid by generating raster files for
postprocessing and visualization which can be performed through
a GIS platform.
Based on the abovementioned methodology, soils with different
deformation characteristics can be simulated by switching the sign
of the elastic modul us, F. This is important for slope stability
analyses, in that coupled volume changes during infiltration may
play an opposite role on the margin of safety reflected by the FS
(Wu et al. 2016) or matric suction (Kim et al. 2016a, b). Therefore,
to analyze the role of the hydro-mechanical couplings, three sce-
narios will be considered: (i) an uncoupled model (referred to as
Fig. 1 A homogeneous infinite soil slope and its coordinate system
Landslides
model A), which refers to the case of rigid soil (i.e., F in Eq. (4)is
assumed infinitely large, such that suction changes do not imply
volume change); (ii) a coupled model (referred to as model B)
which refers to the case of swelling soil (F > 0); and (iii) a further
coupled model (referred to as model C) which focuses on the case
of collapsible soil (F < 0).
Single slope response
Before applying the proposed methodology to the selected study
area, single slope analyses have been conducted. The simulations
were based on free drainage conditions at the bottom of the slope
and constant flux prescribed at its, thus enabling to verify our
numerical computations against the analytical results recently
obtained by Wu et al. (2016) with reference to analyses based on
the same boundary conditions.
Figure 3 illustrates the variation of the water head during
constant rain infiltration with reference to each of t he three
abovementioned model scenarios. The results of the model have
been validated against the analytical solution proposed by Wu
et al. (2016) for soils characterized by the same material properties
used in the numerical analyses.
The results display perfect match between numerical and
analytical results. Most notably, they show that the proposed
numerical model is a convenient alternative to explore very
general initial and boundary co nditions typical of field settings.
For a given rainfall intensity, higher suction loss corresponds to
higher volume change, everything else being equal. This implies
that more compliant soils will depart more substantially from the
uncoupled scenario A (rigid soil). However, the type of volume
change is also important. In particular, for the coupled model B
(swelling soil) the computed pore water pressure changes are
slower than those obtained with model A. In other words, swell-
ing soils require longer time to experience a suction loss suffi-
cient t o cau se an instab ility. By contrast , coupled mode l C
(collapsible soil) displays faster suction loss than rigid soils
(i.e., model A) and, consequently, enhanced tendency to achieve
instability conditions.
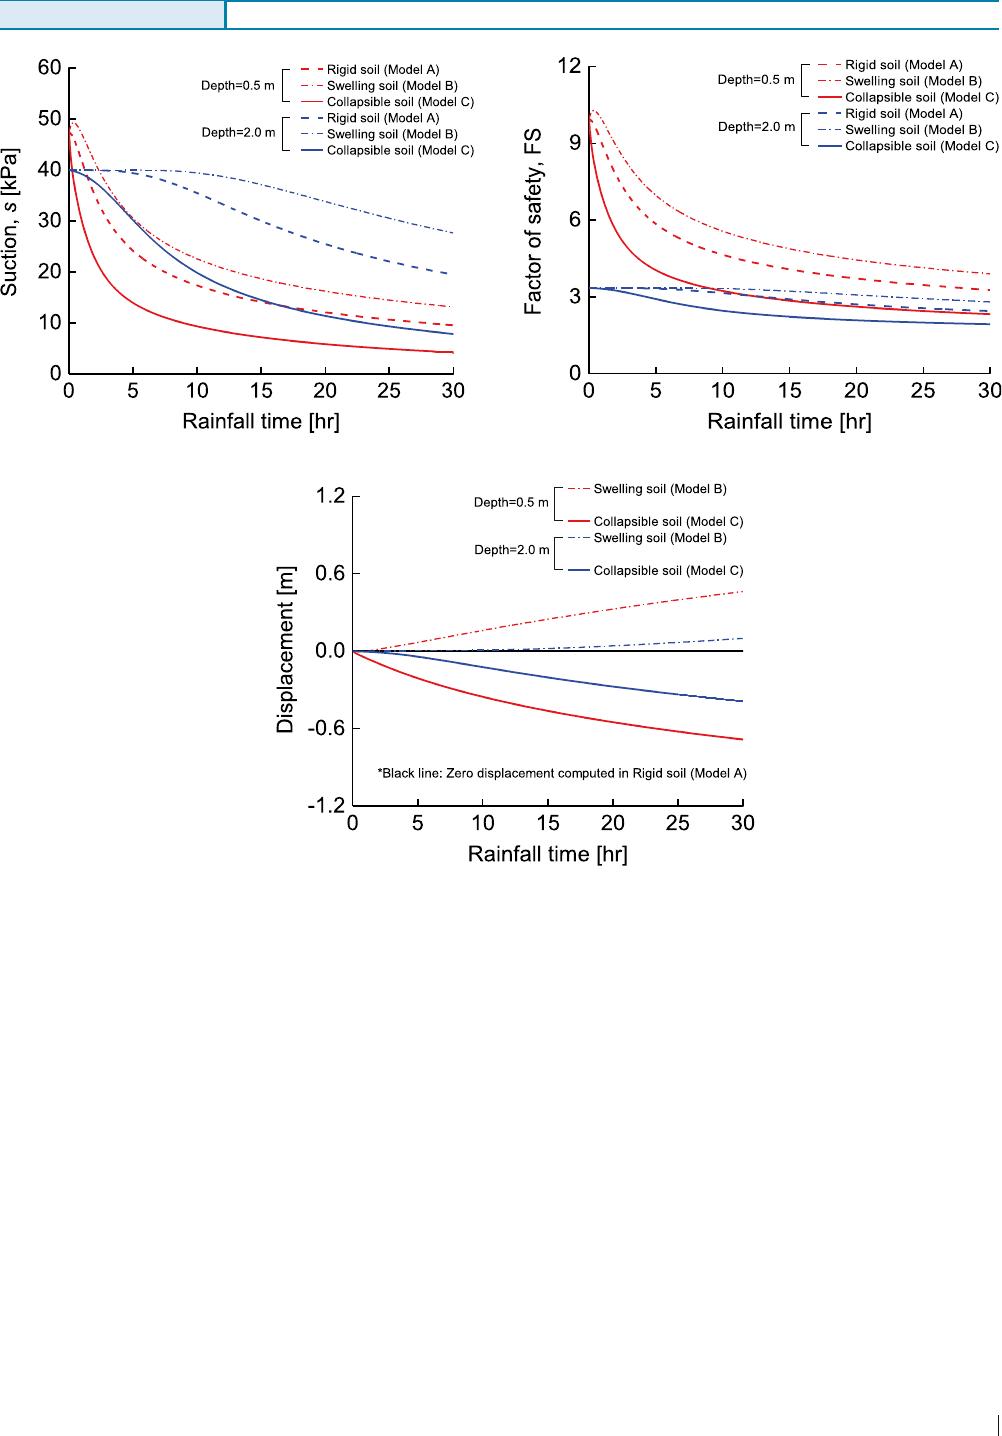
With reference to the set of model parameters discussed earlier,
two monitoring points from a single slope with inclination of 20°
at the depth of 0.5 m and 2 m are selected to illustrate the
computed evolution of key hydro-mechanical variables during
infiltration.
Figure 4a shows the variation of suction for a constant rainfall
input of 10
−6
m/s. Compared with model A, scenario C exhibited a
more pronounced suction loss at the depths of interest, while
model B displayed a relatively slower suction decay. Such effects
can be attributed to deformation-induced couplings. In fact, while
Fig. 2 Schematic representation of model workflow: m = number of cells, j = number of cell classes with the same FE mesh, t
f
= failure time, z
f
= failure depth, s =
suction, FS = factor of safety, u
y
= vertical displacement (modified from Lizárraga and Buscarnera 2018)
Parameters
s
a
k
s
q |F|
0.3
0.01 cm
-1
10
-6
m/s 10
-6
m/s
1000 kPa
-5 -4 -3 -2 -1 0
5
4
3
2
1
Rigid soil (Model A)
Swelling soil (Model B)
Collapsible soil (Model C)
Initial condition (t=0 hr)
Analytical solution (Wu et al., 2016)
t=5 hr
)m(htpeD
Pressure head
(
m
)
t=30 hr
0
Fig. 3 Validation of the numerical model against analytical solutions reported by
Wu et al. (2016). Scenarios relative to rigid, swelling, and collapsing soil are
indicated by different line styles. Computations generated for constant rainfall
(q =10
−6
m/s) imposed during a time interval of 5 h (gray lines) and 30 h (black
lines). Circles indicate the corresponding analytical solution
Original Paper
Landslides
in model B such effect results from the relatively slow suction loss
caused by swelling of the upper layers (which gives rise to a
moderate suction increase beneath this zone to keep con stant
the rate of infiltration), in model C volume loss exacerbates suc-
tion decay, causing stronger downward infiltration even at deeper
locations (depth = 2 m).
In addition, as the soil becomes more saturated, the coupling
effects become less intense and the rate of suction loss follows
similar trends. The sharp decrease of suction computed during
this stage for all the model scenarios correspondingly resulted in a
rapid decrease of FS (Fig. 4b). Although in all simulations, larger
displacements are obtained in the upper portions of the slope due
to higher levels of suction removal, Fig. 4c reveals distinct trends
in soil deformation for the three models, characterized by negative
displacements for model C (volume reduction due to collapse),
positive displacements for model B (volume increase due to swell-
ing), and no displacement during infiltration for model A (rigid
soil). These predictions result from the use of a pseudo-elastic
constitutive law and can be enhanced by using elastoplastic con-
stitutive laws incorporating a more general dependence of the soil
compliance on mean confinement and shear stress (Gens et al.
2006).
Case study
This section discusses the features of a study area in the Xinjiang
province, China , characterized by shallow landslide events that
involved on loess deposits susceptible to volume change. Such
study area will subsequently be used to test the proposed modeling
methodology.
Characteristics of the site
The Yili Kazak autonomous prefecture, in the Xinjiang province, is
one of the seventeen major geological disaster prevention and
control areas listed by the Ministry of Land and Resource. Such
classification is a consequence of the presence of a mountain belt
ab
c
Fig. 4 Evolution of hydro-mechanical variables for different model scenarios: a suction; b FS; and c normal slope deformation
Landslides
covered by highly porous eolian deposits, which characterize the
entire massif of the Yili Kazak region. The area is located alongside
a provincial highway (S316) which connects the Nileke and
Xinyuan county. Construction of highway S316, stretching more
than 28 km, began in April of 2017. The main outcropping geolog-
ical formations along the route are Quaternary Upper Pleistocene
eolian deposits (Q
3
eol
), also called Malan loess, and Upper Pleisto-
cene Holocene alluvial deposits (Q
3-4
apl
) characterized by loose
structure, coarse particles, and development of joint fissures. The
annual precipitation amount is about 477 mm and most precipi-
tation concentrated in April to July (Xinyuan County Meteorolog-
ical Statio n). The hig h frequency of rai nfall and t he poor
mechanical properties of the local soil c aused continuous
landslides since the opening of the infrastructure, threatening
traffic safety and nearby property.
On June 6–7, 2017, after more than 24 h of rainfall (includ-
ing 12 h of heavy precipitation), dozens of shallow landslides
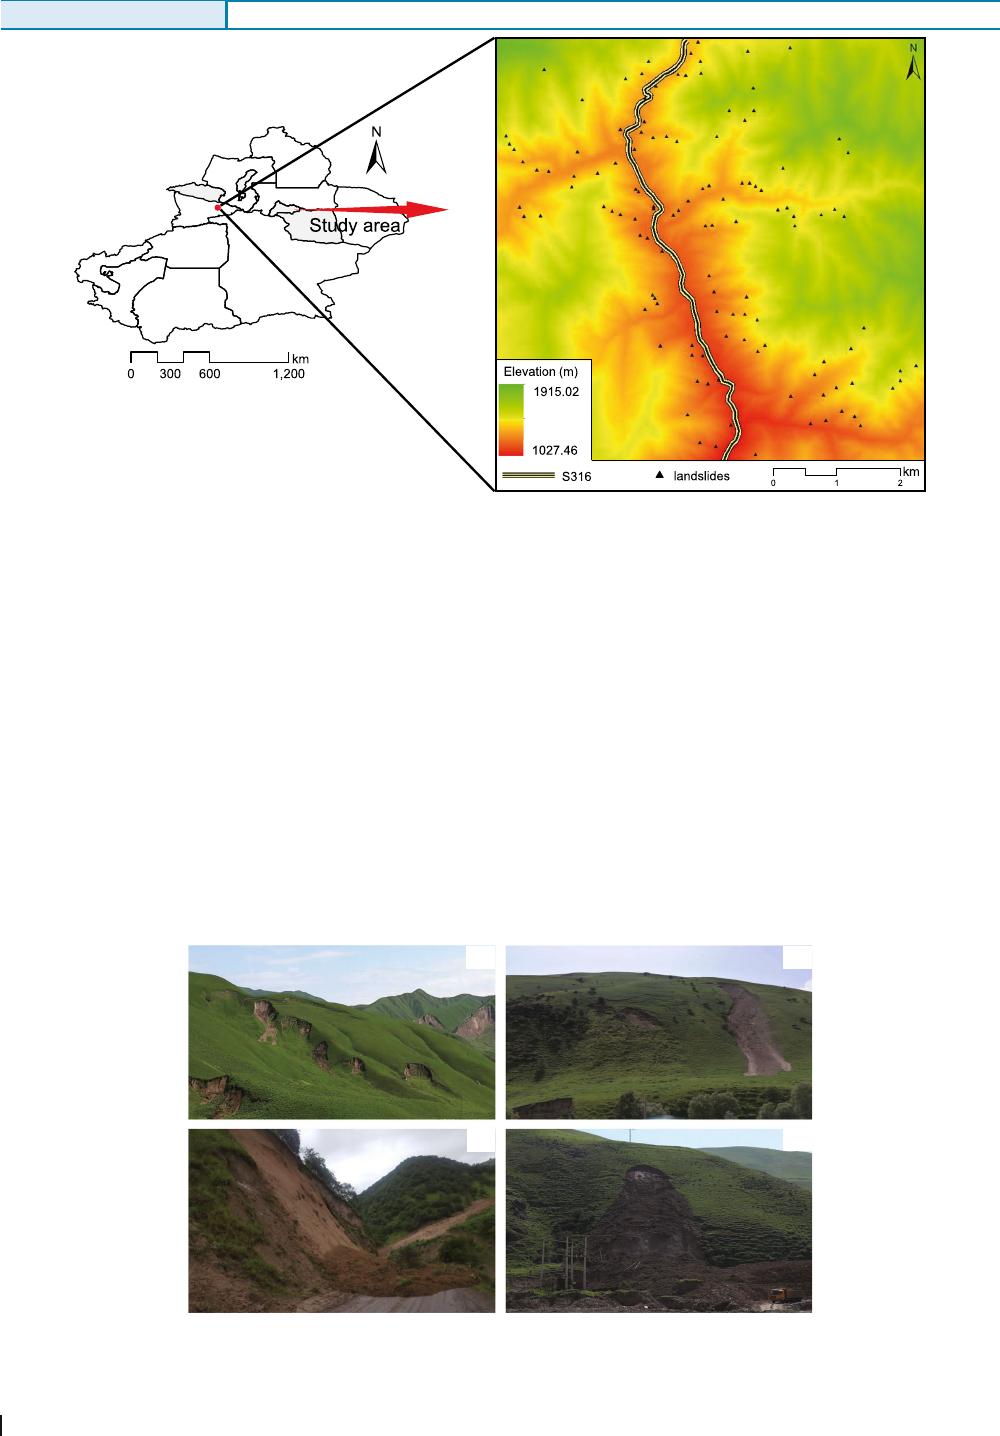
were triggered across the massif covered by loess. The charac-
teristics of the landslides were assessed by the local geological
survey authorities through field investigations (GSR 2017),
based on which the location of the landslide source areas was
mapped across the region of interest (Fig. 5). Figure 6 illus-
trates examples of the typical landslides detected across the
study area. According to the field investigation, most land-
slides failed at a depth lower than 5 m entirely within the
Malan loess strata.
Fig. 5 Location of study area, landslide distribution, and digital elevation model (DEM)
a
b
c
d
Fig. 6 Landslides triggered by heavy rainfall on June 6–7, 2017. The subfigures a–d illustrate examples of the detrimental impacts of landslides on the road safety
(adapted from GSR 2017)
Original Paper
Landslides
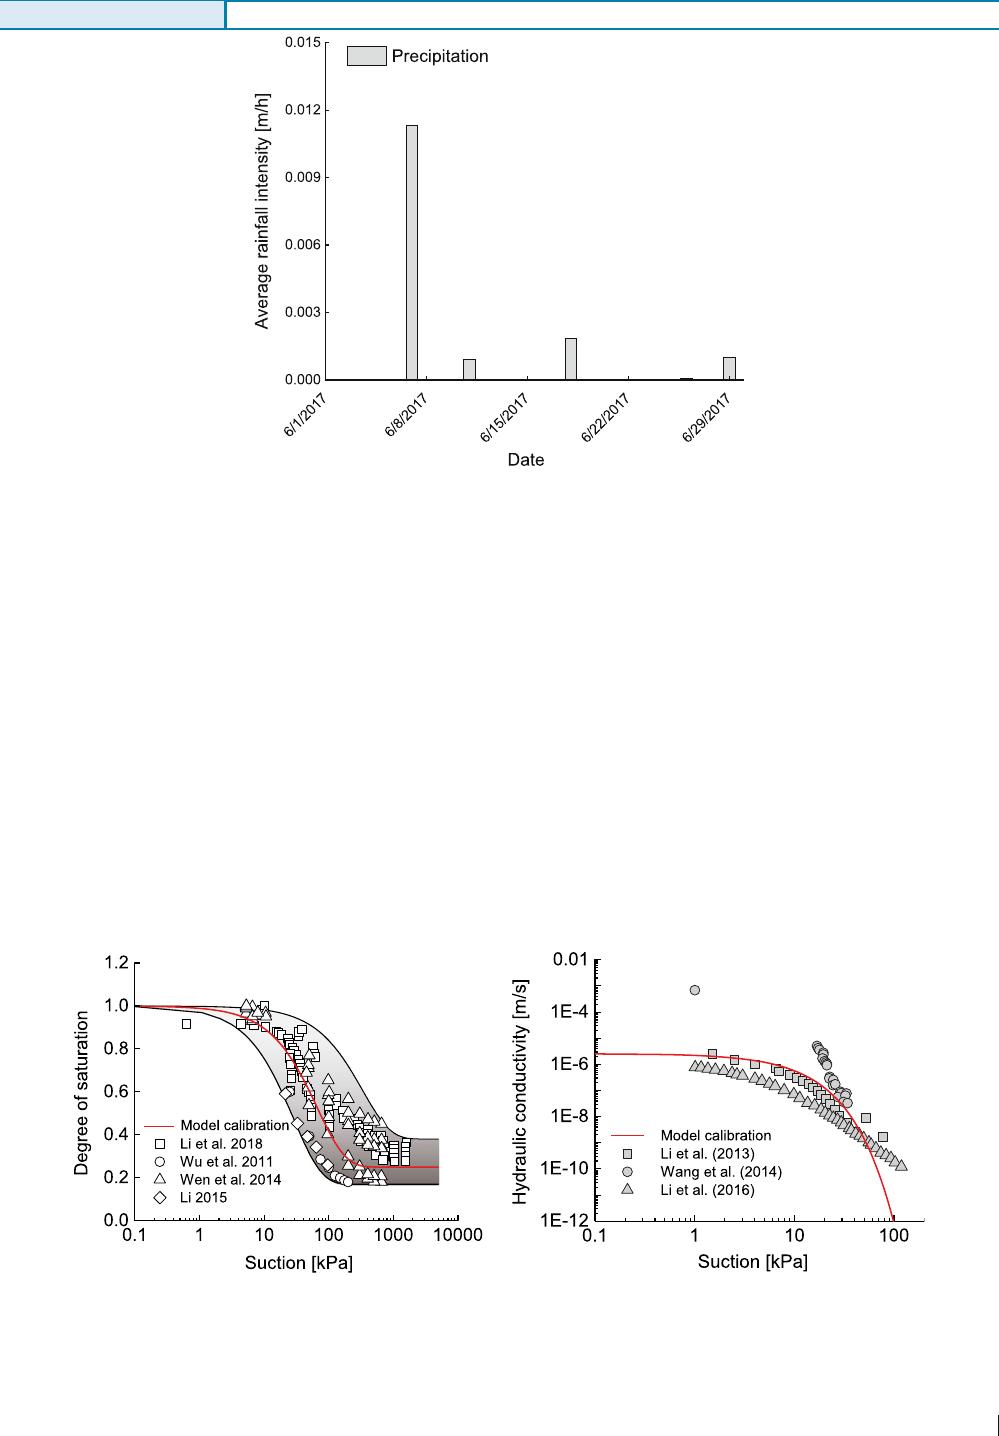
To simulate these events numerically, a georeferenced database
has been created on the basis of these data, as well as of a digital
elevation model (DEM) of 12 × 12 m resolution. In addition, rain-
fall intensity data from national meteorological stations are avail-
able for the study area. Figure 7 provides the average daily rainfall
for the month of June 2017, showing that the event of June 7 was by
far the most intense. The numerical analyses discussed in the
following sections will therefore focus on this specific storm by
using 12-h resolution rainfall measurements according to which
the storm involved a first stage between 8:00 p.m. of June 6 and
8:00 a.m. of June 7, characterized by a relatively low average
intensity of 0.0013 m/h (stage I) and a second stage from
8:00 a.m. to 8:00 p.m. of June 7, characterized by a higher average
intensity of 0. 0213 m/h (stage II), which triggered most of the
reported landslides.
Hydrologic parameters
Initial hydr ological conditions were measured on monitoring
hillslopes within the area and reported in terms of degree of
saturation (GSR 2017). Such monitoring data will be used here
to calculate the initial suction conditions by using a WRC
calibrated for Malan loess. The WRC calibration is shown in
Fig. 8a , along with upper bound and lower bound retentio n
characteristics derived from published experimental data (Li
et al. 2018;Wuetal.2011;Lietal.2015;WenandYan2014).
Despite that the data scatter would suggest the need of site-
specific laboratory measurements here not available, an average
calibration was used to provide a reasonable reference for the
analyses. A calibrated HCF for Malan loess is shown in Fig. 8b,
onthebasisofthesaturatedvalueofK reported by Li et al.
(2016).Itcanbeseenthatsuchcalibrationisinquantitative
Fig. 7 Average daily precipitation intensity during June 2017 in Yili as reported by the China Meteorological Bureau
ab
Fig. 8 Calibration of hydrologic parameters for the Malan loess. a Water retention curve (data after Li et al. 2018; Wu et al. 2011; Li et al. 2015; Wen and Yan 2014). b
Hydraulic conductivity function (data after Li et al. 2013; Li et al. 2016; Wang et al. 2014). Parameter values corresponding to the Gardner model. Experimental data points
are indicated by symbols. Solid lines indicate model results
Landslides

agreement with data for ot her loes s deposits from the area
tested under unsaturated conditions (Li et al. 2013;Wangetal.
2014).
Mechanical parameters
The coefficient k in Eq. (10) controlling the suction dependence of
the shearing resistance has been calibrated by fitting direct shear
test data reported by Hu et al. (2012) (Fig. 9).
The parameter F is a modulus quantifying volume changes caused
by suction variation (i.e., low values reflect high suction sensitivity and
large deformation potential upon wetting). To estimate its value,
oedometer test conducted on Malan loess under different vertical
stress has been used (Shao et al. 2018)(Fig.10). The results show
pressure dependence of F, which exhibits higher magnitude in absolute
value at higher pressure. This indi cates more compliant response and
high suction sensitivity near the surface. The value of F resulting from
the experiments was negative for all the tested conditions, thus
indicating collapsible response. Accordingly, we can infer the modulus
of F at low vertical stress, which led to an estimated value of 998 kPa
for the simulations (the list of calibrated model parameters is summa-
rized in Table 1). It must be noted that, as for all model parameters,
direct evidence specific for samples taken from the study area would
be ideal for quantitative analyses. Since this information was not
available, the estimate derived from the data in Fig. 9 should be
regarded only as a first approximation, which will be assessed against
other model scenarios which will either neglect volume changes (mod-
elA)orassumetheoppositetypeofvolumechangebehavior(i.e.,
swelling, as in model B).
Analyses and results
Spatial performance
The computed susceptibility maps based on the calibrated param-
eters summarized in Table 1 are shown in Fig. 11. Cells with distinct
Fig. 9 Calibration of model parameters: coefficient controlling suction-induced strength increase (k = 0.528) (data after Hu et al. 2012)
Fig. 10 Calibration of the elastic modulus F controlling suction-induced volume change (data after Shao et al. 2018); the best fit equation reported in the figure implies a
value of F in kPa units
Original Paper
Landslides
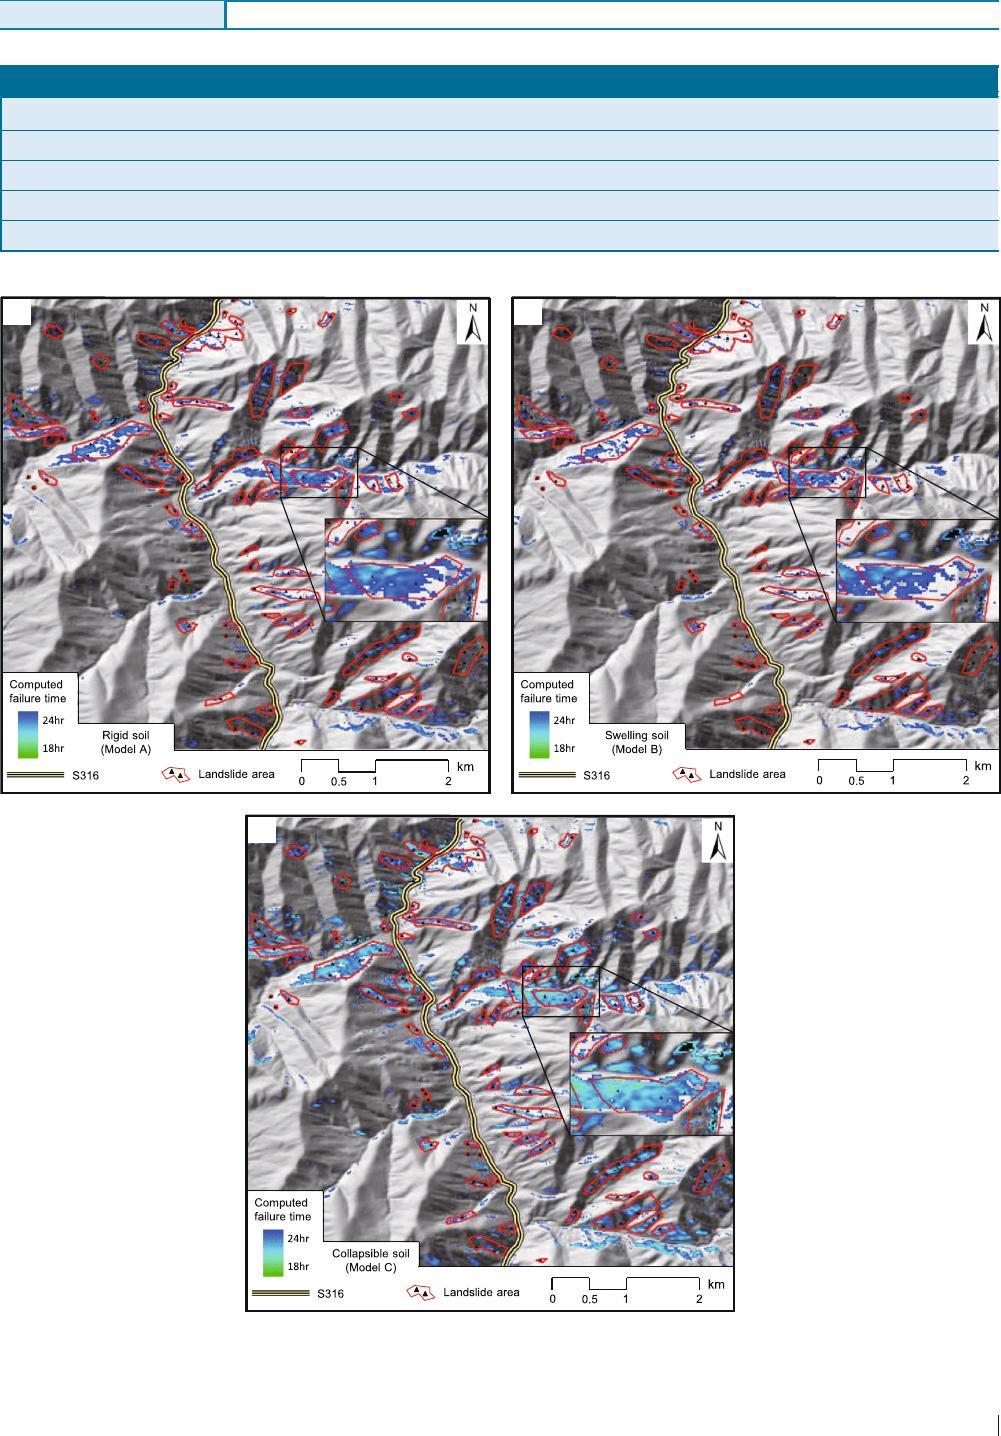
Table 1 Description of model parameters and calibrated values
Hydrologic parameters Value Mechanic parameters Value
Saturated permeability, k
sat
(m/s) 2.6E-6 Friction angle, φ ′ (°) 33
Residual volumetric water content, θ
res
0.115 Elastic moduli, E (kPa) 46,000
Gardner model, α (m
−1
) 0.15 Elastic moduli, |F| (kPa) 998
Unit weight of water, γ
w
(kN/m
3
) 10 Unit weight of soil, γ
s
(kN/m
3
) 15.6
Porosity 0.46 Suction sensitivity of shear strength, k 0.528
a
b
c
Fig. 11 Results of simulations for three model scenarios. a Uncoupled model A. b Coupled model B, swelling soil. c Coupled model C, collapsible soil
Landslides
colors indicate slope failure at different times, thus readily pro-
viding a visual snapshot of the spatial model performances. In
addition, selected locations of the simulated area have been en-
larged to facilitate the visualization of the temporal performance
of the tested models. The map refers to the uncoupled model A
(Fig. 11a), as well as to the coupled models B (Fig. 11b) and C
(Fig. 11c). It is apparent that model C exhibits the highest density of
failure zones across the landscape, while coupled model B predict-
ed the lowest fraction of unstable areas. By contrast, the uncoupled
model A produced intermediate predictions between the two
coupled models. This result is in agreement with earlier analyses
for individual slopes, which showed that volume collaps e was
detrimental for slope stability, while swelling caused delayed suc-
tion removal.
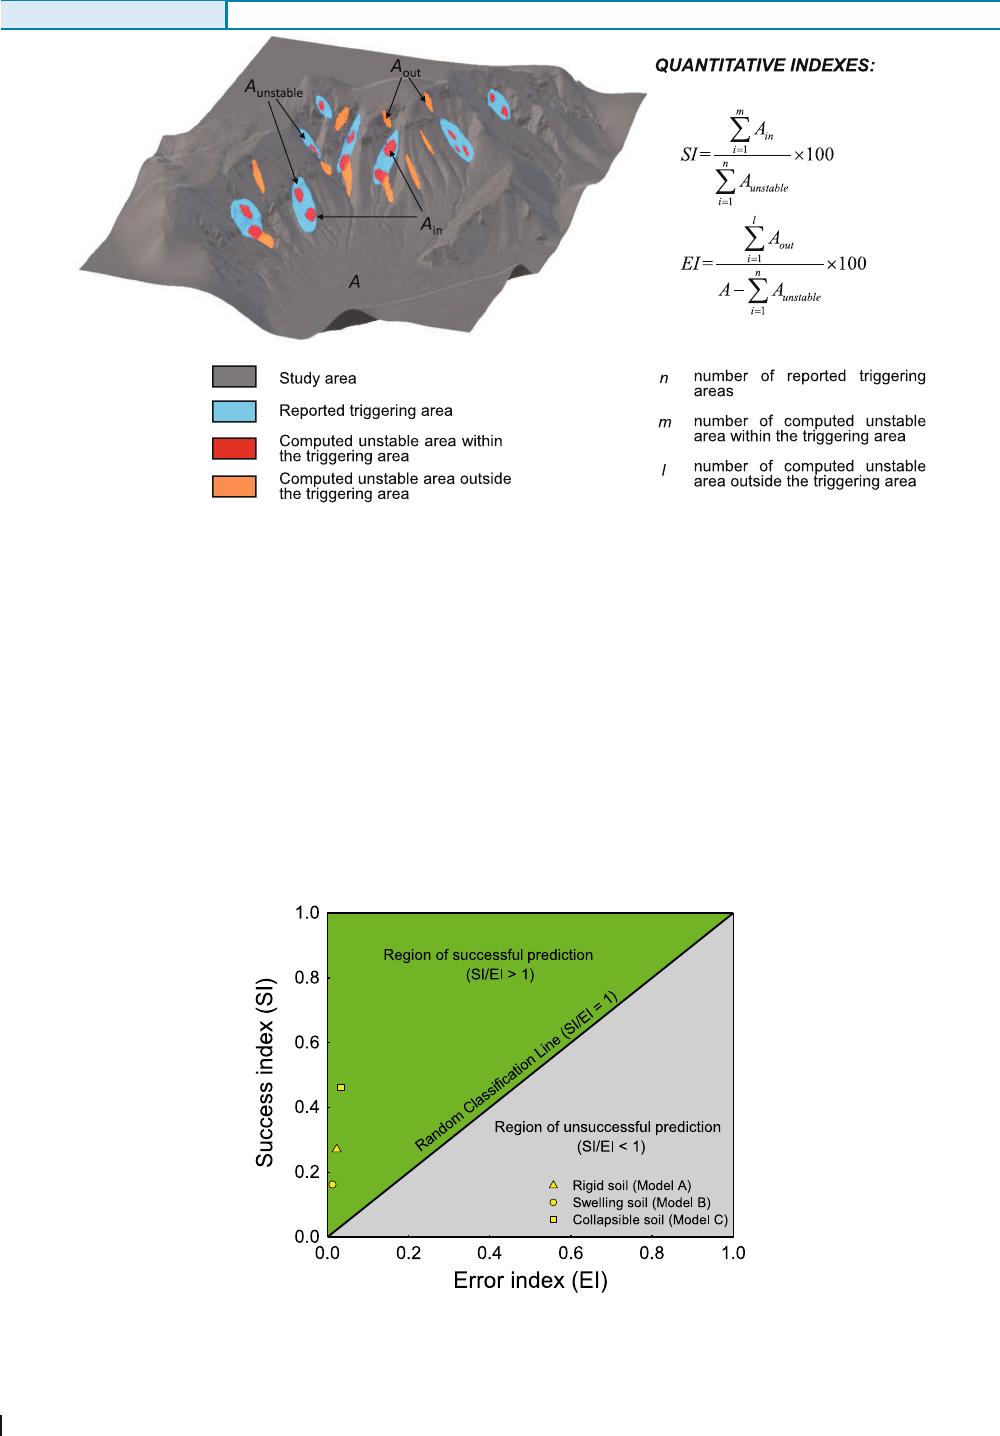
To quantify the accuracy of the computations, two indicators
here defined Success Index (SI) and Error Index (EI) are used to
evaluate the model performance (Sorbino et al. 2007 ). Figure 12
schematically illustrates the definition of such indices. Specifically,
SI represents the portion of computed unstable area that lies
within each source area, while EI represents the percentage ratio
of unstable predictions that lies outside the reported source area
(A
out
) and the area unaffected by the storm (A
stable
). Since high
values of SI are generally accompanied by overprediction, the ratio
SI/EI is used to assess the overall quality of the computation. For
Fig. 12 Schematic diagram of the performance indices definition
Fig. 13 Spatial performance of different model scenarios evaluated through the Success Index (SI) and the Error Index (EI). The light gray area indicates successful
predictions (SI/EI > 1), while the dark gray area indicates poor predictions (SI/EI < 1)
Original Paper
Landslides
