
REVIEW
Genes in the pathway of tooth mineral tissues and dental caries risk:
a systematic review and meta-analysis
Luiz Alexandre Chisini
1
& Mariana Gonzalez Cademartori
1
& Marcus Cristian Muniz Conde
2
& Luciana Tovo-Rodrigues
1
&
Marcos Britto Correa
1
Received: 6 July 2019 / Accepted: 6 November 2019
#
Springer-Verlag GmbH Germany, part of Springer Nature 2019
Abstract
Objectives To perform a systematic review of the literature, investigating the influence of tooth mineral tissues genes on dental
caries.
Materials and methods Five databases were searched. Only human studies with cross-sectional, longitudinal, and case-control
design were included. Meta-analysis was performed for each polymorphism, providing allele and genotype estimates. A meta-
analysis was performed, pooling several polymorphisms for each gene. A Funnel Plot and Egger’stestwerealsoperformed.
Results A total of 1124 records were found. Of these, 25 papers were included in the systematic review and 18 in the meta-
analysis. Most of the studies (52%) were of medium quality. With regard to the allele analysis, the T allele of rs134136 (TFIP11)
(OR 1.51; 95%CI 1.02–2.22) showed an association with high experience of caries and the summarization of polymorphisms
investigated in the TFIP11 gene, after exclusion of SNP linkage disequilibrium, showed an association with caries experience
(OR 1.64; 95%CI 1.08–2.50). An analysis of the homozygous genotype did not show any significant association. The pooled
SNPs of AMBN showed associations with caries (OR 0.45; 95%CI 0.29–0.72). The pooled polymorphisms of AMELX were
associated with caries experience (OR 1.78; 95%CI 1.23–2.56). In the analysis of the homozygous genotype, no SNP showed a
significant association. Egger’s test showed no significant publication bias for all models (p >0.05).
Conclusion The present findings showed that the genes TFIP11, AMBN,andAMELX play an important role in dental caries.
Clinical relevance Several single nucleotide polymorphisms related to the genes in the formation of tooth mineral are linked to the
occurrence of dental caries, and these genes have proved to be important for an explanation of differences in the risk of dental
caries.
Keywords Polymorphisms
.
Dental caries
.
Mineral tissues
.
Genetic
.
Gene
Electronic supplementary material The online version of this article
(https://doi.org/10.1007/s00784-019-03146-x) contains supplementary
material, which is available to authorized users.
* Marcos Britto Correa
marcosbrittocorrea@hotmail.com
Luiz Alexandre Chisini
alexandrechisini@gmail.com
MarianaGonzalezCademartori
marianacademartori@gmail.com
Marcus Cristian Muniz Conde
marcus.conde@univates.br
Luciana Tovo-Rodrigues
luciana.tovo@gmail.com
1
Federal University of Pelotas, 457, Gonçalves Chaves St. 5th floor,
Pelotas, RS 96015-560, Brazil
2
University of Vale do Taquari, 171, Avelino Talini St,
Lajeado, RS 95914-014, Brazil
Clinical Oral Investigations
https://doi.org/10.1007/s00784-019-03146-x

Introduction
Dental caries is a chronic disease with high global preva-
lence [1]. About 2.4 billion people with permanent denti-
tion and 621 million children with primary teeth are af-
fected by caries, leading to a reduction in the quality of
life [2]. Although dental caries can be prevented by ad-
dressing the etiological factors, such as o ral hygiene
habits (biofilm ), decrease in the consumption of ferment-
able carbohydrates and the use of fluorides as in fluori-
dated water, fluoride toothpastes, mouthwash, among
others [3, 4], its control at the population level is very
difficult as caries is strongly influenced by contextual,
socioeconomic, and behavioral factors [1, 5– 7].
Therefore, it remains a worldwide public health problem
[1].
It is undisputable that biological, socioeconomic, and
behavioral factors are the main variables explaining the
occurrence and distribution of dental caries in the popu-
lation. However, in some cases, individuals possessing the
same protective factors—such as water fluoridation—or
risk factors, and with similar oral health-related behavior,
present with different patterns of dental caries [4, 8]. For
these individuals, genetic factors could be an intrinsic
influence providing additional resistance or susceptibility
to dental caries [9]. In this context, studies have proposed
that a proportion of these variati ons in t he prevalence of
dental car ie s may be expl ai n ed by gene ti c fact or s [9, 10].
In fact, a wide range of genes have been identified, dem-
onstrating their important role in the development and
progression of caries [9].
A small number of studies focusing on the genetic aspects
of caries have performed Genome-Wide Associations
(GWAS), which aim to identify potentially new genes in-
volved with dental caries [11–13], while most studies investi-
gating the association of genetic components and dental caries
have used candidate gene methodology, examining single nu-
cleotide polymorphisms (SNPs) [9]. In this way, these SNPs
can be pooled into four main groups: (a) those involved with
tooth mineral tissues, (b) immune response, (c) salivary com-
position/flow, and (d) gustatory genes [9]. Among these
groups of genes, the SNPs involved with tooth mineral tissues
are currently responsible for the majority of the available lit-
erature [9].
Thus, an understanding of which SNPs and genes are in-
volved in individuals’ susceptibility to caries disease could
support the development of a viable approach to better com-
prehend these complex mechanisms. Accordingly, the aim of
the present study was to perform a systematic review of the
literature, investigating the influence of single nucleotide
polymorphisms related to tooth mineral tissues genes on the
experience of dental caries, as well as to perform a meta-
analysis using the data.
Methods
The present systematic review was registered in PROSPERO
(International Prospective Register of Systematic Reviews)
under protocol number CRD42018098809. This review was
reported accordi ng to the Preferred Reporting Items for
Systematic Reviews and Meta-Analyses (PRISMA) guideline
[14].
Review question and searches The rese arch question was
structured obeying the PICO model: “Are gene p olymor-
phisms in tooth mineral formation a risk factor for dental car-
ies in children and adults?”
– Participants/population: individuals, adults and children
– Intervention/exposure: single nucleotide polymorphisms
in the formation of tooth mineral. The effect allele in this
study was standardized as the least frequent allele report-
ed in the studies. Whenever the minor allele frequency
varied among the studies, the effect allele was referred to
as the minor allele in the majority o f the studies.
Similarly, to do the estimates stratifying by genotype,
we opted for the minor homozygote and heterozygotes
as the effect genotypes.
– Comparator/control: single nucleotide polymorphisms in
the formation of tooth mineral. Thus, the effect allele was
compared to the reference allele, defined as that which is
most frequent in the population. To perform genotype
analysis, the major homozygote was chosen as the
reference.
– Outcome: dental caries experience.
The search strategy was achieved using appropriate key-
words and entry terms related to MeSH Terms, taking into
consideration the particularity and structure of each database
(Table 1). Five databases were researched (PubMed, Scopus,
ISI Web of Science, BVS virtual health library, Scielo),
through November 2018. All retrieved records were uploaded
to EndNote software (Thomson Reuters, Rochester, New
York, NY, USA). Thus, a virtual library was assembled.
Identified duplicate studies were excluded. Two independent
reviewers (LAC and MCMC) read the titles and abstracts of
all the papers. Inclusion criteria comprised articles that aim to
evaluate the association between genetic tooth mineral tissues
in children or adults. Only human studies with cross-sectional,
longitudinal, and case-control design were included. No re-
strictions were p laced on language or date of publication.
Studies with design of literature reviews, case reports and case
series, conference abstracts, letters to the editor, and qualita-
tive studies were all excluded. The same reviewers read the
full-text and adjudged the articles. In the event of disagree-
ment, the same reviewers discussed the issue until a consensus
was reached.
Clin Oral Invest

Data collection Data extraction was performed independently
by two reviewers in a predefined database. The following data
were extracted: Author, year, country, study design, sample,
age, ethnicity of the sample (% for each ethnic group (skin
color or origin of population)), proportion of males and fe-
males for each sample, calculation of statistical power, cate-
gorization of dental caries, minor allele frequency calculation
for each polymorphism, analytical approach, Hardy-
Weinberg equilibrium, effect estimate (crude an d adjusted
analysis values and their respective confidence intervals)
covariables, and the main results.
Quality of studies The quality of the included studies was
verified in accordance with the Appraisal Checklist for
Observational Studies scale (Joanna Briggs Institute) (T.J.B.,
2014). This tool presents 10 questions evaluating different
points in the study, which should be answered with “No,”
“not clear,” or “Yes.” Each Yes response corresponds to one
point, so the tool score ranges from 0 to 10. Studies totaling
between 0 and 3 points were considered low quality; 4 to 6
were of medium quality; and 7 to 10 were considered high
quality. To classify the studies, two reviewers will perform the
classification independently. Disagreements will be remedied
through discussion until consensus is reached.
Strategy for data synthesis A meta-analysis was planned to be
performed when the same polymorphisms were identified in
at least three different studies, when the effects were shown or
where it was p ossible to calculat e the e ffect measures .
However, due to the fact that the studies analyzed different
polymorphisms in the same gene, it was decided to perform a
global meta-analysis pooling the same polymorphisms across
the studies, as well as pooling different polymorphisms in the
same gene across the studies. Thus, for the meta-analysis, only
SNPs present in at least two different studies were considered
in the pooled polymorphism and gene results. In addition,
meta-analysis was performed pooled by gene, including re-
sults of individual studies. Moreover, in the analysis, a divi-
sion was made between allele and genotype models, calculat-
ing the estimates for the effect allele and effect heterozygote
and homozygote genotypes, pooling by both polymorphism
and gene. The effect allele and genotypes were compared to
the reference allele and genotype, respectively, in different
analyses. In studies that present more than one categorization
for dental caries, DMF/dmf = 0 vs. DMF/dmf ≥ 1 was chosen.
For the meta-analysis, the results of the adjusted models
(adjusting for ethnicity) were preferably included. In cases
where the adjusted results have not been reported, the unad-
justed estimates were considered or calculated, to be included
in the analysis. In cases where results were only shown by
stratified analysis, we included the group with the highest
number of individuals. The odds ratio (OR) was used to mea-
sure effect size with a 95% confidence interval (CI). The prev-
alence ratio measures were converted to OR using the formula
proposed by Zhang and Yu: PR = odds ratio / 1 − risk0 + risk0
× odds ratio, where “risk0” is the prevalence of disease among
non-exposed individuals [15, 16]. It is important to emphasize
that, in genetic studies, non-genetic factors known to be asso-
ciated with risk of disease can exist in the intermediate path-
ways between the genetic risk marker and disease develop-
ment and, therefore, should be included in the adjusted anal-
ysis to avoid over-adjustment [17]. To address the absence of
the reporting of ethnicity, an investigation was reported of
allele frequencies stratified by populations based on the hu-
man genome (GRCh37.p13).
To avoid inconsistencies with the data analysis, data har-
monization for palindromic SNPs was performed. When the
palindromic SNP was present in two different studies, we only
kept the SNP in the analysis if the study reported the DNA
strand. If this information was missing in the papers, the SNP
was excluded from further analysis. In order to avoid biased
estimates due to linkage disequilibrium (LD) in the gene pool
analysis, a pruning was performed, by LD, for those studies
that analyzed more than one polymorphism in the same gene.
To this end, a pairwise comparison was carried out including
only SNPs which were independent (r
2
< 0.3) from the others.
For the SNPs in LD ≥ 0.3, the analysis included the one with
the lowest p value for the association. When the studies did
not provide estimates of linkage disequilibrium, those re-
trieved from the 1000 Genomes global population as a refer-
ence panel were considered. Thus, when the SNPs included in
the meta-analysis (in gene stratification) were extracted from
Table 1 Search strategy
Search syntax
PubMed #1 (“Dental Decay” OR “Caries, Dental” Or “Decay, Dental” OR “Carious Dentin” OR “Carious Dentins” OR “Dentin, Carious” OR
“Dentins, Carious” OR “Dental White Spot” OR “White Spots, Dental” OR “White Spots” OR “Spot, White” OR “Spots, White” OR
“White Spot” OR “Dental White Spots” OR “White Spot, Dental” OR “Susceptibility, Dental Caries” OR “Caries Susceptibility,
Dental” OR “Caries Resistance, Dental” OR “Resistance, Dental Caries” OR “Dental Caries Resistance”)
#2 (“Polymorphisms, Genetic” OR “Genetic Polymorphisms” OR “Genetic Polymorphism” OR “Polymorphism”
OR “Polymorphisms” OR
“Nucleotide Polymorphism, Single” OR “Nucleotide Polymorphisms, Single” OR “Polymorphisms, Single Nucleotide” OR “Single
Nucleotide Polymorphisms” OR “SNPs” OR “Single Nucleotide Polymorphism”)
Search combination: #1 AND #2
Clin Oral Invest
the same study, they were only maintained in the analysis
when r
2
of equilibrium linkage was ≤ 0.30, according to the
investigated population. Due to the high degree of heteroge-
neity (I
2
statistic) observed across the studies, random models
were carried out. All analyses were performed using Stata
12.0 software (StataCorp, College Station, TX, USA).
To investigate possible publication bias, the Egger’stest
and contour-enhanced funnel-plot were used. This test details
statistical significance on a funnel-plot, demonstrating the lev-
el of significance of each estimate (allele, homozygote, and
heterozygote analysis), and graph pooling by gene was also
plotted [18]. Contour-enhanced funnel plots were performed
to examine the context of the statistical significance of the
results [18].
Results
Study selection
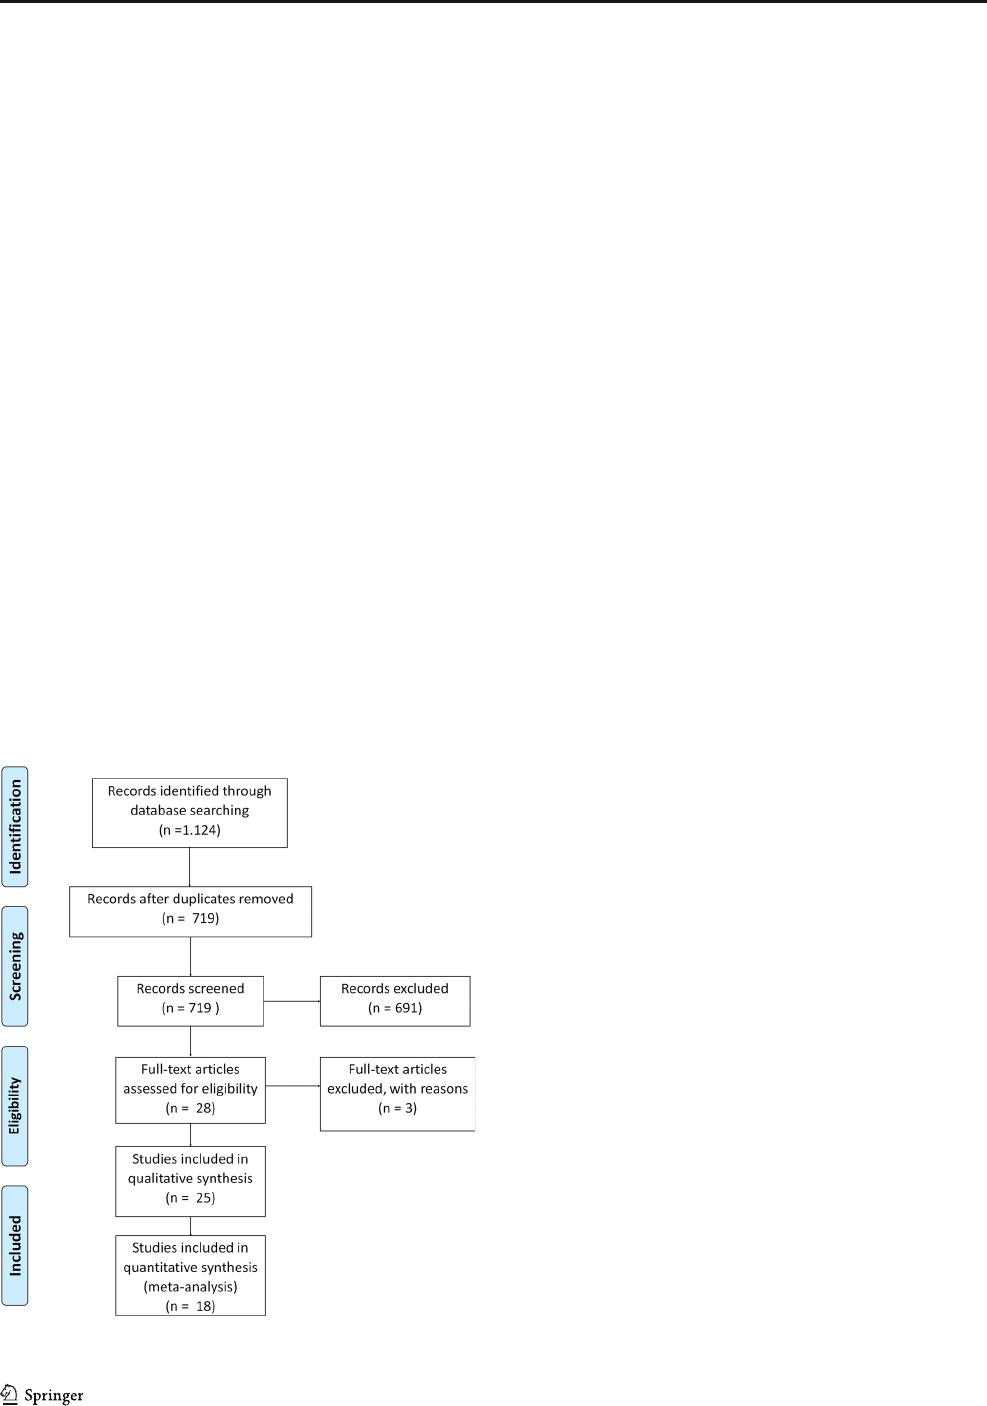
A total of 1124 records were found in the initial searches
(Fig. 1). Excluding duplicates, 719 manuscripts remained for
title and abstract scree ning. Tw enty-eight full-text articles
were assessed for eligibility, of which three were excluded.
The studies and reasons for exclusion are shown in Table 2.
Thus, 25 papers were included in the systematic review and 18
in the meta-analysis (Fig. 1). Studies evaluating the same pop-
ulation (French children) [22, 23] and (Polish children) [24,
25] were included because different genes and SNPs of tooth
mineral tissues were investigated in each study.
Study characteristics
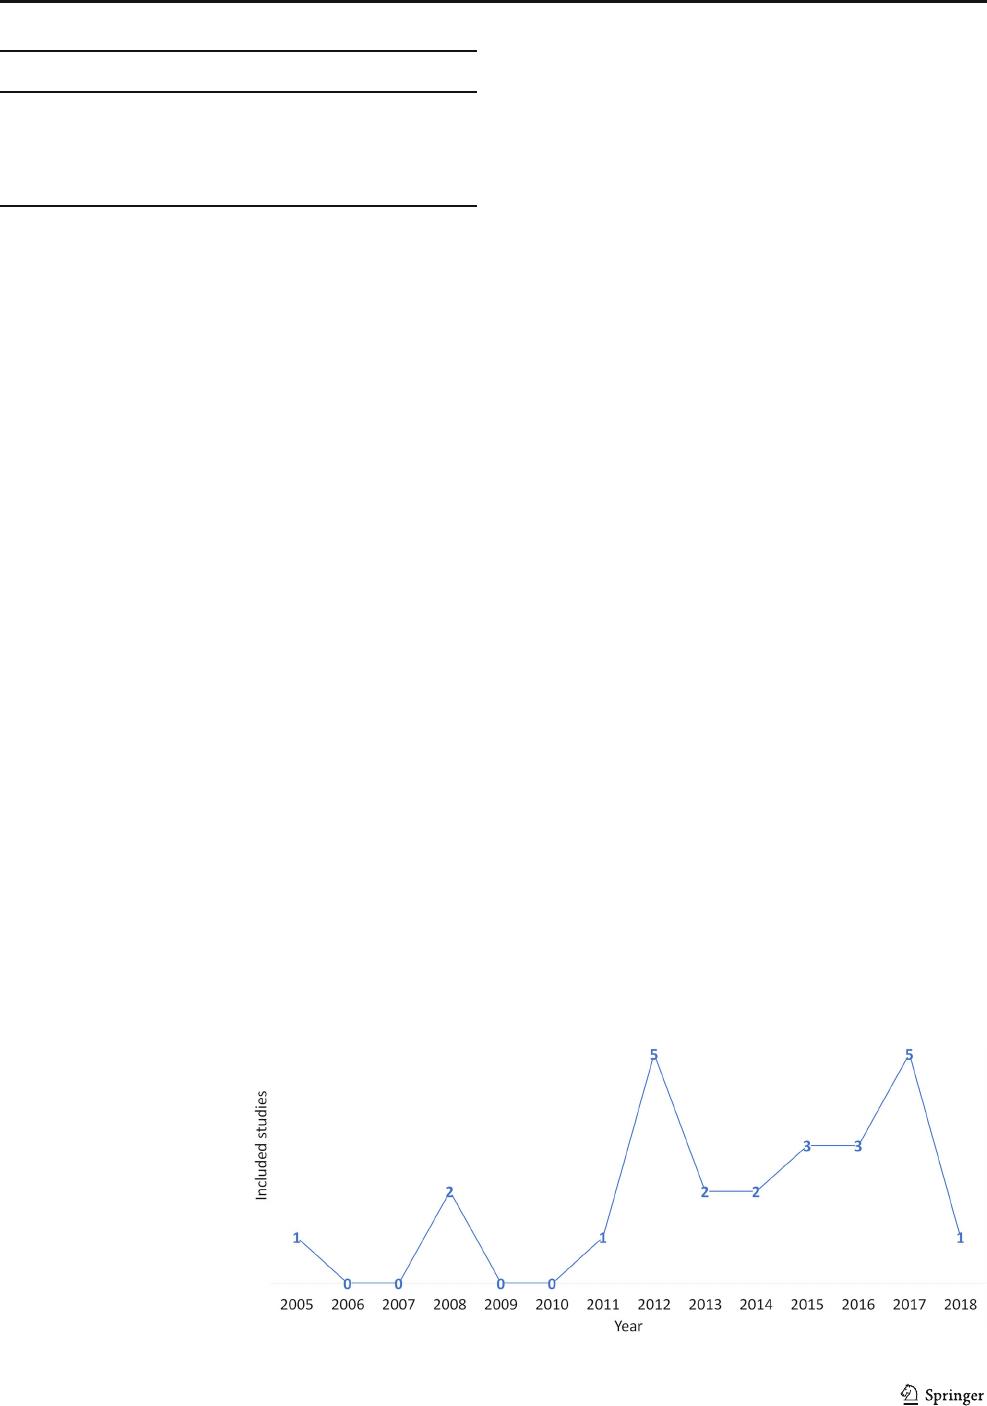
Most of the 25 studies included were in the form of a case-
control design. The studies were performed most frequently in
populations from Brazil (n = 6; 24%), followed by Turkey (n
= 4; 16%). Most of the studies were published after 2011 (Fig.
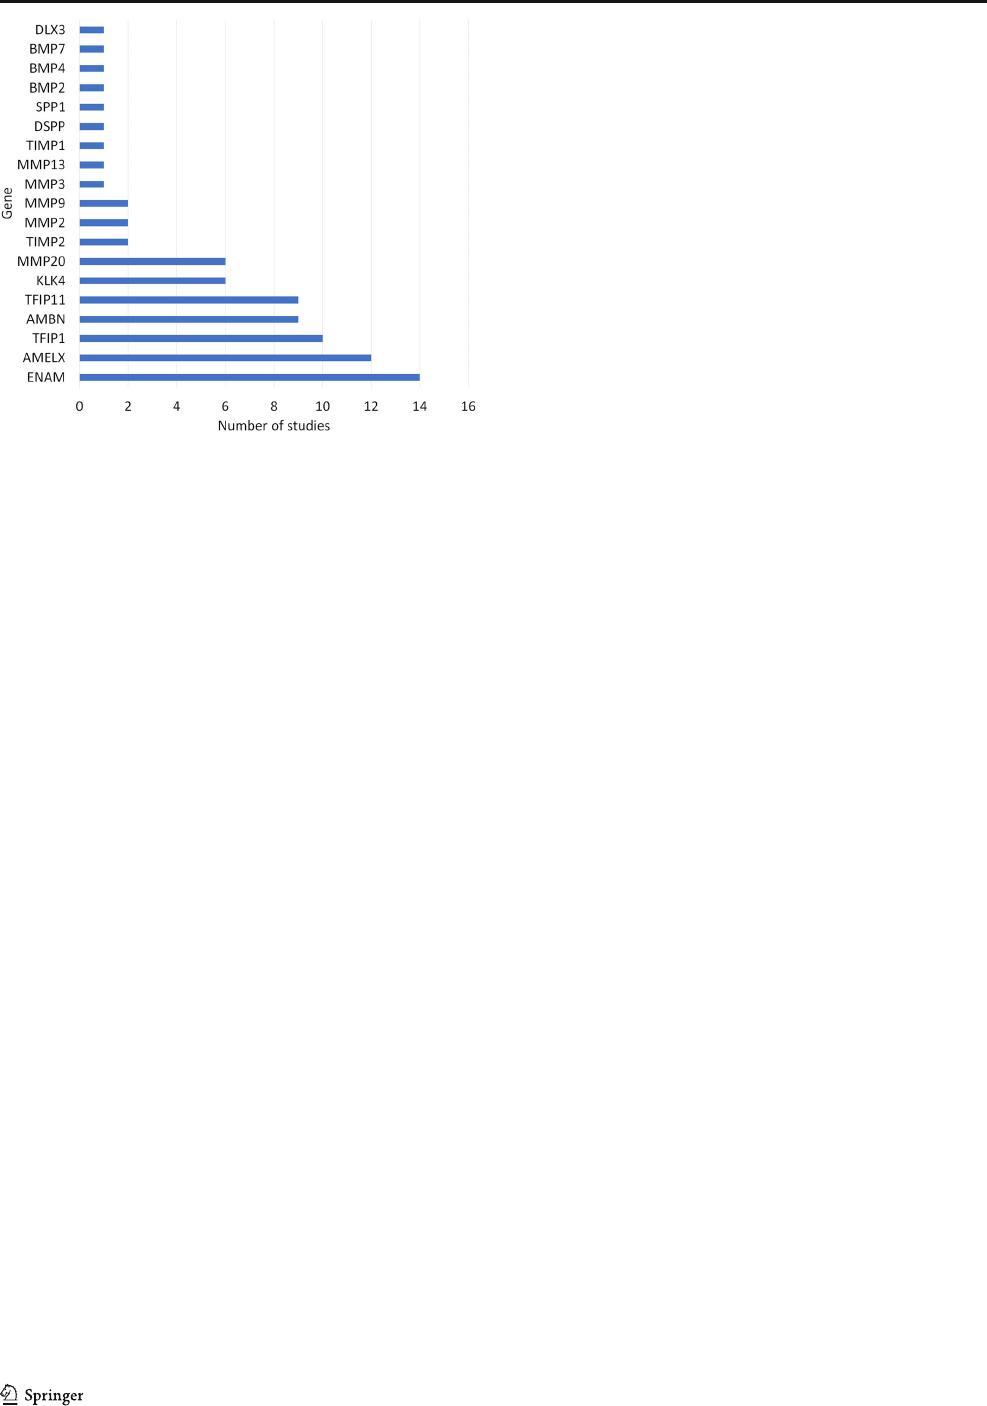
2). Single nucleotide polymorphisms of the enamelin (ENAM)
gene were investigated by 56% of the studies, followed by the
Amelogenin (AMELX) gene, which was investigated in 48%
of the studies (Fig. 3). Tables 4 and 5 show the main charac-
teristics of the studies included and the effects of polymor-
phism on dental caries. With regard to the evaluation of dental
caries, a significant variation was noted across the studies. The
main categorization was DFM/dfm = 0 vs. DFM/dfm ≥ 1.
Moreover, few studies reported power analysis nor did they
report the ethnicity of the studied population. Effect estimates
of some studies were not displayed, making it impossible to
calculate the odds ratio.
Risk of bias within the studies
Regarding the quality assessment, Table 3 displays the
Critical Appraisal Checklist for observational studies
(Joanna Briggs Institute). Most of the studies (52%) pre-
sented medium quality of assessment, w hile 44% present-
ed low quality.
Overview of single nucleotide polymorphisms
Forty-five single nucleotide polymorphisms were found by
investigating possible associations with dental caries experi-
ence. These SNPs were present in 18 genes. Most of the SNPs
were situated in intron region (57.5%), 2.3% in missense var-
iants, and 1.8% were synonymous. Furthermore, 80.9% of
SNPsarerelatedtoapossiblefunctionalimpactonprotein
coding according to the 1000 Genomes global population.
More details of SNPs and their functional impact on protein
are available in Table 4. No palindromic SNPs needed to be
removed. SNP rs496502 (G/T) was excluded due to inconsis-
tencies between the chromosome region described in the man-
uscript [34] and the database available at http://grch37.
ensembl.org/Homo_sapiens. Linkage disequilibrium was
observed between the single nucleotide polymorphism
present in DLX3, MMP20,andTFIP11; accordingly, SNPs
in disequilibrium were exclude d from the final an alysis.
Only the SNP with the strongest association was included in
the analyses.
Fig. 1 Prisma flow diagram
Clin Oral Invest
Results of individual studies
The main characteristics of the studies included in this
systematic review are available in supplementary material
S1. Overall, a high methodological variability (inclusion
criteria, caries diagnosis method and classi fication, age of
population, study design, and analytic approach) was ob-
served across the studies included, which evaluated a
large number of genes and polymorphisms. Moreover,
most of the polymorphisms were investigated by only
one study. These polymorphisms will also be described
in this section. In addition, some observations concerning
individual studies will be described here.
With regard to the allelic analysis, the allele C of poly-
morphis ms rs26094 2 8 (ENAM)(OR3.89[1.47–10.31]) in
the French population [22], allele T of rs3796703 (ENAM)
(OR 1.65 [1.11–2.45]) in the Chinese population [45],
allele G of rs198969 (KLK4) (OR 2.38 [1.30–4.35]) in
the Polish population [25], and allele G of rs2235091
(KLK4)(OR2.30[1.15–4.62]) also in the Polish popula-
tion [25] showed an association with high experience of
dental caries. On the other hand, allele T of rs34538475
(AMBN)(OR0.15[0.08–0.30]) in the Polish population
[25], allele T of rs2278163 (DLX3) (OR 0.30 [0.15–0.64])
in the Japanese population, evaluating individuals with a
high level of Mutans streptococci [36], and allele G of
rs2252070 (matrix metallopeptidase 13—MMP13)(OR
0.67 [0.51–0.89]) in the Brazilian population [32]showed
a protective effect for dental caries.
Considering the genotype analysis, the genotype GG of
rs198969 (KLK4) (OR 18.07 [2.10–155. 49]) in the Polish
population [25] was associated with high dental caries expe-
rience in this population [25]. However, the genotype CC of
rs2278163 (DLX3) (OR 0.07 [0.01–0.46]) in Japanese indi-
viduals with high levels of Mutans streptococci [36], GG of
rs198968 (KLK4) (OR 0.17 [0.03–0.94]) in the Turkish pop-
ulation [37], and GG of rs2252070 (MMP13
) (OR 0.54 [0.31–
0.93]) in the Brazilian population [32] showed a protective
effect against dental caries.
Some associations were also observed in respect of hetero-
zygote genotypes. The genotype CT of rs3796703 (ENAM)
(OR 1.61 [1.03–2.52]) in the Chinese population [45] and the
AG of rs198968 (KLK4) (OR 0.15 [0.03–0.82]) in the Turkish
population [37] showed an association with high dental caries
experience, while the genotype TC of rs5933871 (AMELX)
(OR 0.05 [0.01 – 0.53]) in the Korean population [28]and
TC of rs5934997 (AMELX) (OR 0.05 [0.01–0.52]) also in
the Korean population [28] were associated with low caries
experience.
Although few studies performed an analysis that consid-
ered the participants’ ethnicity, differences in genotype and
ethnicity were observed in the polymorphism rs17844 18
C/T (matrix metallopeptidase 20—MMP20); differences in
genotype distribution and caries experience were observed
in Caucasian children, but not in afro-descendants [ 31].
Cavallari et al. [42] performed an analysis of dominant and
additive models and observed different results. The allele A of
rs2978642 A/T (kallikrein-related peptidase 4—KLK4)inthe
dominant model (AA+AT Vs. TT) was associated with dental
caries (OR 3.48 [1.00–13.07]), while allele T in the additive
model (AA/TT/AT) (p = 0.15) and dominant model (OR 0.87
[0.50–1.52]) were not. Moreover, an influence of some geno-
types (tuftelin 1—TUFT1) was also identified interacting with
levels of S. mutans infection in children, leading to higher
levels of caries [26]. Similarly, when the sample was stratified
by water fluoridation, different results were observed: The
AMELX gene was associated with experience of dental caries
in non-fluoridated water. The genotype TT in rs5933871 and
TT in rs5934997 led to a higher risk for dental caries. Taking
all subjects into consideration, no associations were observed
[28].
Fig. 2 Studies grouped by year of
publication
Table 2 Excluded studies and reasons for exclusion
Studies Reason
Kuchler et al.
[19]
Not investigated the association between genetic
polymorphisms and dental caries
Saha et al. [20] Not report the specific polymorphism
Lu et al. [21]Review
Clin Oral Invest
Synthesis of results (meta-analysis)
Eighteen studies were included in the meta-analysis. The sum-
marization of individual and meta-analysis results (at least two
studies evaluating the same SNP), according to allele and
genotype models, is displayed in Table 5. To perform the
analysis pooled by gene, the results of single articles were
considered. Overall, 45 polymorphisms were included.
In the allele analysis, 38 polymorphisms were investigated.
Only the polymorphism rs134136 (TFIP11) situated in an
intron region with a potential impact on protein coding
showed an association with dental caries. The allele T of this
SNP was associated with a high experience of caries (OR 1.51
[1.02–2.22]).
For the analysis concerning genotypes, 43 polymorphisms
were included. No polymorphisms included in this analysis
showed significant association with caries in the meta-analysis,
considering the minor homozygote or heterozygote genotypes.
When several SNPs were pooled in order to test the asso-
ciation for the whole gene, the summarization of polymor-
phisms investigated in the DLX3 gene revealed an association
with dental caries experience (OR 0.67 [0.47–0.94]) in an
initial analysis that considered alleles, although this associa-
tion was lost after the exclusion of SNPs in linkage disequi-
librium (OR 0.53 [0.26–1.07]). In addition to the intron re-
gion, SNPs in the DLX3 gene were found in the promoter
region, 5′ UTR and 3′ UTR. After correction for linkage dis-
equilibrium, the gene TFIP11 was associated with caries ex-
perience after pooling all the polymorphisms (OR 1.64 [1.08–
2.50]). The AMBN and AMELX genes were also associated
with dental caries after pooling estimates for minor homozy-
gote genotypes (OR 0.37 [0.17–0.82] and OR 1.78 [1.23–
2.56], respectively). All the SNPs for both genes are situated
intronically.
Funnel plot results showed no significant publication bias
across the studies. Egger’s test confirmed these observations
(allele [p = 0.558] and genotype—homozygote [p =0.330]
and heterozygote [p =0.093]—analysis) (Fig. 4).
Discussion
To the best of our knowledge, this is the first systematic re-
view with meta-analysis investigating the association between
single nucleotide polymorphisms of tooth mineral tissues
genes and dental caries experience. The present findings
showed that some genes are linked to the occurrence of dental
caries. The meta-analysis sug gests that the genes TFI P11,
AMBN,andAMELX play an important role in dental caries,
thus confirming the positive influence of the SNPs of tooth
mineral tissue genes on dental caries experience.
The main association sustained by the meta-analysis was
theeffectalleleTofSNPrs134136(TFIP11), situated in an
intronic region, which showed an association with a high ex-
perience of dental caries. The gene of TFIP11 encodes a pro-
tein component of the spliceosome that promotes the release
of the lariat-intron during late-stage splicing. Therefore, poly-
morphisms in this gene can play a role in the amelogenesis
process resulting in a change in susceptibility to caries. A
recent study carried out in Turkey suggested that the genetic
variation in genes TFIP11 was linked to the hypomineraliza-
tion of tooth enamel and, hence, dental caries [34]. So, it
seems that genetic variations in this gene can alter the compo-
sition or organization of mineral tissue, such as enamel, and
influence the progression of dental caries [34], which could
explain the observed association of this gene with dental car-
ies. The functional role of rs134136 has not been explored by
experimental studies to date. So, the possibility of this poly-
morphism being in the linkage disequilibrium with another
functional one cannot be excluded. The AMELX gene was also
detected as being relevant for dental caries. It is involved in
biomineralization during tooth enamel development. SNPs in
this gene were associated with dental caries in the genotype
(homozygote) analysis, w hich highlights the relevance of
AMELX for susceptibility to dental caries. This important
function of AMELX on tooth development, together with the
ENAM gene, which encodes the largest protein involved in the
mineralization and structural organization of enamel, may ex-
plain the increasing interest in investigating SNPs related to
these genes. In fact, several studies have attempted to study
SNPs related to ENAM and AMLX genes.
Moreover, a substantial influence on the results was found
when grouping together the SNPs belonging to the AMBN
gene, which encodes the non-amelogenin enamel matrix pro-
tein ameloblastin, the second most abundant enamel matrix
protein expressed during amelogenesis. Furthermore, AMBN
is located in the calcium-binding phosphoprotein gene present
Fig. 3 Number of studies investigates by gene
Clin Oral Invest

in chromosome 4. Ameloblasts secrete mainly amelogenin
and ameloblastin, which quickly form a nucleus with the cal-
cium hydroxyapatite in enamel crystals. Subsequently, in the
maturation phase, the mineral deposition is completed [47].
Thus, the protein coded by this gene seems to be important for
the formation and mineralization of the enamel matrix. SNPs
in this gene can lead to dentinogenesis/amelogenesis
imperfecta [48]. In fact, genotype mutations in the AMBN
gene had influenced the complete transcription o f AMBN
protein in ameloblasts, being associated, therefore, with
amelogenesis imperfecta in human deciduou s teeth [49].
This previous finding corroborates the results observed in
the present systematic review, showing that alterations in
AMBN could change the normal mineral process of enamel
and, therefore, also have an influence on individuals’ caries
experience.
DLX3 has also been reported as being involved in tooth
mineralization in addition to having a relationship with imper-
fect amelogenesis. It is important to stress that a large number
of SNPs in DLX3 are present in promoter, 3 and 5 prime UTR
as well as the TF binding site, which might suggest an influ-
ence on the regulatory and coding protein process. However,
the present results have found a large number of SNPs in
linkage disequilibrium in the DLX3 gene, which could lead
to a biased outcome. Therefore, any SNP in linkage disequi-
librium reported by the authors was excluded from the final
analysis and a supplementary investigation was carried out
based on human genome (GRCh37.p13) in cases not
reported/investigated by authors. Therefore, a loss of associa-
tion in the grouped DLX3 results. This outcome may be ex-
plained by the proximity observed between investigated SNPs
of this gene, which do not appear to be independently segre-
gated. This highlights, for future studies, the compelling need
to investigate the linkage disequ ilibrium and report of the
findings.
Although the present findings have shown that some
SNPs related to the genes of tooth mineral f ormation are
linked to the etiology of dental caries, these results should
Table 3 Critical Appraisal Checklist for observational studies (Joanna Briggs Institute) in the systematic review according to the 10 items
NIH criteria
Study, year 1 2 3 4 5 6 7 8 9 10 Final score
Slayton et al. [26] −−+ −−+++−− Medium quality (4)
Deeley et al. [10] −−−+ − +++−− Medium quality (4)
Patir et al. [27] −−+ −−+++−− Low quality (3)
Kang et al. [28] −−−−−+ − ++− Low quality (3)
Olszowski et al. [29] −−+ −−+++−− Low quality (3)
Shimizu et al. [30] −−−−−−+ −−− Low quality (1)
Tannure et al. [31] −−−+ − + + + + + Medium quality (6)
Tannure et al. [32] −−−−−++++− Medium quality (4)
Wang et al. [33]++/+− + + + + + High quality (8)
Gasse et al. [23] −−++− +++−− Medium quality (5)
Jeremias et al. [34] −−−−−+++−− Medium quality (3)
Ergoz et al. [35] −−−−−+++−− Low quality (3)
Chaussain et al. [22]
−−++− +++−− Medium quality (5)
Ohta et al. [36]//−−−++−−+ Low quality (2)
Abbasoglu et al. [37] −−−+ − +++−− Medium quality (4)
Romanos et al. [38] −−−/+++− + + Medium quality (5)
Shaffer et al. [39]//+− / + + + + / Medium quality (5)
Antunes et al. [40] −−−−−++++− Medium quality (4)
Yildiz et al. [41] −−+ −−+++−− Medium quality (4)
Gerreth et al. [24] −−−−−−++−− Low quality (2)
Cavallari et al. [42] −−+ −−++−−− Low quality (3)
Filho et al. [43] −−+ −−++−−− Low quality (3)
Gerreth et al. [25] −−−−−−++−− Low quality (2)
Borilova Linhartova et al. [44] −−−−−+++−− Low quality (3)
Wang et al. [45] −−+ −−+++−− Medium quality (4)
Weber et al. [46] ++++++++
−− High quality (8)
+yes,− no, / unclear
Clin Oral Invest

Table 4 Description of single nucleotide polymorphism investigated in the present systematic review according genes
Gene Polymorphism Chromosomic position Variation Allele frequencies by populations (%)
a
Ancestral allele
African American Eas t Asian Europe South Asia Allele reference/allele effect used
AMBN rs34538475 (G/T) 4:71471176 Intron G: 72%
T: 28%
G: 82%
T: 18%
G: 99%
T: 1%
G: 76%
T: 24%
G: 91%
T: 9%
G/T T
rs4694075 (C/T) 4:71466914 Intron C33%
T: 67%
C: 58%
T: 42%
C: 46%
T54%
C: 53%
T47%
C: 57%
T: 43%
C/T T
AMELX rs17878486 (C/T) X:11313948 Intron T: 99%
C: 1%
T: 91%
C: 9%
T: 100%
C: 0%
T: 75%
C: 25%
T: 93%
C: 7%
C/T C
rs2106416 (C/T) X:11316742 Synonymous C: 72%
T: 28%
C: 89%
T: 11%
C: 98%
T: 2%
C: 78%
T: 22%
C: 87%
T: 13%
C/T C
rs5933871 (T/C) X:11313657 Intron T: 40%
C: 60%
T: 85%
C: 15%
T: 98%
C: 2%
T: 75%
C: 25%
T: 79%
C: 21%
T/C T
rs5934997 (T/C) X:11313733 Intron T: 41%
C: 59%
T: 85%
C: 15%
T: 98%
C: 2%
T: 75%
C: 25%
T: 79%
C: 21%
T/C C
rs6639060 (C/T) X:11316977 Synonymous NA NA NA NA NA C/T C
rs946252 (C/T) X:11313027 Intron T: 14%
C: 86%
T: 22%
C: 78%
T: 44%
C: 56%
T: 33%
C: 67%
T: 47%
C: 53%
C/T C
rs7052450 (T/C) X:11318948 Intron T: 14%
C: 86%
T: 22%
C: 78%
T: 44%
C: 56%
T: 33%
C: 67%
T: 47%
C: 53%
T/C T
BMP2 rs1884302 (T/C) 20:7106289 Intron T: 34%
C: 66%
T: 61%
C: 39%
T: 61%
C: 39%
T: 67%
C: 33%
T: 75%
C: 25%
T/C C
BMP4 rs2761887 (A/C) 14:54425052 Intron C: 40%
A: 60%
C: 47%
A: 53%
C: 47%
A: 53%
C: 41%
A: 59%
C: 34%
A: 66%
A/C C
BMP7 rs388286 (T/C) 20:55465424 TF binding site C: 63%
T: 37%
C: 55%
T: 45%
C: 51%
T: 49%
C: 52%
T: 48%
C: 45%
T: 55%
T/C C
DLX3 rs10459948 (T/G) 17:48072496 5 prime UTR G: 93%
T: 7%
G: 94%
T: 6%
G: 61%
T: 39%
G: 92%
T: 8%
G: 90%
T: 10%
T/G G
rs11656951 (T/C) 17:48072865 Promoter C: 77%
T: 23%
C: 86%
T: 14%
C: 52%
T: 48%
C: 80%
T: 20%
C: 82%
T: 18%
T/C C
rs12452477 (T/C) 17:48067953 3 prime UTR T: 61%
C: 39%
T: 21%
C: 79%
T: 30%
C: 70%
T: 16%
C: 84%
T: 34%
C: 66%
T/C T
rs16948563 (A/G) 17:48065141 TF binding site G: 91%
A: 9%
G: 86%
A: 14%
G: 82%
A: 18%
G: 94%
A: 6%
G: 87%
A: 13%
A/G G
rs2278163 (T/C) 17:48072426 5 prime UTR G: 67%
A: 33%
G: 77%
A: 23%
G: 32%
A: 68%
G: 76%
A: 24%
G: 60%
A: 40%
T/C A
rs2303466 (A/G) 17:48070878 Synonymous C: 85%
T: 15%
C: 87%
T: 13%
C: 53%
T: 47%
C: 81%
T: 19%
C: 82%
T: 18%
A/G C
rs3891034 (A/G) 17:48070225 Intron C: 85%
T: 15%
C: 87%
T: 13%
C: 53%
T: 47
C: 81%
T: 19%
C: 82%
T: 18%
A/G T
ENAM rs12640848 (A/G) 4:71506412 Intron A: 97%
G: 3%
A: 66%
G: 34%
A: 77%
G: 23%
A: 33%
G: 67%
A: 53%
G: 47%
A/G A
rs2609428 (T/C) 4:71508869 Missense T: 87%
C: 13%
T: 99%
C: 1%
T: 100% T: 99%
C: 1%
T: 100% T/C T
rs3796703 (C/T) 4:71509314 Missense C: 100%
T: 0%
C: 100%
T: 0%
C: 96%
T: 4%
C: 99%
T: 1%
C: 99%
T: 1%
C/T C
Clin Oral Invest

Table 4 (continued)
Gene Polymorphism Chromosomic position Variation Allele frequencies by populations (%)
a
Ancestral allele
African American Eas t Asian Europe South Asia Allele reference/allele effect used
rs3796704 (A/G) 4:71509431 Missense G: 62%
A: 38%
G: 90%
A: 10%
G: 98%
A: 2%
G: 95%
A: 5%
G: 95%
A: 5%
A/G G
KLK4 rs198968 (A/G) 19:51413328 Intron A: 15%
G: 85%
A: 22%
G: 78%
A: 71%
G: 29%
A: 17%
G: 83%
A: 37%
G: 63%
A/G G
rs198969 (C/G) 19:51413802 Intron G: 47%
C: 53%
G: 35%
C: 65%
G: 84%
C: 16%
G: 49%
C: 51%
G: 59%
C: 41%
C/G G
rs2235091 (A/G) 19:51410471 Intron A: 56%
G: 44%
A: 64%
G: 36%
A: 84%
G: 16%
A: 61%
G: 39%
A: 60%
G: 40%
A/G A
rs2242670 (A/G) 19:51412315 5 prime UTR A: 51%
G: 49%
A: 51%
G: 49%
A: 80%
G: 20%
A: 45%
G: 55%
A: 64%
G: 36%
A/G NA
rs2978642 (A/T) 19:51413906 Intron A: 36%
T: 64%
A: 72%
T: 28%
A: 78%
T: 22%
A: 75%
T: 25%
A: 69%
T: 31%
A/T A
rs2978643 (C/G) 19:51412326 5 prime UTR C: 59%
G: 41%
C: 74%
G: 26%
C: 91%
G: 9%
C: 75%
G: 25%
C: 71%
G: 29%
C/G NA
MMP13 rs2252070 (A/G) 11:102826539 Open chromatin region C: 28%
T: 72%
C: 35%
T: 65%
C: 50%
T: 50%
C: 30%
T: 70%
C: 41%
T: 59%
A/G T
MMP2 rs243847 (T/C) 16:55523998 Intron T: 81%
C: 19%
T: 71%
C: 29%
T: 59%
C: 41%
T: 59%
C: 41%
T: 52%
C: 48%
T/C T
rs243865 (C/T) 16:55511806 Intron C: 97%
T: 3%
C: 76%
T: 24%
C: 90%
T: 10%
C: 74%
T: 26%
C: 88%
T: 12%
C/T C
MMP20 rs1711437 (G/A) 11:102465226 Intron C: 75%
T: 25%
C: 59%
T: 41%
C: 64%
T: 36%
C: 57%
T: 43%
C: 41%
T: 59%
G/A C
rs1784418 (C/T) 11:102484396 Intron C: 74%
T: 26%
C: 56%
T: 44%
C: 56%
T: 44%
C: 55%
T: 45%
C: 41%
T: 59%
C/T C
rs1784418 (G/A) 11:102484396 Intro n C: 74%
T: 26%
C: 56%
T: 44%
C: 56%
T: 44%
C: 55%
T: 45%
C: 41%
T: 59%
G/A C
MMP3 rs522616 (A/G) 11:102715048 Intergenic region T: 80%
C: 20%
T: 56%
C: 44%
T: 65%
C: 35%
T: 77%
C: 23%
T: 56%
C: 44%
A/G T
MMP9 rs17576 (A/G) 20:44640225 Missense A: 66%
G: 34%
A: 77%
G: 23%
A: 26%
G: 74%
A: 62%
G: 38%
A: 45%
G: 55%
A/G A
TFIP1 rs3790506 (A/G) 1:151538366 Intron G: 91%
A: 9%
G: 64%
A: 36%
G: 75%
A: 25%
G: 74%
A: 26%
G: 63%
A: 37%
A/G A
rs3828054 (A/G) 1:151512895 Missense A: 84%
G: 16%
A: 90%
G: 10%
A: 95%
G: 5%
A: 89%
G: 11%
A: 89%
G: 11%
A/G A
rs7526319 (C/T) 1:151524558 Intron T: 63%
C: 37%
T: 28%
C: 72%
T: 12%
C: 88%
T: 36%
C: 64%
T: 33%
C: 67%
C/T T
TIMP1 rs4898 (T/C) X:47444985 Synonymous T: 52%
C: 48%
T: 58%
C: 42%
T: 54%
C: 46%
T: 54%
C: 46%
T: 50%
C: 50%
T/C C
TIMP2 rs7501477 (G/T) 17:76926276 TF binding site G: 70%
T: 30%
G: 89%
T: 11%
G: 87%
T: 13%
G: 89%
T: 11%
G: 94%
T: 6%
G/T G
TUFT1 rs2337360 (A/G) 1:151542127 Intron G: 75%
A: 25%
G: 75%
A: 25%
G: 90%
A: 10%
G: 64%
A: 36%
G: 67%
A: 33%
A/G NA
rs4970957 (A/G) 1:151517388 Intron A: 98% A: 70% A: 53% A: 81% A: 81% A/G A
Clin Oral Invest

be interpreted with caution. It is importa nt to highlight the
significant methodological differences observed amongst
the stu dies. The first point is related to the ethnicity of
samples investigated and population stratification. The
population may be a problem for genetic studies, leading
to bias in the estimates of association. A very small por-
tion of the studies conducted are adjusted f or any type of
ancestry information. Important differences between allele
frequencies and population ethnicity have been identified
when reported SNPs were investigated in a supplementary
database. This emphasizes the need to perform checks on
this variable to decrease possible bias in the studies. The
other limitation relating to different ethnicities relates to
the analysis grouped together by gene, in which the esti-
mates were combined regardless of the ancestry back-
ground of the population. It is already known that genetic
effect sizes may differ among pop ulations, at least for
some traits, and allele heterogeneity could have an impor-
tant impact on the potential for generalizing about associ-
ation results across populations. Failures with transferabil-
ity findings have been clearly demonstrated for polygenic
risk scores [50]. So, the esti mates for polymorphism s a nd
genes should be carefully considered.
Despite the important limitations observed, no publica-
tion bias was identified through the funnel plot and was
complemented by the Egger’s test. This result can be ex-
plained by the fact that this topic is extremely new and
negative results (no associations) are frequently pub-
lished. In addition, many articles have carried out inves-
tigations on different SNPs, hence, some SNPs being pub-
lished with association and some without, decreasing pos-
sible publication bias. Furthermore, a lack of information
was observed in some studies, in which only the p value s
were reported, precluding the inclusion of these studies in
the meta-analysis. The use and the reporting of appropri-
ate descriptions and estimates are essential for making
comparisons between studies. Similarly, studies have used
different alleles as a reference in the analysis. To circum-
vent this situation, the reference SNP was standardized as
the allele most commonly found in most of the studies
included.
Moreover, most of the papers were of medium quality and
had lower scores in the “sample representativeness of the tar-
get population” and “participants recruited in an appropriate
way,” which reflects studies with samples that are not repre-
sentative of the population. Several cut-off points on caries
categorizations were performed, despite DMF/dmf = 0 vs.
DMF/dmf ≥ 1 being chosen (when available) for inclusion
in the analyses. However, some studies used dmfs ≥ 4com-
pared to dmfs = 0, taking into consideration the severity of
dental caries [26]. This wide variation of cut-off points may
lead to a significant bias in the results. As a counterpoint to
this observation, Shimizu et al. [30] reported variations in cut-
Table 4 (continued)
Gene Polymorphism Chromosomic position Variation Allele frequencies by populations (%)
a
Ancestral allele
African American Eas t Asian Europe South Asia Allele reference/allele effect used
G: 2% G: 30% G: 47% G: 19% G: 19%
TFIP11 rs5997096 (C/T) 22:26895957 Intron T: 66%
C: 34%
T: 52%
C: 48%
T: 50%
C: 50%
T: 44%
C: 56%
T: 63%
C: 37%
C/T T
rs134136 (C/T) 22:26899474 Intron T: 25%
C: 75%
T: 35%
C: 65%
T: 33%
C: 67%
T: 35%
C: 65%
T: 49%
C: 51%
C/T T
NA not available
a
Based on Human (GRCh37.p13), available on: http://grch37.ensembl.org/Homo_sapiens
Clin Oral Invest
