
367
Mater. Res. Soc. Symp. Proc. Vol. 1475 © 2012 Materials Research Society
DOI: 10.1557/opl.2012.
Determining hydraulic properties of concrete and mortar by inverse modelling
Sébastien Schneider
1
, Dirk Mallants
1
, Diederik Jacques
1
1
Performance Assessments Unit, Belgian Nuclear Research Centre SCKCEN, 2400 Mol,
Belgium.
ABSTRACT
This paper presents a methodology and results on estimating hydraulic properties of the
concrete and mortar considered for the near surface disposal facility in Dessel, Belgium,
currently in development by ONDRAF/NIRAS. In a first part, we estimated the van parameters
for the water retention curve for concrete and mortar obtained by calibration (i.e. inverse
modelling) of the van Genuchten model [1] to experimental water retention data [2]. Data
consisted of the degree of saturation measured at different values of relative humidity. In the
second part, water retention data and data from a capillary suction experiment on concrete and
mortar cores was used jointly to successfully determine the van Genuchten retention parameters
and the Mualem hydraulic conductivity parameters (including saturated hydraulic conductivity)
by inverse modelling.
WATER RETENTION CURVES OF CONCRETE AND MORTAR
Concrete constitutes one of the main materials used in engineered barriers limiting
radionuclide leaching to the environment, especially in case of near surface disposal of low-level
radioactive waste. It is then crucial to accurately determine the (unsaturated) flow and transport
properties of the envisaged concrete components, as such properties have an effect on the long-
term performance of engineered barriers, including limiting water flow and providing for
retardation of contaminant migration. Also, the coupling between flow and transport properties is
important to develop defensible models of physical and chemical degradation of concrete. In this
paper methodology and results on estimating hydraulic properties of the concrete and mortar
considered for the near surface disposal facility in Dessel, Belgium, are presented.
Experimental water retention data
Water retention curves have been estimated for the concrete and mortar samples referenced,
respectively, as C-15-A and M1 [2]. The concrete C-15-A is a mix of CEM I, calcium carbonate,
calcareous aggregates and superplasticizer, whereas the mortar M1 is a mix of CEM III, silica
fume, limestone and superplasticizer. Absorption and desorption isotherms have been determined
by letting 50-mm diameter and 5-mm thick concrete samples equilibrate in a closed chamber
until constant weight (different humidity levels were controlled by different saturated aqueous
solutions). In total 11 different controlled atmospheres have been imposed by using saturated
aqueous solutions covering a relative humidity range from 11.3% to 97.6%. All equilibria were
reached in rooms having a controlled temperature fixed to 21°C. In order to determine the water
retention curves, relative humidity conditions were changed into matric potential P
c
[Pa] in a
capillary tube using the Kelvin-Laplace relationship:
601
368
ln
cw
PRT HRM
U
(1)
where M is the atomic mass of water (0.018 kg mol
-1
), R is the universal gas constant (8.314 J K
-
1
mol
-1
), T is the absolute temperature (K),
U
w
is the density of water (998 kg m
-3
at 20°C ), and
HR (%) is the relative humidity of condensation. Retention curve data obtained from [2],
originally expressed as degree of saturation S
e
(dimensionless) versus relative humidity (%),
were converted in volumetric water content
T
(cm
3
cm
-3
) versus pressure head h (m) data, using ș
=
I
×S
e
with the porosity
I
cm
3
cm
-3
measured independently from weight loss of saturated
samples, and S
e
= (ș - ș
r
)/(ș
s
– ș
r
) is degree of saturation (-). The mean porosity
I
was 0.109 and
0.185 cm
3
cm
-3
for concrete (type C-15-A) and mortar (type M1) (3 samples), respectively.
van Genuchten – Mualem hydraulic function
The van Genuchten – Mualem expression for the water retention curve
T
(h)
is [1]:
() ( ) 1
m
n
rsr
hh
TTTT D
(2)
where
T
r
is the residual water content (cm
3
cm
-3
),
T
s
is the saturated water content (cm
3
cm
-3
),
and
D
(m
-1
), n, and m are empirical parameters. When fitting
T
(h) data independently, the
assumption m =1-1/n is used for Eq. (2). The following van Genuchten parameters were
optimized with the RETC software [5] when using the water content - pressure head data:
T
r
,
T
s
,
D
, and n (m was related to n). Independent values for m and n are fitted in this study for the
Mualem hydraulic conductivity relationship K(h) by linking HYDRUS-1D with a global genetic
search algorithm:
>@
2
/1
11
m
ml
s
SeSeK=hK
(3)
where K
s
is the saturated hydraulic conductivity (m s
-1
), l (-)
is a factor that accounts for the pore
connectivity and tortuosity estimated by Mualem [3] to be 0.5 as an average of many soils.
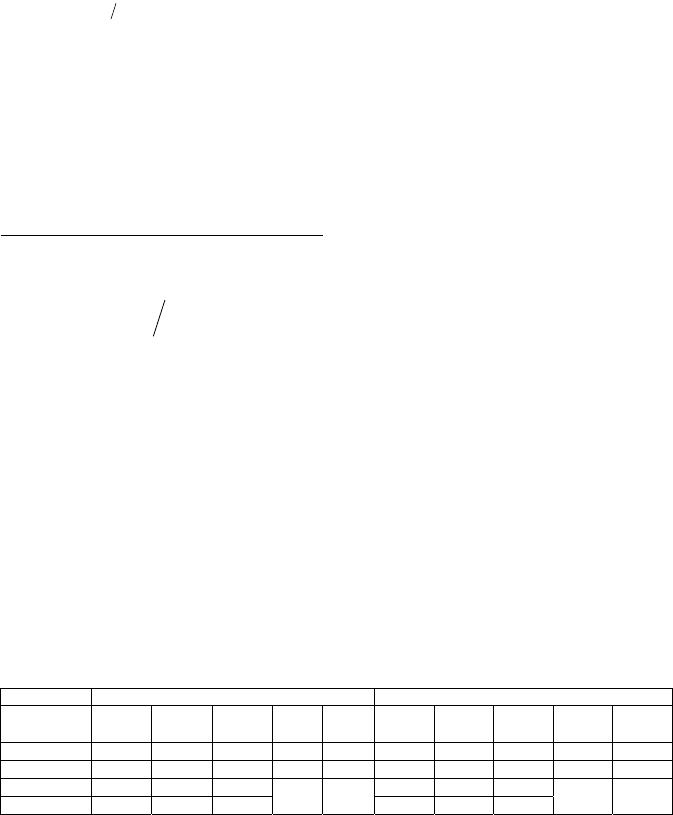
Table I. Fitted van Genuchten parameters based on RETC
[5]. Parameter n (dimension-less) was
optimized separately for adsorption/desorption data (case 1), or a single n was optimized for both
adsorption/desorption data (case 2). R
2
= coefficient of determination.
Data Concrete C-15-A Mortar M-1
ș
r
(cm
3
cm
-3
)
ș
s
(cm
3
cm
-3
)
Į
(m
-1
)
n
(-)
R
2
ș
r
(cm
3
cm
-3
)
ș
s
(cm
3
cm
-3
)
Į
(m
-1
)
n
(-)
R
2
Absorption-1 0.000 0.078 7.12E-4 1.521 0.969 0.000 0.100 2.91E-4 1.554 0.953
Desorption-1 0.000 0.080 1.46E-4 2.201 0.989 0.008 0.101 1.02E-4 2.592 0.988
Absorption-2 0.000 0.090 2.48E-4
1.917 0.969
0.000 0.162 1.64E-4
1.937 0.954
Desorption-2 0.000 0.107 1.83E-4 0.000 0.179 1.29E-4
369
DETERMINING VAN GENUCHTEN PARAMETERS BY INVERSE MODELLING
Absorption and desorption water retention curves display hysteresis: the water desorption
branch is different from the water absorption branch. The retention curves were first fitted using
a separate n parameter for each branch (case 1). Because HYDRUS-1D will be used in the fitting
of the capillary suction data, with the restriction that its hysteresis model uses one n-parameter
for both branches, the retention curve was also fitted using a single n-parameter for desorption
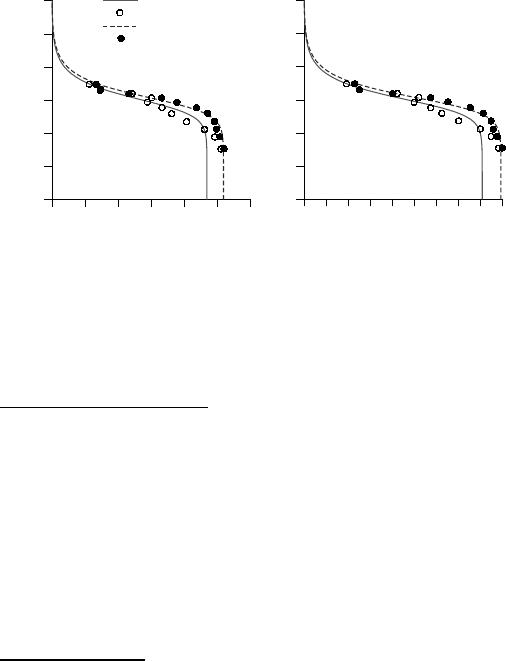
and adsorption branches. Figure 1 and Table I present the optimized water retention curves and
the hydraulic parameter values, respectively. The hysteresis model shows a good fit between data
and model with differences between predictions and data which never exceed 0.01 cm
3
cm
-3
.
0 0.02 0.04 0.06 0.08 0.1 0.12 0.14 0.16 0.18
10
1
10
2
10
3
10
4
10
5
10
6
10
7
0 0.02 0.04 0.06 0.08 0.1 0.12
10
1
10
2
10
3
10
4
10
5
10
6
10
7
absorption
absorption data
desorption
desorption data
(a)
(b)
Water content (-)
Water content (-)
Pressure head (m)
Figure 1. Water retention curves for concrete C-15-A (a) and mortar M1 (b). A single-n
parameter is used (case 2).
DETERMINING HYDRAULIC PROPERTIES BY INVERSE MODELLING AND
ABSORPTION EXPERIMENTS
Experimental setup and data
A capillary suction experiment has been performed on three circular specimens (15-cm
diameter and 5-cm thickness) for both concrete C-15-A and mortar M1. Details of experimental
conditions are given in [2]. Prior to the suction test, specimens had been equilibrated with an
atmosphere having 54% of relative humidity. The bottom part of the specimen has been put in
contact with the water level reaching until 0.005 m above the specimens' bottom surface,
whereas the other surfaces of the specimens have been covered with plastic to make them
impermeable. By measuring the weight of the samples at different times, the evolution of water
absorbed by capillary suction was recorded. After 35 days, the experiment has been stopped. The
samples were not fully saturated at the end of the experiment as was evident from the shape of
the absorption curve.
Modelling approach
The numerical modelling approach aims at mimicking the experimental results obtained
during the capillary suction test. The goal is to numerically reproduce the cumulative water flux,
370
which corresponds to the water that penetrates in the sample by capillary suction. In the
meanwhile, parameters should also describe correctly the independently obtained retention
curves (wetting curve). Therefore an inverse procedure will be implemented in order to optimize
both the retention curve and the capillary suction test data. The previously fitted van Genuchten
parameters for the wetting curve will be used to define parameter ranges for use in genetic
algorithm-based inverse modelling.
The HYDRUS-1D software package [7] was used for simulating the one-dimensional
unsaturated water flow experiment. The main characteristics of the conceptual model are
summarized as follows: as lower boundary condition a constant pressure head equal to +0.005 m.
This boundary condition reflects the fact that the sample has been immersed in water by 5 mm.
As upper boundary condition a zero flux (specimen covered with plastic). Furthermore, a
spatially uniform initial pressure head condition in the entire sample was considered. It was
calculated in two steps: (1) by determining the initial saturation degree according to the quantity
of water infiltrated in the sample at the end of the absorption experiment (measured by
differences of final and initial weight) and the knowledge of the porosity, (2) by calculating the
initial pressure head according to the initial saturation degree obtained from step (1) and the
VGM parameters from Table I.
Hydraulic parameters were estimated using an inverse modelling approach in which
hydraulic parameters that describe the K(h) relationship are optimized (eq. (4)). We chose to
optimize
T
r
,
D
, n, m, K
s
, and l, while keeping
T
s
fixed and equal to the independently measured
total porosity. Note that parameter m has also been optimized as this provides larger flexibility in
the description of the
T
(h) and K(h) relationships. Because two types of data (i.e. flux and water
content) are jointly taken into account in this optimization process, the following formulation of
the objective function, OF, was used:
¦¦
N
=j
j
j
M
=i
i
i
w
+qqw=OF
1
2
1
2
1
TT
(4)
where M and N represent the number of measurements of cumulative flux and water retention
data (i.e. water content) respectively, q
i*
and q
i
are the ith measured and predicted cumulative
flux, respectively,
T
j*
and
T
j
are the jth measured and predicted water content, respectively, and w
is a weighting factor introduced in order to give both data sets a similar weight, which is defined
as:
11
NM
j
i
j= i=
w= q
T
¦¦
(5)
To cope with the limitations of local search algorithms such as gradient-based methods (e.g. the
Levenberg-Marquardt method), we performed the optimization by linking HYDRUS-1D with a
global search algorithm, i.e. a genetic algorithm [8, 9]. This allows to determine the actual
minimum of complex non-linear optimisation problems.
MODELLING RESULTS
Calculated cumulative water fluxes based on inverse modelling are displayed in Figure 2.
Whereas at the end of the experiment (day 35) full saturation is not reached in the sample,
numerical simulations predict that saturation is reached for the concrete after 12 days and after
371
4.5 days for the mortar. The observation that the simulated equilibrium is much quicker reached
than the measured one (provided that the measurements are in equilibrium, which is very
unlikely to be true as we discussed later) is in line with similar observations reported by Hall
[10], i.e. that long-term (days+) water transfer by unsaturated flow is likely to be slower than
predicted from material property values obtained in short term experiments. For such long-term
tests additional processes other than water absorption by diffusion may be at work, including
chemomechanical processes modifying the pore structure of the concrete.
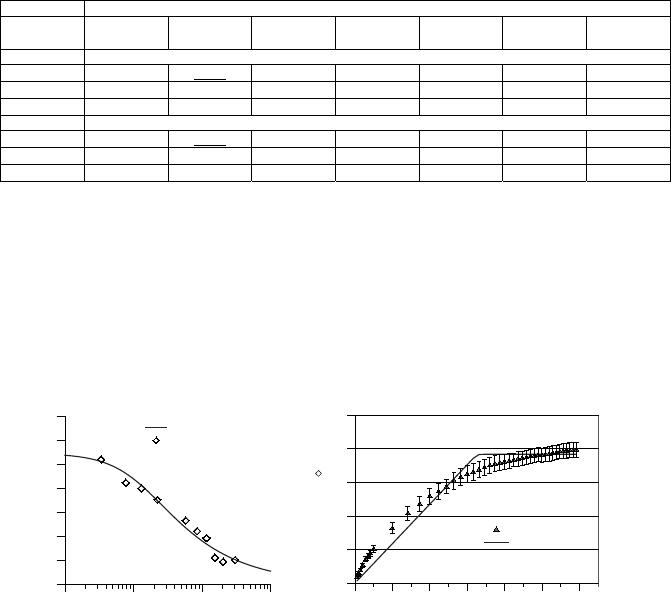
Table II. van Genuchten-Mualem parameter values estimated by inverse modelling using
HYDRUS-1D.
T
s
fixed at measured porosity, i.e. 0.109 and 0.185 cm
3
cm
-3
for concrete C-15-A
and mortar M1, respectively. Parameter m was optimized independently from n. Lower and
upper bound are bounds imposed during optimization.
van Genuchten-Mualem hydraulic parameters
ș
r
(
cm
3
cm
-3
)
ș
s
(
cm
3
cm
-3
)
Į
(
m
-1
)
n
(
-
)
m
(-)
K
s
(m s
-1
)
l
(-)
Concrete (R
2
=0.971 for water retention data; R
2
=0.983 for cumulative flux data)
Best fit
0.000 0.109 7.65E-4 1.307 0.404 5.67E-13 35.2
Lower bound
0.000 - 1.00E-4 1.050 0.200 1.00E-13 -3.0
Upper bound
0.070 - 1.00E-3 2.000 0.500 1.00E-11 50.0
Mortar (R
2
=0.956 for water retention data; R
2
=0.977 for cumulative flux data
Best fit
0.000 0.185 3.23E-4 1.217 0.435 5.87E-14 -3.0
Lower bound
0.000 - 1.00E-4 1.050 0.200 1.00E-14 -3.0
Upper bound
0.070 - 1.00E-3 2.000 0.500 1.00E-14 50.0
Optimized VGM parameter values are provided in Table II, and the corresponding water
retention curve for concrete is plotted in Figure 2. It appears that parameter l is estimated to have
values close to or equal to the parameter bounds: for the concrete l is equal to 35.2 which is very
high. For soils l values significantly different from 0.5 have also been reported [11], although a
different functional form of the Mualem model is used here (Eq. (3)). High values of l indicate
that the unsaturated hydraulic conductivity decreases very strongly when moving away from
saturation. For the mortar l is equal to -3.0, i.e. the imposed parameter bound. The estimated
saturated hydraulic conductivity K
s
is 5.67×10
-13
m/s and 5.87×10
-14
m/s for the concrete C-15-A
and the mortar M1, respectively. These are consistent with values found in the literature for
similar types of concrete and mortar (e.g. [12]).
10
2
10
3
10
4
10
5
Pressure head (m)
0.00
0.02
0.04
0.06
0.08
0.10
0.12
0.14
Water content (-)
inverse modelling
WR data
0123456
Time (day
0.5
)
0.00
0.05
0.10
0.15
0.20
0.25
Cumulative flux (cm)
measurements
inverse modelling
R
2
=0.983
R
2
=0.971
Figure 2. (a) Measured and simulated water retention, (b) cumulative measured and simulated
fluxes by inverse modelling (vertical error bars = one standard deviation) for concrete C-15-A.
372
As concerns the initial condition, it is interesting to notice that the initial pressure head,
which was derived from the optimized hydraulic parameters and the estimated saturation degree
of 0.646 for concrete C-15-A is equal to 2100 m. The latter value is far from the one derived
from Eq. (2) when applying a relative humidity of 54% (as in the capillary absorption test), i.e. h
= 8500 m. This is an indication that the samples did not yet reach an equilibrium moisture
content nor a capillary pressure commensurate with the imposed vapour pressure boundary
condition, and hence that a much longer equilibration time is needed.
CONCLUSIONS
Of significant importance to long-term prediction of water and radionuclide migration in
concrete is the choice of a suitable hydraulic model and the determination of accurate
unsaturated hydraulic parameters. In a first part, we estimated the van Genuchten retention curve
parameters using experimental moisture retention data encompassing both the wetting and drying
branch. In a second part, numerical simulations of a capillary absorption experiment were
performed. Results showed a satisfactorily agreement between model and data when the van
Genuchten-Mualem parameters (
D
, n,m,
T
r
, K
s
, l) were fitted simultaneously to both water
retention data and capillary absorption data. Because optimized K
s
values resulted in a good
description of the capillary absorption test and are in agreement with literature values for similar
concrete and mortar, the K
s
values (5.67×10
-13
m/s and 5.87×10
-14
m/s for concrete and mortar,
respectively) are considered appropriate for use in saturated-unsaturated flow calculations.
ACKNOWLEDGMENTS
The authors acknowledge M. Th. van Genuchten for providing useful comments on a this
paper. Data was kindly provided by the Eduardo Torroja Institute for Construction Science,
Madrid, Spain. This work has been performed as part of the project on disposal of category A
waste – short-lived low and intermediate level waste (LILW-SL) – carried out by
ONDRAF/NIRAS, the Belgian Agency for Radioactive Waste and enriched Fissile Materials.
REFERENCES
1. M.Th.van Genuchten, Soil Sci. Soc. Am. J., 44, 892 (1980).
2. ONDRAF/NIRAS, NIROND-TR 2009-17 E V1 (2009)
3. Y. Mualem, Water Resources Research, 12, 513 (1976).
4. C. Maierhofer, R. Arndt, and M. Röllig, Infrared Physics & Technology, 49, 213, (2007).
5. M.Th. van Genuchten, F.J. Leij, and S.R. Yates, EPA Report 600/2-91/065, U.S. Salinity Laboratory, USDA,
ARS, Riverside, California, (1991).
6. M.L. Rockhold, M.J. Fayer and P.R. Heller, Physical and hydraulic properties of sediments and engineered
materials associated with grouted double-shell tank waste disposal at Hanford. PNLL Richland, Washington,
(1993).
7. J. âLPĤQHN 0 âHMQD DQG 0 7K YDQ *HQXFKWHQ 7KH +<'586-1D software for simulating the one-
dimensional movement of water, heat, and multiple solutes in variably saturated media. Dep. Environ. Sciences,
UCR, Riverside, CA, 281 pp. (2009).
8. S. Schneider, GENAPAC – A genetic algorithm for parameter calibration. SCK•CEN report ER-140, (2010).
9. D. E. Goldberg, and K. Deb, in: Foundations of Genetic Algorithms, edited by Rawlins, G.J.E., Morgan
Kaufmann Publishers, San Mateo, CA, p. 69, (1991).
10. C. Hall, Cement and Concrete Research, 37, 378 (2007).
11. M.G. Schaap, F.J. Leij, Soil Sci. Soc. Am. J., 64, 843 (2000).
12. V. Baroghel-Bouny, M. Mainguy, T. Lassabatere, and O. Coussy, Cement and Concrete Research 29, 1225
(1999).
