
Delineation of Potential Sites for Water Harvesting Structures
using Remote Sensing and GIS
M. Girish Kumar
.
A. K. Agarwal
.
Rameshwar Bali
Received: 12 February 2008 / Accepted: 20 September 2008
Keywords Rain water harvesting site suitability
.
Remote sensing
.
GIS
M.G. Kumar
1
.
A.K. Agarwal
2
.
R. Bali
1
()
1
Centre of Advance Study in Geology,
University of Lucknow,
Lucknow – 226007, India
2
Remote Sensing Application Centre,
U.P. Janakipuram,
Lucknow – 226021, India
e-mail: [email protected]
Abstract Availability of groundwater varies spatially
and temporally depending upon the terrain. The
scarcity of water affects the environmental and
developmental activities of an area. Construction of
small water harvesting structures across streams/
watersheds is gaining momentum in recent years. In
the present study, potential sites for construction of
rainwater harvesting structures in the Bakhar
watershed of Mirzapur District, Uttar Pradesh, India
have been identified by using remote sensing
and GIS techniques. Various thematic maps such
as Landuse/Landcover, geomorphology and
lineaments, etc. were prepared using remote sensing.
These layers along with geology and drainage were
integrated using GIS techniques to derive suitable
water harvesting sites. Each theme was assigned a
weightage depending on its influence on ground
water recharge (for example weightages 20,18,15,25,25
and 0 were assigned to geomorphology, landuse,
geology, lineament, drainage and road and villages
respectively). Each class or unit in the map was
assigned a knowledge based ranking of one to four
depending on its significance in storage and
transmittance of groundwater, and these values were
multiplied with layer weightage to form score. The
average score for excellent region is greater than 200,
for good 121 to 200, for moderate 81 to 121 and the
other polygon having value less than 80 (excluding
zero) were assigned to poor category. The final map
showing different categories of suitability sites for
water harvesting structures such as Check dams,
J. Indian Soc. Remote Sens. (December 2008) 36:323–334
Photonirvachak
123
RESEARCH ARTICLE

324
J. Indian Soc. Remote Sens. (December 2008) 36:323–334
Contour bunding, Recharge pits, Wells and Contour
trenching have been suggested.
Introduction
Water, one of the most essential resources in our
day-to-day life is depleting faster in rural as well as
urban areas mainly because of increase in
agricultural and domestic demands. In water
resources planning, ground water is attracting an
ever-increasing interest due to scarcity of good
quality sub-surface water and growing need of water
for domestic, agricultural, and industrial uses. In a
densely populated country like India, ground-water
resource is in high demand. Continuous failure of
monsoon, increasing demand and over exploitation
leads to depletion of ground-water level, which in
turn tends to increase both the investment and the
operational costs. This problem could be sorted out
to certain extent by artificially recharging the
potential aquifers. In hard rock terrains, availability
of groundwater is of limited extent. Occurrence of
groundwater in such rocks is essentially confined to
fractured and weathered horizons. Efficient
management and planning of groundwater in these
areas is of the utmost importance. Extensive hydro-
geological studies have been carried out by several
workers in delineating groundwater potential zones
in hard rock terrain (Agarwal et al., 1992; Rao et al.,
2001). For delineating the groundwater potential/
prospective zones, Geographical information system
(GIS) has been found to be an effective tool. In
recent years, use of satellite remote sensing data
along with GIS, topographical maps, collecteral
information and limited field checks, has made it
easier to establish the base line information on
groundwater prospective zones (Saraf and Jain,
1993; Krishnamurthy et al., 2000; Agarwal et al.,
2004). Most of the above studies were mainly carried
out to identify areas having groundwater potential,
but very little work has been done to identify zones
suitable for artificial recharge (Saraf and Choudhury,
1998; Agarwal et al., 2005). Like delineation of
groundwater potential/prospect zones, delineation of
potential sites for artificial recharge is also governed
by several factors such as geology, geomorphology,
lineaments, landuse/cover, roads map, village
location map, permeability, soil depth, drainage
intensity, soil texture, water holding capacity and
physiography. The overall methodology involves
extraction and generation of various thematic maps
either through satellite images or through existing
records and field survey maps. The next step deals
with classification of all these parameters into
‘suitable’ classes and assignment of ‘suitable’ ranks
to these classes, weights to the parameters, and
finally integration of all the ranked and weighed
parameters in a GIS environment. Subsequently, the
area is classified into poor, moderate, good and
excellent sites suitable for the rainwater harvesting.
Study area
The present studies have been carried out in
Bakhar watershed lying between Latitude 24
0
45' to
24
0
56' N and Longitude 82
0
29' to 82
0
56' E falling in
the Survey of India (SOI) Topographical sheet No.
63 L/9 and 63 L/13 (Fig. 1), with an area of around
560 km
2
. The average annual rainfall with in the
watershed is 747.52 mm and the maximum average
annual temperature is 32.1
0
C (Anonymous, 2003).
The topography of the study area, in general, is
gently undulating dissected plateau. The Quaternary
sediments are deposited over the sandstones. The
present drainage network of the Bakhar watershed
has been delineated using satellite data. In the
Sandstone terrain, the drainage pattern is dendritic
and in the Quaternary sediments region the
drainages are sub-dendritic to sub-parallel. It is
observed that in the Bakhar watershed, new
drainages have come up and some streams have
changed their course in the northern (Gopalpur) and

325
J. Indian Soc. Remote Sens. (December 2008) 36:323–334
eastern (Rajgarh) side. The satellite data has also
revealed that some drainage lines have disappeared
and new tanks (surface water bodies) have come up
in the recent times. Field visits to these places
confirm the same. Roads and settlement layers have
been derived from Land Record Department, District
Mirzapur and were updated using the satellite
images.
photographs and digitally enhanced products of the
Indian Remote Sensing Satellite (IRS, LISS-III)
sensor. Arcview 8 software package was used for
creation of digital database, data integration and
analysis. All thematic maps were digitized (in
continuous mode in the vector format and the
digitized values were then edited). Different
categories of polygons in the thematic maps were
Fig. 1
Methodology
Basic technical guidelines provided by the
Integrated Mission for Sustainable Development
(IMSD) and Indian National Committee on
Hydrology (INCOH) have been adopted for selecting
sites for rainwater harvesting structures. The
thematic maps depicting the geomorphology,
landuse/landcover, road, drainage and lineaments
were prepared using 1:50,000 scale geocoded
labelled separately. The suitable weights were
assigned to each thematic feature after considering
their characteristics upon their influence over
recharge. Knowledge based weight assignment was
carried out for each features and they were
integrated and analysed by using the weighted
aggregation method (ESRI, 1988). The different units
in each theme were assigned ranking from 1 to 4 on
the basis of their significance with reference to their
site selection for installing rainwater-harvesting
326
J. Indian Soc. Remote Sens. (December 2008) 36:323–334
structures. In this ranking, ‘0’ denotes the restricted
area (e.g. forest region) and no structure is proposed
for that area, 1 denotes poorly favourable zones, 2
denotes moderately favourable, 3 denotes highly
favourable and 4 denotes excellent zone for site
selection for rain water harvesting structures. The
final score of a theme is equal to the product of the
rank and weightage. From the composite layer, the
delineation of site suitability analysis was made by
grouping the polygons into different prospect zones
i.e. excellent, good, moderate, poor and not suitable.
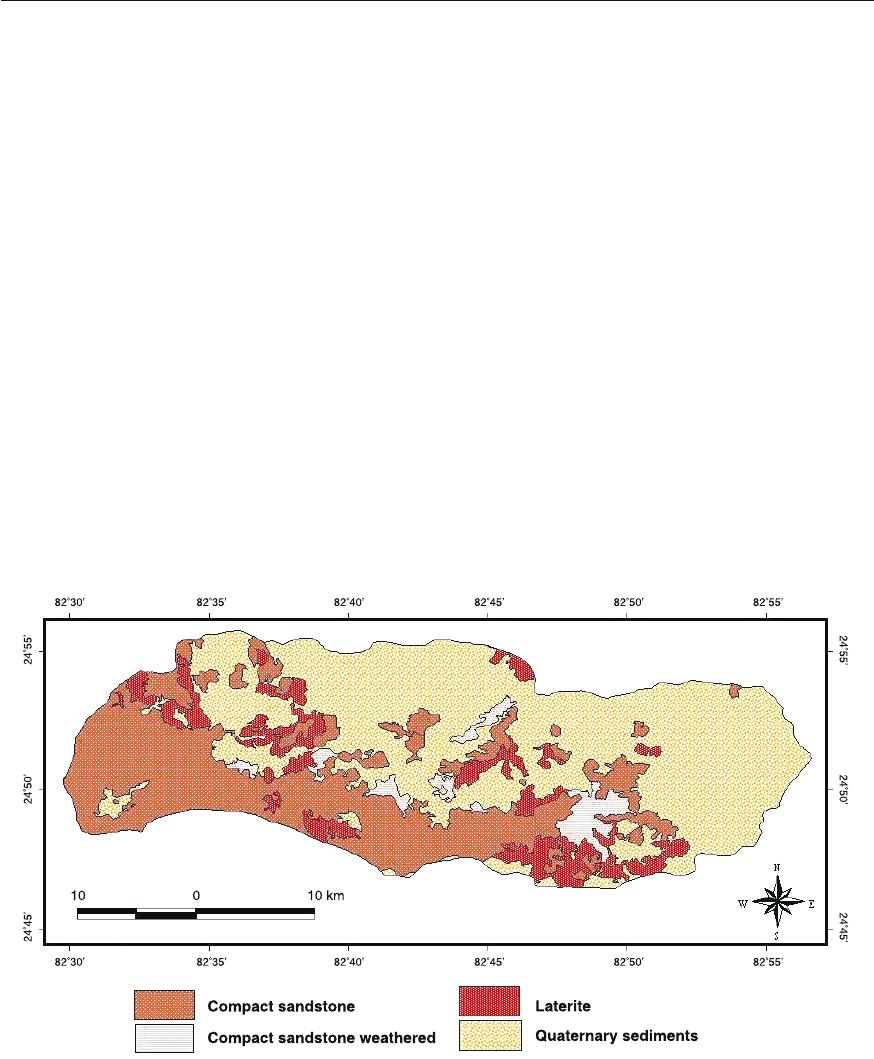
Geological set-up
It is a well-established fact that geological set-up
of an area plays a vital role in the distribution and
occurrence of groundwater (Krishnamurthy and
Srinivas, 1995). The geological set-up and
stratigraphy of the Vindhyan Super group in the Son
valley, Central India was earlier proposed by Auden
(1933) and later on revised by Prakash and Dalela
(1982). The Bakhar watershed is dominated by
compact sandstones of Kaimur series. At some
places, especially in the northern and eastern parts
of the watershed, it is overlain by Quaternary
alluvium (Fig. 2).
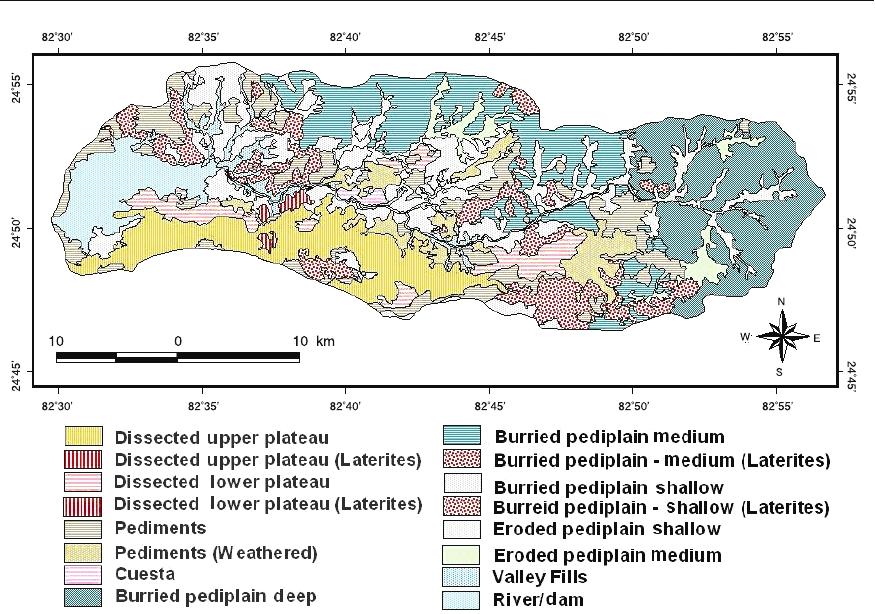
Geomorphological set-up
Geomorphology of an area is one of the most
important features in evaluating the groundwater
potential and prospect. The geomorphology as such
controls the subsurface movement of groundwater.
Considering the importance, different geomor-
phological features are mapped using the IRS
satellite imagery (Fig. 3). Various geomorphic
classes/units identified as per the guidelines laid
down by National Remote Sensing Centre,
Hyderabad (NRSC Technical guidelines, 1995). The
data has been duly validated during field visits. The
major landforms are as follows:
Fig. 2
327
J. Indian Soc. Remote Sens. (December 2008) 36:323–334
Dissected plateaus
These units are highly fractured and weathered and
show the formation of laterites. They show light
reddish tone and cover the southern part of the
watershed.
Pediments
Generally these units have low permeability and
infiltration rate and are noticed around the dissected
plateau region and drainage divide area of the
watershed. These units show patches of light
brownish tone with irregular shape and size.
Buried pediplains
Buried pediplains are formed due to coalescence of
buried pediments having thick overburden of
weathered materials. These landforms are charac-
terized by high porosity, permeability and infiltration
rate and as such the groundwater prospects of the
buried pediplain are good. In the FCC these units
show dark blue to light blue tone and most of the
eastern and northern part of the watershed.
Valley fills
Valley fills are mostly structurally controlled and the
materials are mainly sheet wash from the plateau area
Fig. 3
328
J. Indian Soc. Remote Sens. (December 2008) 36:323–334
and pediplains. Valley fills consist of both alluvial
and colluvial materials and are mostly identified
along the various streams of the watershed. These
are identified by characteristic bright spectral
signatures in the false colour composite of band 2,
3, 4. This geomorphic unit acts as good prospective
zone for groundwater development.
Eroded pediplain
This unit is seen along the streams of high and low
lying areas. These landforms give a bright red tone
in satellite data due to the presence of vegetation.
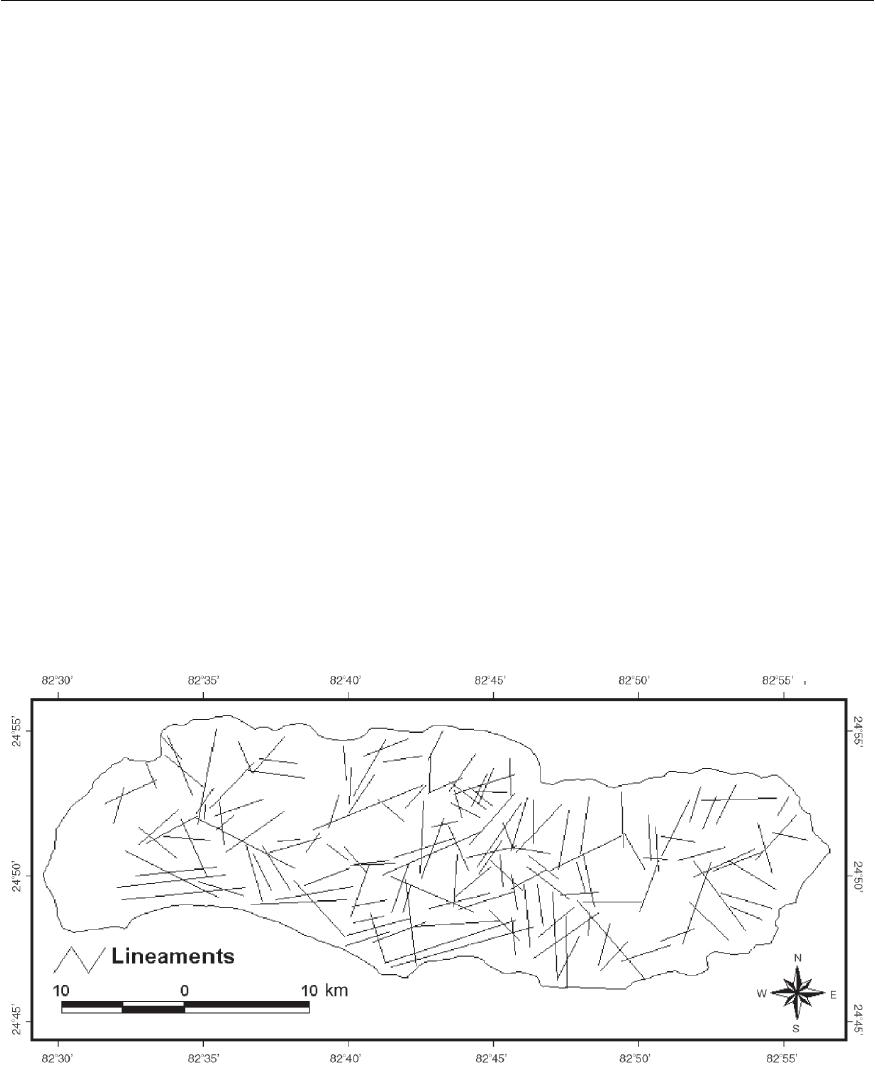
Lineament distribution
A lineament is defined as a large scale linear
structural feature. Such features may represent deep
seated faults, master fractures and joints sets,
drainage lines and boundary lines of different rock
formations. Lineaments provide the pathways for
groundwater movement and are hydrogeologically
very important (Sankar, 2002). Lineaments are
important in rocks where secondary permeability,
porosity and intergranular characteristics together
influence groundwater movements. The lineament
intersection areas are considered as good
groundwater potential zones. The combination of
fractures and topographically low grounds can also
serve as the best aquifer horizons (Rao, 1992).
Lineaments have been identified on images through
visual interpretation by comparing spatial variation
in tone, colour, texture, association, etc. (Fig. 4).
25 m area on either side of lineaments and
intersections of lineaments are considered to be
favourable for accumulation of groundwater.
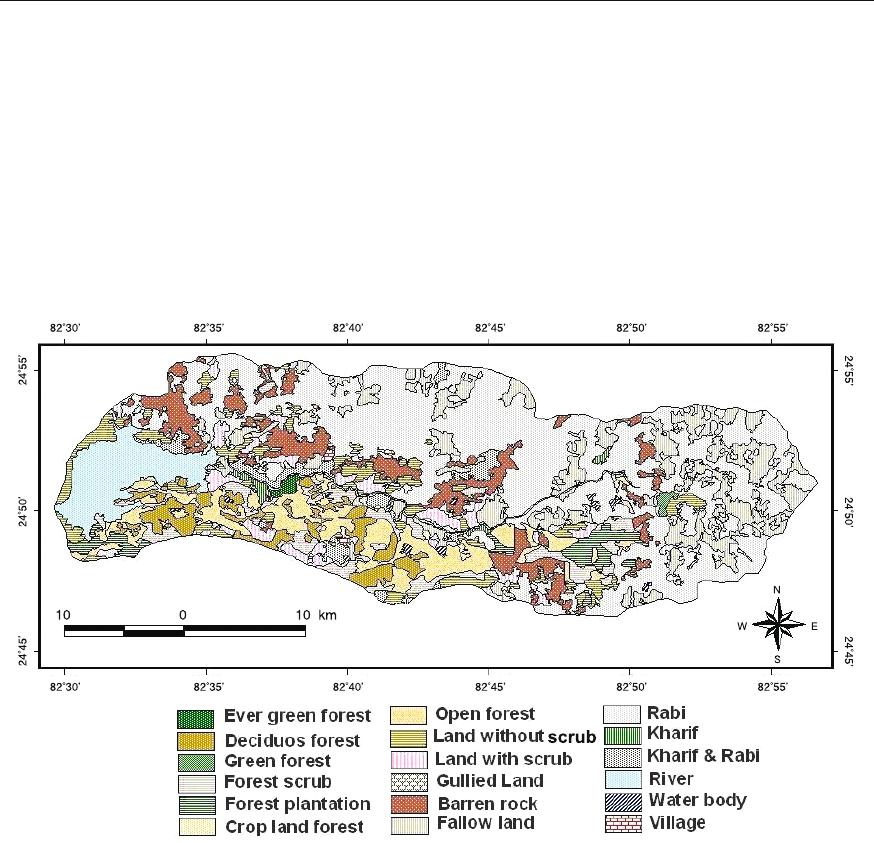
Land use / Land cover
The major landuse pattern include cropland, fallow
land, forest area, forest plantations, Barren rocky
area, land with scrubs and without scrubs. Cropland
includes land for growing the Rabi and Kharif crops
and have been identified by the light medium red
tone, fine/medium texture varying in size, often
rectangular in shape. These are excellent site for the
groundwater exploration. The forest and forest
Fig. 4
329
J. Indian Soc. Remote Sens. (December 2008) 36:323–334
plantation gives light reddish brown tone with white
patches and fine to medium texture with irregular
shape and varying size. Although, these areas have
good ground water prospects, these have been
purposefully categorized as poor, keeping in mind
that these areas are generally restricted and are not
permitted for any ground water exploitation activity.
Lands without scrub have been rated lower than land
with scrub for recharge, since vegetation cover
promotes infiltration (Fig. 5).
structures depends on various factors, which can be
integrated by GIS techniques (Novaline et al., 1993).
To assess the groundwater prospect in an area, all
the different polygons in the thematic maps were
labelled separately. Knowledge based weightages are
assigned to each thematic features after considering
their importance with respect to groundwater. All the
thematic maps are integrated in GIS environment and
the polygons have been regrouped into different
classess.
Fig. 5
GIS Analysis
Check dams, contour bunding, recharge pits and
wells and contour trenching provide a good measure
of rainwater harvesting structures in the hard rock
terrains by arresting run-off and increasing the
surface area of infiltration. Suitability of these
Weight Assignment
Thematic layers viz, geomorphology, geology,
landuse, lineaments buffer zone, drainage, road and
village location map have been considered for
site suitability analysis. Based on the available
knowledge on the role of each of these parameters

330
J. Indian Soc. Remote Sens. (December 2008) 36:323–334
in controlling the occurrence, storage and
distribution of groundwater, weightages of 20, 15, 18,
25, 25 and 0 were assigned for geomorphology,
geology, landuse, lineament, drainage and roads and
villages respectively. Again each of these layers has
further been classified into different classes. Each of
the classes, based on its ability to facilitate water
infiltration has been given ranks from 1 to 4. Finally,
scores have been calculated as the product of
the weightage and rank e.g. under the class geo-
morphology (wt. 20), valley fills have been assigned
the rank 4. The final score of 80 has been calculated
by the multiplication of the rank and weightage of
the class (Table 1).
The thematic layers were integrated with one
another through GIS using the weighted aggregation
method. The following order of sequence was
adopted to derive the final integrated map.
Table 1 Rank, weightage and scores for the various themes with respect to site suitability analysis
Geomorphic Unit Weightage - 20 Landuse Unit Weightage - 18
Class Rank Score Class Rank Score
Valley fills 4 80 Kharif 4 72
Eroded pediplains shallow 4 80 Rabi 3 57
Eroded pediplains Medium 3 60 Kharif + Rabi 4 72
Burried pediplain – Deep 4 80 Fallow land 3 57
Burried pediplain – Moderate 3 60 Land with scrub 2 36
Burried pediplain – Shallow 2 40 Land without scrub 2 36
Pediments 2 40 Barren rocky 1 18
Pediments (W) 3 60 Dense evergreen forest 0 0
Dissected upper plateau - Laterite 1 20 Deciduous forest 0 0
Dissected lower plateau - Laterite 1 20 Open forest 0 0
Dissected upper plateau 1 20 Scrub forest 0 0
Dissected lower plateau 1 20 Open forest 0 0
Geology Unit Weightage - 15 Crop land forest 0 0
Class Rank Score Guilled land 1 18
Compact sandstone 1 15 Water bodies 0 0
Compact sandstone (Weathered) 2 30 Settlements 0 0
Laterite 2 30 Reservoir/river 0 0
Alluvium 4 60 Settlements 0 0
Drainage Unit Weightage - 25
Class Rank Score
Lineaments Unit Weightage – 25 Drainage (50m buffer) 4 100
Class Rank Score Road & Village Unit Weightage - 0
Lineament (50 m buffer) 4 100 Class Rank Score
Road & Village (50m buffer) 0 0

331
J. Indian Soc. Remote Sens. (December 2008) 36:323–334
Geology (R1) + Geomorphology (R2) = S1
S1 + Landuse/landcover (R3) = S2
S2 + Lineament of 50m buffer (R5) = S3
S3 + Drainage of 50 m buffer (R4) = S4
S4 x Road and village layer (R6) = S5
In the first step, geology (R1) and geomorphology
(R2) layers were integrated by choosing the union
option. The integrated layer (S1), comprises 68
polygons of the geology layer and 215 polygons of
the geomorphology layer and after union it resulted
in 674 polygons. Adding these two layers, derived
the weight of each polygon in the integrated layer
(S1). The polygons in S1 have a maximum value of
140 and minimum of 35. In the next step, the S1 layer
containing 674 polygons was intersected with the
land use layer (R3), which had 339 polygons. In this
step, the integrated layer S2 (9209 polygons) was
generated by adding lithology, geomorphology and
landuse layers. These polygons have a maximum
weight of 212 and minimum of 35. The S2 layer was
integrated with polygons of the lineament buffer zone
(R4). In this integrated layer (S3), (13458 polygons
were generated) having a maximum value of 312 and
minimum of 35.
Layer R5 involving polygons made around the
drainage (buffer zone) was integrated with layer S3
by the union option. In this layer (S4) there are 24236
polygons which have a maximum value 412 and
minimum of 35. The village and road layers (R6)
having zero weightage were integrated with S4, using
multiplication option. The polygons in the integrated
layer (S5) had retained the same values of S4 except
the null value of road and village. The polygons in
the integrated layer (S5) contain the composite detail
of all the thematic layers together numerically having
maximum weight of 412 and minimum weight of zero.
Results and discussion
Grouping of polygons of high ranks of all the
thematic layers has helped in delineating the sites
that are excellent for construction of water
harvesting structures. Those polygons, which
have weight greater than 200 in the final integrated
layer have been, classified as excellent sites for
rainwater harvesting. The polygons classified as
good category have the weights between 121 and
200 and as of Moderate category have the weights
between 81 and 120. All other polygons that have
weight less than 80 (excluding zero) were grouped
as a poor category. Polygons having zero weights
have been separated out (not suitable category) as
these have been classified as reserve forests, roads
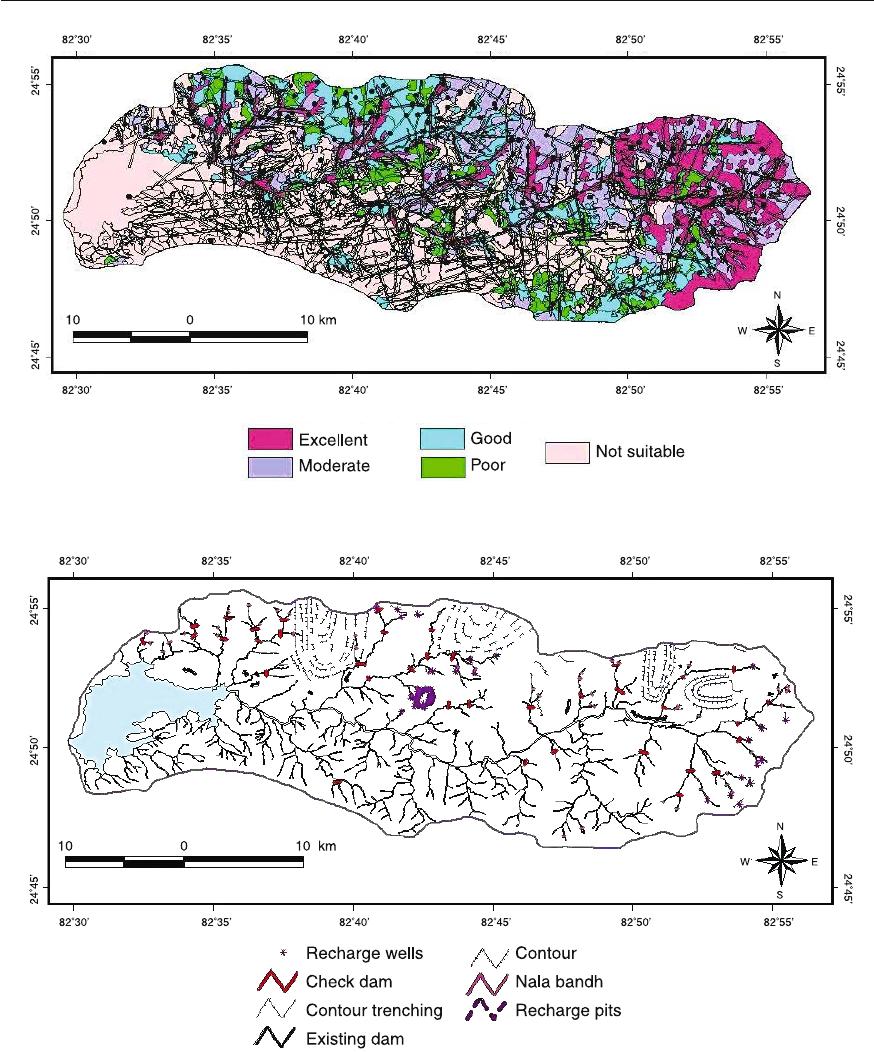
and villages. Thematic map (Fig. 6) showing the sites
suitable for construction of rainwater harvesting
structures suggests that the drainage area and the
eastern part of the study area are most suitable for
construction of rainwater harvesting structures.
Proposed rain water harvesting structures for
Bakhar watershed
The site suitability analysis (Fig. 6) has helped in
locating the suitable sites for the water harvesting
structures. Based on the above classification as well
as depth to water table map and terrain conditions,
a map suggesting the type of structures to be built
at various locations has been prepared (Fig. 7). The
proposed structures are check dams, contour
bundings, contour trenchings, nala bandhs, recharge
pits and wells. The numbers of structures proposed
in the study area are given (Table 2). The key factors
for selecting a particular structure at a given site are
as follows:
Check dam
(i) The check dam is essentially on the drainage
coarse, that may be situated on either 1
st
or 2
nd
order
of drainage; (ii) The preference for this structure is
given where drainage is narrow and straight; (iii) The
structure of check dam should be made so as to
regulate the water during monsoon and non
332
J. Indian Soc. Remote Sens. (December 2008) 36:323–334
Fig. 6
Fig. 7
