
Vol.:(0123456789)
Journal of Housing and the Built Environment
https://doi.org/10.1007/s10901-020-09796-8
1 3
ARTICLE
Aordable housing program tenants andtheir access
topublic transportation andemployment
HanJohnPark
1
· KwangyulChoi
2,3
Received: 23 August 2019 / Accepted: 3 November 2020
© Springer Nature B.V. 2020
Abstract
This research examines the level of access to public transportation and job resources spe-
cific to tenants residing in rental assistance program units in Harris County, TX, USA. It
evaluates the share of the subsidized housing renters from public transit facilities using pre-
set distances and the availability of jobs from the renters’ homes using the job accessibility
index. Particularly, this research compares the residential outcomes of the two major rental
assistance programs—Housing Choice Voucher (HCV) as a tenant-based program and
Low-Income Housing Tax Credit (LIHTC) as a project-based program—and the degree of
access to public transportation facilities—light rail transit (LRT) stations and transit cent-
ers. Furthermore, it assesses spatial distributions of the assisted housing program units and
jobs that are available tolow-income earners. The research finds that the HCV program
tenants reside in neighborhoods with greater accessibility to light rail stations and tran-
sit centers based on the network distance using the street routes and connections. It also
finds that the inner-city HCV residents have a higher level of low-paying job accessibility
than their LIHTC counterparts, whereas the suburban areas offer equal or less favorable job
opportunities to the HCV tenants than the LIHTC counterparts.
Keywords Accessibility· Employment· Housing choice voucher (HCV)· Light rail transit
(LRT)· Low-income housing tax credit (LIHTC)· Transit center
1 Introduction
Affordable housing programs in the United States are intended to provide low-income
households with housing units that meet certain quality standards so that qualified low-
income households could live in better residential units or settle in more desirable neigh-
borhoods through financial support. The US Department of Housing and Urban Develop-
ment (HUD) specifies that the housing choice voucher (HCV) program is to assist very
* Han John Park
1
Kinder Institute forUrban Research, Rice University, Houston, USA
2
School ofArchitecture, Planning andLandscape, University ofCalgary, Calgary, Canada
3
Department ofGeography andEnvironmental Sustainability, University ofOklahoma, Norman,
USA

H.J.Park, K.Choi
1 3
low-income families, the elderly, and the disabled to be able to afford rental units in the
private market and that their goal is to make it possible for the program’s tenants to live
in decent, safe, and sanitary housing (HUD 2020a). The Low-Income Housing Tax Credit
(LIHTC) program issues tax credits to acquire, rehabilitate, or newly construct rental hous-
ing units that can be rented by lower-income households (HUD 2020c).
Good quality housing is an essential element for everyone’s life, regardless of their sta-
tus. Low-income populations need to have a stable income source to meet their daily needs
and enable them to have the opportunity to climb the social ladder. In this regard, it is
important to provide a quality transportation option that helps these populations to be able
to commute or travel without having to worry about owning vehicles for all their family
members. Although many commuters rely on personal vehicles for commuting,
1
some fam-
ily members in each household still rely on public transportation, and other choice riders
could switch their travel mode to public transportation when transit agencies continue to
enhance public transit frequency and quality. This research aims to assess the degree to
which affordable housing programs are geographically connected to public transit facilities
and conveniently located in the vicinity of low-paying jobs.
In this study, we measure the accessibility to public transportation facilities for the two
major affordable housing programs’ residents. In addition, we assess how much the afford-
able housing programs’ tenants have job opportunities by analyzing how many low-paying
jobs are accessible based on their residences and the distance to such jobs. We examine
whether there is a difference in the accessibility to public transit and employment between
the two major housing programs: one is a tenant-based housing program (i.e., HCV), and
the other is a project-based housing program (i.e., LIHTC). This study aims to make sev-
eral practical contributions by providing policymakers, housing analysts, transportation
agencies, and urban planners with a better understanding of mobility challenges, particu-
larly for the job accessibility that affordable housing tenants face. Harris County, the third-
most populous county in the UnitedStatesand the home of the city of Houston, is used as a
case study in representing low-density southern US counties. This paper is further divided
into the following sections: literature review, data and methodology, study area, analysis
results of accessibility, and discussion.
2 Literature review
Housing and transportation are the two most substantial categories of expenditure for
American households, which account for almost half of the average household budget (The
US Department of Labor 2018). The financial burden of these two indispensable elements
makes up a significant portion of expenditure for low-income families. To lessen the bur-
den of housing expenditure, particularly rental costs, many rental assistance programs have
been created for low-income populations who otherwise would have struggled with high
living costs. In the US, HCV and LIHTC are the two primary affordable housing programs
1
Every eight-in-ten residents in Harris County drive their own vehicles to workplaces according to the
2018 5-year American Community Survey. Our research area, or Harris County, Texas has less dense devel-
opment patterns in the county, which is unfavorable to serving the county’s residents with good public tran-
sit due to dispersed origins and destinations. Thus, focusing the county’s two major transit characteristics
(light rail stations and transit centers) and work trips could make it straightforward to understand how con-
veniently affordable housing residents commute to work by public transportation.

Affordable housing program tenants andtheir access topublic…
1 3
that subsidize low-income tenants and make rent less burdensome than that of regular mar-
ket units. As a tenant-based subsidy program, HCVs subsidize the difference between 30%
of recipients’ household income and the contract rent. The maximum available rent for
HCV tenants is determined by an area’s reasonable market-rate residential units and also
varies by the recipient’s household size. HCV holders can choose any type of rental hous-
ing as voucher subsidies are assigned to individual households, not specific properties. In
theory, voucher recipients could move to less segregated and less poverty-stricken areas.
However, in practice, the HCV program, similarly to other housing mobility programs, has
failed to move voucher tenants into better neighborhoods (Kleit etal. 2016).
Compared to the HCV program, the LIHTC program is a project-based subsidy pro-
gram, which helps private developers provide affordable housing properties to low-income
families. Private LIHTC developers construct multi-family complexes using the allocated
tax credits. The locations of LIHTC multi-family properties are determined by LIHTC
project applicants, considering each state housing finance agency’s LIHTC qualified allo-
cation plan (QAP). Each state housing agency approves successful LIHTC proposals that
went through competitive processes and allocates tax credits to each selected project. Many
LIHTC properties have been constructed in areas where developers were able to take extra
tax credits by considering state housing agencies’ rules on additional scores, such as quali-
fied census tracts (QCTs), and therefore many of the existing LIHTC units are located in
poor neighborhoods.
2
In general, neighborhoods with new LIHTC properties already have
substantial populations who are below the poverty line (Williamson etal. 2009).
The neighborhood quality for affordable housing program tenants has been extensively
studied, and the findings indicate that it is difficult to conclude that tenants living in HCV
and LIHTC units benefit from the best quality in their neighborhoods. Wang etal. (2017)
have found that voucher holders do not move to high-opportunity neighborhoods. Regard-
ing the poverty level, only approximately 20% of the voucher households live in low-pov-
erty neighborhoods in the 50 largest metropolitan areas (McClure etal. 2015), and it takes
some time for voucher tenants to relocate to lower-poverty neighborhoods after receiving
the subsidy (Eriksen and Ross 2013). Basolo (2013) has shown that voucher movers live
in neighborhoods with lower poverty rates than their previous neighborhoods, although
the improvements were minimal and, in addition, the movers’ employment significantly
dropped after moving. In terms of safety in neighborhoods, subsidized housing tenants
tend to live in less safe neighborhoods than non-subsidized populations (Lens 2013; Ellen
et al. 2012). However, voucher holders live in neighborhoods in which crime rates are
considerably lower than traditional public housing and LIHTC tenants (Lens etal. 2011).
Regarding school quality, voucher movers live in neighborhoods with better school quality
than their previous neighborhoods (Basolo 2013), but both HCV and LIHTC tenants have
lower school quality in their residency area than other renters (Deng 2007). More specific
comparisons among subsidy programs by Horn etal. (2014) show that voucher holders live
in neighborhoods with lower-performing schools than those living in LIHTC developments
and poor households overall but with higher-performing schools than those living in public
housing developments. Lastly, concerning walkable neighborhoods, federally subsidized
housing is located predominantly in lesswalkable neighborhoods with poor access to ser-
vices and amenities (Talen and Koschinsky 2014).
2
The LIHTC locations are partly the consequence of state housing agency goals for community revitaliza-
tion through the LIHTC program rather than for LIHTC developments to be located in quality neighbor-
hoods (Deng 2007).

H.J.Park, K.Choi
1 3
Transit accessibility is an essential value that HCV and LIHTC tenants could benefit if
their family members can easily access and use transit in their neighborhoods or the vicin-
ity of their residences, as their car ownership is limited. However, the specific research
of HCV and LIHTC tenants’ accessibility to individual transit facilities, such as light rail
stations and transit centers, is limited. The tenants of both programs primarily reside in
neighborhoods where rental units are not much more expensive than the median market
rate, where multi-family homes or denser housing units are predominantly available. A cer-
tain level of high-density supports the efficiency of public transit, where land use supports
multi-family buildings and attached housing units since dense land uses could improve
people’s mobility while conserving land (Guerra and Cervero 2011). Though the transit
service is not always successful in high-density areas in the American context (Bertaud
and Richardson 2004), a significantnumber of low-income families live in high-density
neighborhoods where multi-family units are prevalent, and public transportation often con-
nects residential areas that are at a high density (Glaeser etal. 2008). Unlike those who
can afford to operate private vehicles for every household member to commute, some
low-income families may have to be entirely dependent on public transit.
3
Blumenberg
and Ong (2001) have illustrated that many welfare participants rely on public transporta-
tion as their only transportation option to commute to work. This group in the population
would have significant difficulties in life without the accessibility to public transit services,
which could lead to a low employment rate and continuous poverty status (Sanchez 1999;
Sanchez etal. 2004). However, there has been a disparity in the accessibility to public tran-
sit among housing assistance programs. Welch (2013) has explained that HCV households
have more equitable access to Baltimore’s transit stops than their LIHTC counterparts.
Employment is necessary for low-income families to sustain their daily lives. Allard and
Danziger (2002) have shown that the proximity to employment opportunities, especially
low-skill employment opportunities, is associated with welfare and housing assistance
recipients being able to have a higher probability of working. Additionally, Immergluck
(1998) has found that job opportunities near one’s area of residence have a modest effect
on employment rates, although he has pointed out that the required levels of jobs should fit
the skills of the labor force. Additionally, residences in close proximity to both transporta-
tion and job opportunities likely contribute to making it easy for people to find and main-
tain jobs, and low-earning workers are more sensitive to transit than high earning workers
(Andersson etal. 2018; Ellen and Weselcouch 2015). Palm etal. (2014)have supported
that households trade-off housing and commuting costs and that households living in areas
close to jobs and fixed-route transit service pay higher housing costs, which indicates that
neighborhoods offering jobs and transit accessibility are more expensive and that people
are willing to pay more housing costs in such communities.
The locations in which assisted housing tenants have settled are still questionable in
terms of whether they could increase their life quality by gaining access to potential work-
places and main public transportation facilities without difficulties. To our knowledge, little
research has been carried out to evaluate how much rental housing assistance program ten-
ants collectively benefit from existing public transportation facilities and jobs, which could
3
According to the 2018 5-year ACS estimates in Harris County, a majority of families, including low-
income families still rely on automobile. However, we know low-income adults are more likely to use tran-
sit than higher-income adults, and our focus renterhouseholds are primarily extremely low-income or very
low-income families. Therefore, the renterhouseholds in this study are more likely to rely on public trans-
portation than general households and even more so than moderate-income renterhouseholds.

Affordable housing program tenants andtheir access topublic…
1 3
affect their commuting and personal life patterns. Houston etal. (2013) haveassessed the
built environment for the voucher units and LIHTC properties that are located in Orange
County, California, and found that the HCV program is more likely than the LIHTC pro-
gram to be located in high-traffic areas which are associated with more transit service. As
most low-income families rely on inadequate income and their mobility is restricted due to
a low rate of private vehicle ownership, well-served public transportation options to their
work are necessary rather than optional. Low-income families subsidized by housing pro-
grams in and near neighborhoods that provide access to public transit facilities and offer a
great number of employment opportunities could decrease transportation expenses. There-
fore, a family’s potential economic conditions could be enhanced (Pendall etal. 2014).
Hence, this research aims to assess the dynamics among affordable housing tenants,
publictransit, and employment in Harris County, Texas, which includes the city of Hou-
ston, as an example of one of the Sunbelt cities. Houston’s case can apply to many low-
density cities in most southern US areas, where the population is growing fast, and urban
area is expanding to suburbs at a fast pace as well. Most commuters are drivers, and public
transit facilities are not dense in such low-density southern cities. Our Houston case analy-
sis could be an exemplary study in helping to understand the degree to which low-income
subsidized tenants use public transit and access low-paying jobs.
It is critical to compare the difference between two major assistance housing programs
and show how much the tenants of each housing program have accessibility to public tran-
sit facilities and job opportunities since they each have different characteristics. While the
voucher program has offered mobility to individual tenants using the existing private rental
market, the tax credit program has added new affordable housing units by developers who
otherwise might not have voluntarily been involved in buildingaffordable housing (Deng
2007). We assume that many affordable housing renters would be able to use transit ser-
vices and access employment more easily if public transportation facilities and employ-
ment opportunities exist in the vicinity of their subsidized homes than those who do not
have such accessibility. Better proximity to jobs connected to convenient public transporta-
tion facilities from home would enable subsidized housing tenants to reduce both monetary
and non-monetary transportation costs. Often, subsidized renters are single parents with
children, and the need for convenient transportation, including public transit, is significant
as these families have responsibility for all aspects of household maintenance in addition to
job-related trips.
4
Therefore, the proximity to transit facilities and convenience in traveling
by transit must be of value to them. Reliable transportation helps to increase the level of
job opportunities, income, and job stability, and for those with limited automobiles, prox-
imity to public transit is essential (Blumenberg and Pierce 2012). In addition, improved
access to transit is positively related to maintaining jobs, and residing in transit-rich areas
is economically beneficial (Blumenberg and Pierce 2014).
4
In the case of Harris County, 86% of the heads of the HCV families are female, 55% of the HCV fami-
lies are female-headed families with children, and the average household size is 2.59, which is close to the
county’s average household size of renter-occupied units, or 2.66.

H.J.Park, K.Choi
1 3
3 Data andmethodology
The HCV datasets were acquired from the Houston Housing Authority (HHA) in January
2016 and were already aggregated at the census block group level for personal information
confidentiality. The LIHTC dataset was available on the HUD website, and it shows spe-
cific individual LIHTC project addresses that were in place by 2015. In Harris County, 316
projects existed, of which 300 projects were able to be accurately located using recorded
geographical information. The 16 other recordsdid not include coordinates as these were
not placed in service yet, although the credits of the project were already allocated.
Public transportation datasets were mainly available on the Houston–Galveston Area
Council (HGAC) and Houston METRO websites. We analyzed the street network to derive
the accessibility to public transportation facilities, which was conducted by using an Arc-
GIS analysis tool that assesses real street routes. This analysis was used to measure the
distance from each census block group centroid to the closest metro rail station and transit
center. The street file was available from 2017 topologically integrated geographic encod-
ing and referencing (TIGER) line shapefiles on the Census Bureau website. Although the
network analysis does not directly mean the level of real public transportation use of the
affordable housing program tenants, it measures the true distance to the closest facility,
which could reflect the shortest time that the tenants have to spend getting to use public
transportation in reality.
We computed the numbers and shares of HCV and LIHTC tenants within preset dis-
tances to both the closest metro rail station and the closest transit center. The centroids
of the census block groups were used to assess the number of tenants for each program.
5
Distances were more specifically categorized within three miles with an accumulated half a
mile (e.g., a half-mile,
6
one mile, one mile and a half, two miles, two and a half miles, and
three miles), and distance thresholds were more widely but intuitively set outside of the
three-mile range (e.g., five miles, 10 miles, 20 miles, and 40 miles).
Employment information was available from the US Census longitudinal employer-
household dynamic (LEHD) origin–destination employment statistics (LODES) datasets.
We used the 2015 employment datasets, including origins of employers, or residential char-
acteristics, and destinations of employers, or work characteristics, with three types of pre-
categorized income levels: jobs with earnings of $1250 per month or less; $1251 to $3333
per month; and $3333 per month or greater. We chose the lowest level of earnings ($1250
per month or less) for both origins and destinations of employers. For job accessibility,
network distances between a pair of centroids for all census block groups in Harris County
were calculated, based on the street connection, in a similar way to the public transporta-
tion accessibility analysis. To assess the accessibility for both renter groups’ residences,
we used HUD’s formula, which computes the accessibility that is assigned to each census
block group (HUD 2020b). More specifically, HUD’s original job proximity index uses a
gravity model, where the job accessibility of each residential block group is a collective
5
We used the centroids of census block groups as locations of the residences of subsidized housing tenants
instead of individual addresses, mainly because the information of the HCV program locations was aggre-
gated at the census block group level for the confidentiality of individual voucher families.
6
Although thresholds that are smaller than a half-mile are empirically important, the thresholds smaller
than a half-mile did not capture a reasonable number of residents from the closest transit facilities because
the average distance from each census block group’s centroid to its boundary was, in general, larger than a
half mile except for a few census block groups in or near Downtown Houston.

Affordable housing program tenants andtheir access topublic…
1 3
job index considering the distance to all job locations with a positive weight of the size of
employment, or job opportunities, and all other residential locations with a negative weight
of the size of labor supply, or competition. A shorter distance to a job block group impacts
a higher job opportunity, which positively affects the index, whereas a shorter distance to
a residential block group impacts a higher labor competition, which inversely affects the
index. In our study, having known the limitation of HUD’s distance that is measured with
the air distance, we computed the street-based distance instead, which general people actu-
ally experience in real life. Additionally, we further developed HUD’s concept to fit with
accessibility for low-income affordable housing tenants by accounting for employees in the
lowest income category (origins) and jobs in the lowest wage category (destinations).
We followed the specifications of the proximity indexes of HUD (2020b) but used the
network distances instead of air distances to assess meaningful accessibility than simple
proximity. We also utilized the low-paying jobs and low-income residents in order to have
a closer understanding of the subsidized renters’ access to employment opportunities.
7
The index i stands for a residential census block group, and j indicates all n census
block groups within Harris County. Distance, D, is measured based on the network dis-
tance between census block groups i and j, with distances less than1 mile substituted for 1.
Employment, E, represents the number of jobs paying less than $1250 per month in census
block group j. Residents, R, is the number of low-income workers making less than $1250
per month in census block group j.
8
4 Housing assistance programs, public transportation, andjobs
intheresearch area, Harris County, Texas
4.1 Aordable housing programs inHarris County
More than half of the census block groups (1103 out of the county’s total 2144 block
groups) have accommodated either HCV or LIHTC tenants or both. A total of 16,246
households with the HCV program are identified in 1072 census block groups, which is
50% of the census block groups in Harris County, with an average of 15.2 households per
census block group.
9
A total of 37,171 households supported by the LIHTC program are
found in 176 census block groups, with an average of 211.2 households per census block
Job Accessibility
i
=
n
∑
j=1
(
E
j
∕D
2
i,j
)
/
n
∑
j=1
(
R
j
∕D
2
i,j
)
7
We used census block groups as the unit of analysis of our study, as census block groups are the most
granular level of geography to show our analysis at the neighborhood level given that we acquired the HCV
residents at the census block group level. Census block groups also represent neighborhoods at a fine level
to compute distances between the affordable housing units and the job locations that were available origi-
nally at the census block level.
8
In addition to the job accessibility index with the raw value unit, we also used the percentile unit that
ranges from 0 to 100, meaning that the higher the job accessibility index, the better the access to low-
paying job opportunities for low-income residents in a neighborhood (HUD 2020b). We included the results
from the percentile-based job accessibility index in footnote 17 but did not specifically explain the results in
the main text in detail, for brevity.
9
The voucher data was acquired from the Houston Housing Authority in January 2016.
H.J.Park, K.Choi
1 3
group.
10
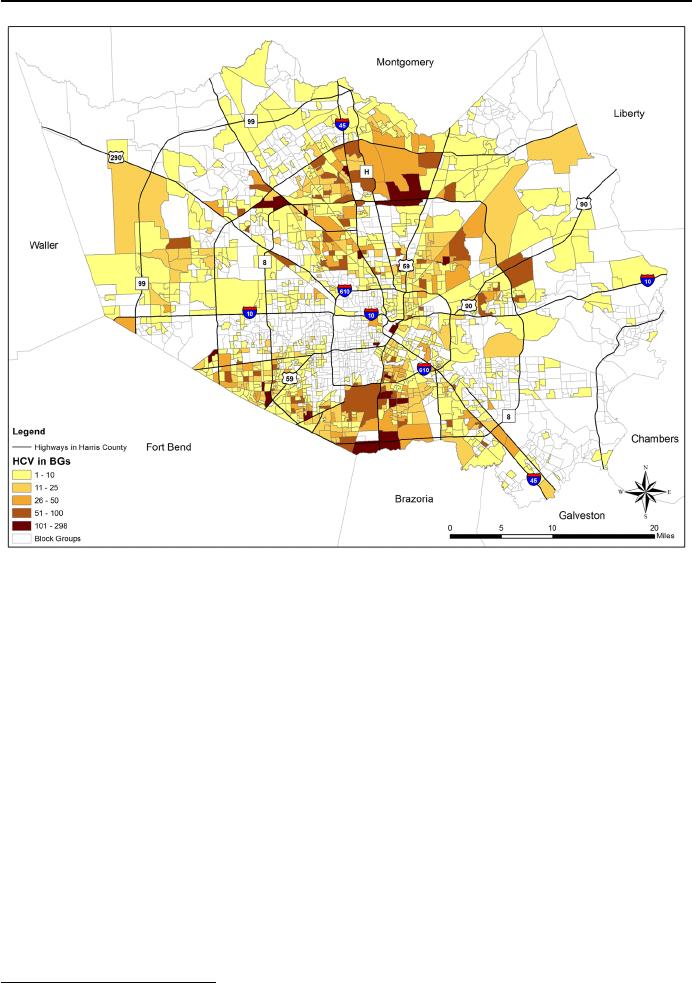
As shown in Figs.1 and 2, demonstrating the distribution of the tenants with the
two programs, the HCV tenants are more dispersed than the LIHTC residents. Tenants
with a voucher subsidy can choose a private rental unit without any geographical contain-
ment as long as the selected rent charges are below the Fair Market Rent (FMR). On the
other hand, LIHTC tenants have to reside in units in multi-family complexes where private
developers have already designated and completed construction. Therefore, LIHTC resi-
dents are found in fewer census block groups with a larger average number of units in each
hosting census block group than the HCV case, as the HCV tenants are identified in many
census block groups with a fewer average number of voucher units in each accommodating
census block group.
11
Figure1 demonstrates the HCV distribution by census block group. Many HCV house-
holds are clustered in neighborhoods of the county’s southern area and near the George
Bush Intercontinental Airport. The maximum number of HCV holders in a census block
group is 298, and half of the census block groups did not host any single HCV family.
12
Fig. 1 HCV households in Harris County’s census block groups
10
The Low-Income Housing Tax Credit unit information was acquired from HUD National LIHTC Data-
base, and we used the LIHTC units that were placed by 2015.
11
Voucher renters can reside in LIHTC units, and the statistics of such voucher families are not known
because of the unavailability of the detailed addresses of the HCV voucher families.
12
HUD’s picture of subsidized households shows that, inHarris County as of 2015, 95% of the county’s
HCV holders are very low-income families and that household income per year is $13,607. About 34% of
HCV households reported wages are the major source of income. Approximately 18% of either a household
head or their spouse is 62years or older. Half of the HCV households are single-parent families without a
spouse but with one or more children under 18years, and 23% of the populations in the HCV units have a
Affordable housing program tenants andtheir access topublic…
1 3
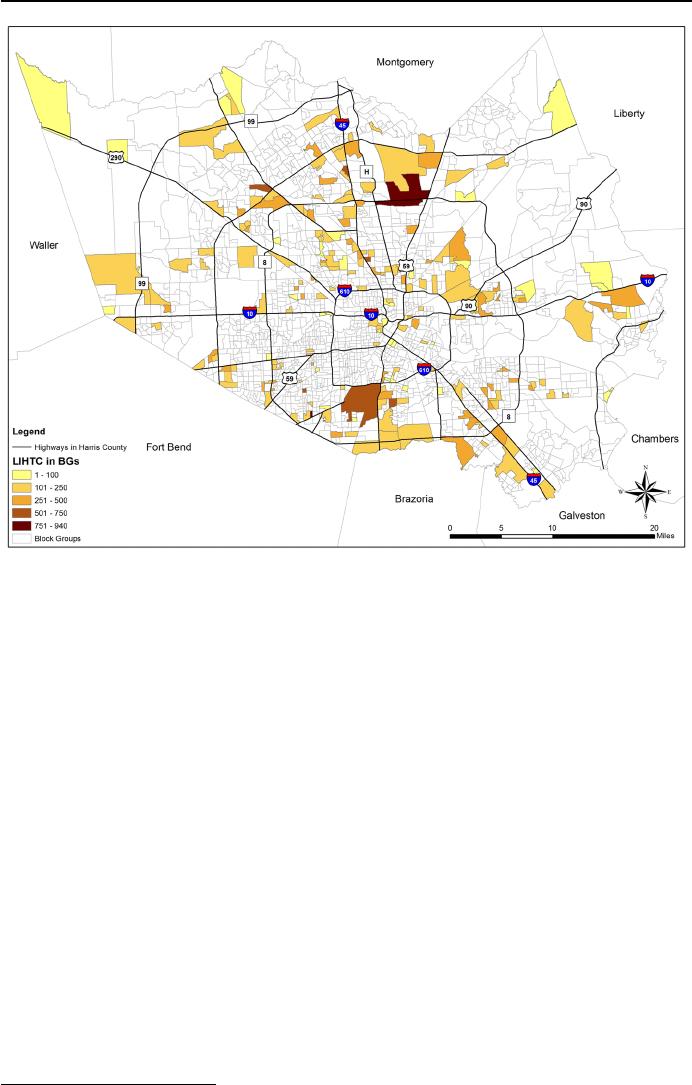
Locational differences in distribution between the two programs are significant. Accord-
ing to Fig. 2, the distribution of the LIHTC renters is more clustered in certain census
block groups. The maximum number of LIHTC tenants in a census block group is 940,
which is almost three times larger than that of the HCV tenants. The difference between
the two programs is primarily caused by the highest number of LIHTC renters residing in
a few census block groups where LIHTC apartment complexes have been constructed. The
difference in the two housing programs reveals that LIHTC residents have less locational
flexibility in their residence than HCV renters. Far more than half of the county’s census
block groups do not have any LIHTC residents.
Furthermore, we divided the county into three sub-areas by using major concentric
highways that separate the county into three segments. The first sub-area is an urban area
within Interstate 610 (I-610) with limited land which is more expensive and supports more
employment opportunities than the other two sub-areas. The second sub-area is a donut-
shaped area between I-610 and Beltway 8, where urban and suburban areas coexist, as
some census block groups are within the city of Houston and others are not. The third sub-
area is beyond Beltway 8, where most census block groups are outside the city of Houston
and located in the suburbs.
Fig. 2 LIHTC households in Harris County’s census block groups
disability. On average, the current voucher families had waited for 26months on the waiting list and have
been on the active subsidy recipient list for 92months.
Footnote 12 (continued)
H.J.Park, K.Choi
1 3
The HCV tenants are relatively evenly distributed as voucher holders find locations
where rental units are available and wherevoucher subsidies are accepted. Despite some
clustering census block groups, the maximum number of HCV renters does not exceed
300 units in any census block group. HCV renters choose subsidized units without a strong
geographic limitation, though there is the rent cap, and HCV recipients should find own-
ers that accept HCV subsidies as part of renters’ income source. On the other hand, the
LIHTC units are spotted in fewer census block groups throughout the county than the case
of the HCV units. The largest populous LIHTC census block group surpassed 900 units,
and LIHTC units are observed more frequently in the second and third sub-areas than the
first sub-area. In the inner I-610 sub-area, it is challenging for LIHTC private developers to
construct multi-family buildings where the land in the urban core is pricier than the other
two outer sub-areas. LIHTC developers, instead, looked out the program’s development
sites where competition for multi-family development is less intense and the land is less
expensive, which are mostly located in the second and third sub-areas, in addition to tax
credit incentive areas taken into consideration (e.g., QCTs and difficult development areas,
or DDAs, albeit less frequently).
4.2 Public transportation facilities inHarris County
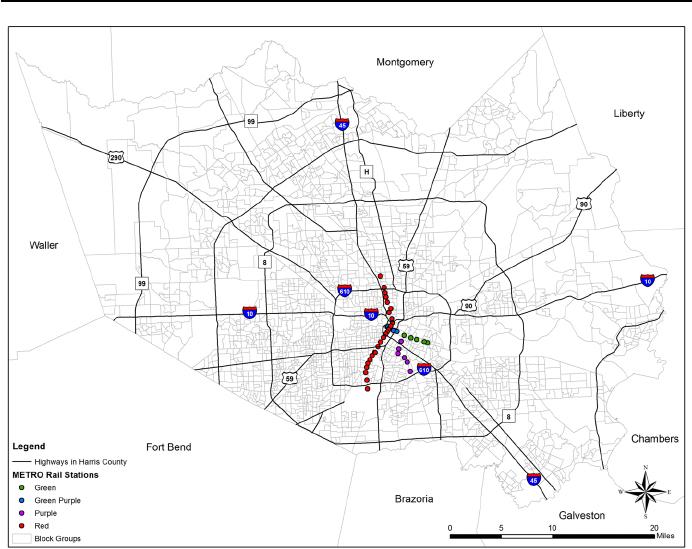
As illustrated in Fig.3, the Houston area has three metro rail lines: the Red, Green, and
Purple Lines. The Red Line links Downtown Houston, Houston’s largest job center, and
the Texas Medical Center, the second-largest job center. The Green Line links the east
Fig. 3 Light rail stations in Harris County
