Vol.:(0123456789)
SN Computer Science (2021) 2:4
https://doi.org/10.1007/s42979-020-00393-8
SN Computer Science
ORIGINAL RESEARCH
Scientic Collaboration inaMultidisciplinary Organization Revealed
byNetwork Science
IvanBergier
1
· PatríciaMenezesSantos
2
· AndreiaHansenOster
3
Received: 16 October 2020 / Accepted: 5 November 2020
© Springer Nature Singapore Pte Ltd 2020
Abstract
Multidisciplinary scientific organizations have sought to face the challenges of digital transformation through new govern-
ance models that optimize network collaboration and innovation. We studied the collaboration network from the long-term
coauthoring system of a Brazilian multidisciplinary organization (Embrapa). The study shows that nodes degree distribution
of the network is scale free and degree correlation analysis suggests a disassortative regime from competition and minimal but
sufficient control that emerges as a hub-and-spoke pattern. The jobs of controller and researcher are twice as many occupied
by males, except for the jobs of analyst, who act like network gatekeeper. With the largest number of individuals in product
units, the southern region of the country is more likely to form clusters. Alternatively, hubs in thematic and ecoregional
units in the Midwest have greater gravitational attraction, positioning themselves in the inner core of the giant component.
The optimization of innovation by the organization should combine greater individual autonomy through improved human
capital, with a universal labeling of units as, for instance, centers of innovation.
Keywords Business intelligence· Innovation process· Hub-and-spoke· Organization control
Introduction
Studies of scientific collaboration have fertile grounds on the
principles of network science [1, 2]. Emerging from statisti-
cal physics and the science of complexity [1–4], network
science is a transversal discipline providing the theoretical
bases for studying and modeling real systems with empiri-
cal data [5]. Vertices (nodes) and links (edges) constitute a
network, in which nodes with many edges have high-degree
k. The distribution of values of k is important because the
structure or the anatomy of a network reflects its internal
dynamics of evolution and affects important functions like
the dissemination of information/disinformation and the
resistance to failure [1, 3, 6].
Barabási and Albert [7] have shown that heavy-tailed
degree distributions p (k) are emergent properties of sto-
chastic growth models. New nodes continuously attach
themselves to existing network nodes with probability
proportional to k of the target node [8]. Observed in many
empirical data and in a variety of systems, the phenomenon
was coined as preferential attachment [9].
The heavy-tailed degree distribution is described by a
power law function
p
(
k
)
∼ k
−𝛾
, with or without exponen-
tial cutoffs [10], where a giant component (many connected
nodes) exists for 2 ≤ γ < 3.47 [5, 11]. The fast decaying p (k)
with the increase in k indicates that a very small number
of high-degree nodes coexists with a very large amount of
low-degree nodes. The former are called hubs, which affect
both the topology and the evolution of the system. Moreo-
ver, the heavy-tailed distribution is scale free, i.e., the first
moment <k> has less relevance, since the second moment
diverges as the total number of nodes n and k increases.
Above all, in scale-free networks with hubs and random
clustering, the average path length <l> between nodes is
reduced and proportional to n [5], which agrees with the
Electronic supplementary material The online version of this
article (https ://doi.org/10.1007/s4297 9-020-00393 -8) contains
supplementary material, which is available to authorized users.
* Ivan Bergier
ivan.ber[email protected]
1
Embrapa Pantanal, Brazilian Agricultural Research
Corporation, Corumbá, MS, Brazil
2
Embrapa Pecuária Sudeste, Brazilian Agricultural Research
Corporation, SãoCarlos, SP, Brazil
3
Embrapa Uva e Vinho, Brazilian Agricultural Research
Corporation, BentoGonçalves, RS, Brazil

SN Computer Science (2021) 2:4 4 Page 2 of 11
SN Computer Science
concept of highly connected communities of small world
networks [6].
Scientific collaboration is an undirected social network,
where the nodes are scientists and the edges denote co-
authorship. Coauthoring systems have been considered
reliable patterns of social network dynamics, from which
graph, clustering and centrality measures are useful to reveal
hidden facets of scientific development in many fields of
research [12, 13]. In turn, big data from metadata derived of
digital publication databases are useful sources of informa-
tion for business intelligence [14, 15]. In addition, network
science can be valuable in the search of topological arrange-
ments that optimize innovation internally and among small
and large multidisciplinary organizations [16, 17], where
preferential attachment is affected by hierarchy-energy
dynamics [18].
By rule, a coauthoring topology indicates the type of
association between nodes in a scientific network. For
example, the co-authorship clustering was found higher in
physics rather than mathematics and biology communities
[13]. Furthermore, the degree correlation
k
nn
(
k
)
∼ k
𝜇
, i.e.,
the tendency of nodes to connect to other nodes with simi-
lar (assortative, µ > 0) or dissimilar (disassortative, µ < 0)
degrees, has been found assortative in many scientific col-
laboration networks [2, 13]. On the other hand, it has been
shown that scale-free networks can be controlled by a finite
subset of the network, called the dominant set Γ (γ, µ, <k>)
for which Γ ≤ n/2 [19, 20].
This article explores the big data of preferential scientific
collaboration in Embrapa (Brazilian Agricultural Research
Corporation), a multidisciplinary government research
organization responsible for the Brazilian ‘green revolution’
in rural areas. In the last 47years, Embrapa played an impor-
tant role in changing the Brazilian status of food importer to
a global player in sustainable food markets [21, 22], placing
the country among the main global traders responsible for
food security and sustainability [23].
Embrapa infrastructure of research, development and
innovation (RD&I) ramifies into the inner Brazilian regions
as departments or decentralized research units whose des-
ignations have been associated to national products of large
importance (Product), edaphic–climatic conditions or biome
(Ecoregional) or other exceptional knowledge (Thematic)
[24–26]. In addition to administrative and assistance work,
the main occupations are Analysts engaged in lab, field or
administrative support, and Researchers committed to a
shared RD&I agenda.
The technological disruptions of information and commu-
nication, the escalation of startups and the torrent of social
(web) interactions have mutually challenged Embrapa. The
need to improve efficiency is highlighted by redesigning
communication, partnerships and funding sources. Among
the responses to these challenges, one can underline: (1) the
numeric reduction of RD&I projects in strategic portfolios
[27], (2) interfaces reorganization to improve open innova-
tion; and (3) the adoption of TRL—Technological Readiness
Levels [28] to strengthen collaboration with the private sec-
tors [29, 30].
In summary, the motivation of the present work is to
decipher the unknown preferred scientific collaboration
in the multidisciplinary Embrapa through network science
[5, 31, 32], assuming that the network topology reflects a
canonical pattern of the organization’s social dynamics [1,
6]. Embrapa, in its complexity of research areas, and conse-
quently the degree of researchers (different areas of knowl-
edge), could help explain different behaviors of co-author-
ship and collaboration [10, 13, 33]. For that goal, this paper
explores network science principles and provides informa-
tion about the big data compilation in Sect.2. Results are
depicted in Sect.3, subdivided into statistical (3.1 and 3.2)
and graph (3.3) analyses. Related works and conclusions are
presented in Sects.4 and 5, respectively.
Materials andMethods
There are five essential characteristics to be explored with
network science: (1) structural complexity, (2) connectiv-
ity and node diversity, (3) network evolution, (4) dynami-
cal complexity and (5) meta-complication [1]. The present
work focuses on items (1) and (2) associated with the current
topological state of the network.
Dataset
The co-authorship dataset was compiled from Embrapa’s
publication repository in the Agricultural Research Database
(BDPA) under CC BY-NC-ND 4.0 license. The data mining
consisted of organizing a list of nodes with the attributes:
name (<publication_name> or <proxy_name>), gender
(<female> or <male>), unit type (<product> , <ecore-
gional> or <thematic>), location (<south> , <mid-
west> , <northeast> , <southeast> and <north>), and job
position (<analyst> , <researcher> , <controller> or external
collaborator <extcollab>).
The alphabetic list of n nodes with attributes allowed
searching each of them through name attribute in BDPA.
Node queries were carried out from December 2019 to
March 2020. It were recorded for each node the values
of <publication_name> (surname and initials) of the ten
closest nodes (preferred or most frequent coauthors), includ-
ing the node itself. In this way, a maximum of 10 <publica-
tion_name> values were recorded, of which the searched
node is the first element of an array i with j closest coauthor
nodes represented by a
i,j
. Iteratively, an adjacency matrix
m
n,j
with 1 ≤ j ≤ 10 undirected coauthoring nodes was

SN Computer Science (2021) 2:4
Page 3 of 11 4
SN Computer Science
produced. In any case, whenever <publication_name> of the
a
i,1
node was unattainable, her/his surname and initials in the
alphabetic list were assumed as <proxy_name>.
Gephi 0.9.2 [34] and Microsoft Excel
®
supported the
numbering or codification of nodes and edges of the adja-
cency matrix m
n,j
. Initially, m
n,j
was imported into Gephi to
create and export a CSV data file with a list of paired edges
of attributes <publication_name> or <proxy_name> when
needed.
As the codes and attributes of nodes a
i,1
are known, it
was possible to compare them with all other edge nodes
in Excel to produce a new list of paired edges coded by
nodes. For that purpose, a conditional matrix was created
to code a
i,j
= a
i,1
if <publication_name> (or <proxy_name>)
attribute was the same. In addition, the procedure was use-
ful for identifying and reviewing <proxy_name> attributes
because some nodes do not adopt surnames like <publica-
tion_name> or because BDPA provided the attribute a
i,j
with
j > 1. Finally, the remaining coded nodes without any other
attribute information, associated with external collaborators
(non-employees), were assigned as <extcollab>.
Encoded nodes with attributes and edges in CSV data
files were opened in Gephi 0.9.2 and explored via network
science (see below). The links were imported by averag-
ing parallel edges. Preliminary drawing, sizing and coloring
according to partitions (node attributes, centralities and clus-
tering indexes) were useful to rectify the big data, ensuring
consistency and quality.
Network Graphs andMeasures (Theory
andCalculation)
Graph Layout
Gephi 0.9.2 [34] was used to draw networks, identify com-
munities with modularity class [35], and to calculate cluster-
ing coefficients [6] and other measures of centrality [31, 32,
36]. The default layout Yifan Hu [37] was chosen to expand
the initial randomly distributed nodes in the overview graph
window. Subsequently, ForceAtlas2 algorithm [38] was
adjusted to scale 3 with approximate repulsion and prevent-
ing overlapping of nodes. The measures of centrality of the
network were then computed and nodes were size-ranked by
betweenness centrality [36], ranging from 25 to 250 with an
exponential spline function to facilitate the visualization of
nodes and edges. Then, the attributes of nodes were explored
through color pallets.
Degree Correlation, Centrality andClustering Measures
The measures of centrality compute the importance of nodes
in a network. To study the co-authorship network, three
measures of centrality were evaluated:
•
Degree (k): it measures the number of edges or links con-
nected to a node. The more edges the greater the node
degree, and highly connected nodes are known as hubs
[31].
•
Betweenness: it is positively correlated with k, corre-
sponding to the frequency at which a node appears in the
shortest paths between all pairs of nodes in a network.
Higher values confer hub skills [31, 32].
•
Closeness: it is the mean of the shortest path length from
one node to all other nodes. A low value suggests that the
node is closely connected to every other node; therefore,
it is considered a gatekeeper (cluster connector) in a net-
work [31, 32].
The degree correlation captures the relationship between
each node degree k with the averaged degree k
nn
(k) of edged
nodes (immediate neighbors). The degree correlation func-
tion is
k
nn
(
k
)
∼ k
𝜇
where µ = 0 relates to a neutral regime,
µ < 0 to a disassortative regime (low-degree nodes connect
to large-degree nodes and vice versa) and µ > 0 to an assor-
tative regime (nodes tend to connect to other nodes with
an equivalent degree) [5]. The degree correlation was cal-
culated for the co-authorship network by implementing a
conditional matrix in an Excel datasheet to address k values
for coded and paired edges. Then, k
nn
(k) function could be
obtained by calculating the average values of k for all undi-
rected (in and out) nodes.
In addition, clustering coefficient and modularity class
have been also evaluated:
•
Clustering: it is a measure of the degree to which nodes
in a graph tend to group together [6].
•
Modularity class: it is a clustering algorithm that detect
communities of nodes [35].
The distributions of network measures were studied with
nonparametric (median-oriented) tests and boxplots grouped
by attributes with the aid of Past 4.02 software (https ://
www.nhm.uio.no/engli sh/resea rch/infra struc ture/past/).
The nonparametric statistical analyses are available in the
Appendices.
Results
Degree Distribution andCorrelation
The entire network with 9207 undirected nodes and 15,696
edges showed a degree distribution ranging from 0 ≤ k ≤ 409,
with mean network degree <k> = 3.41, diameter 12, null
density and average path length <l> = 5.466. The normal-
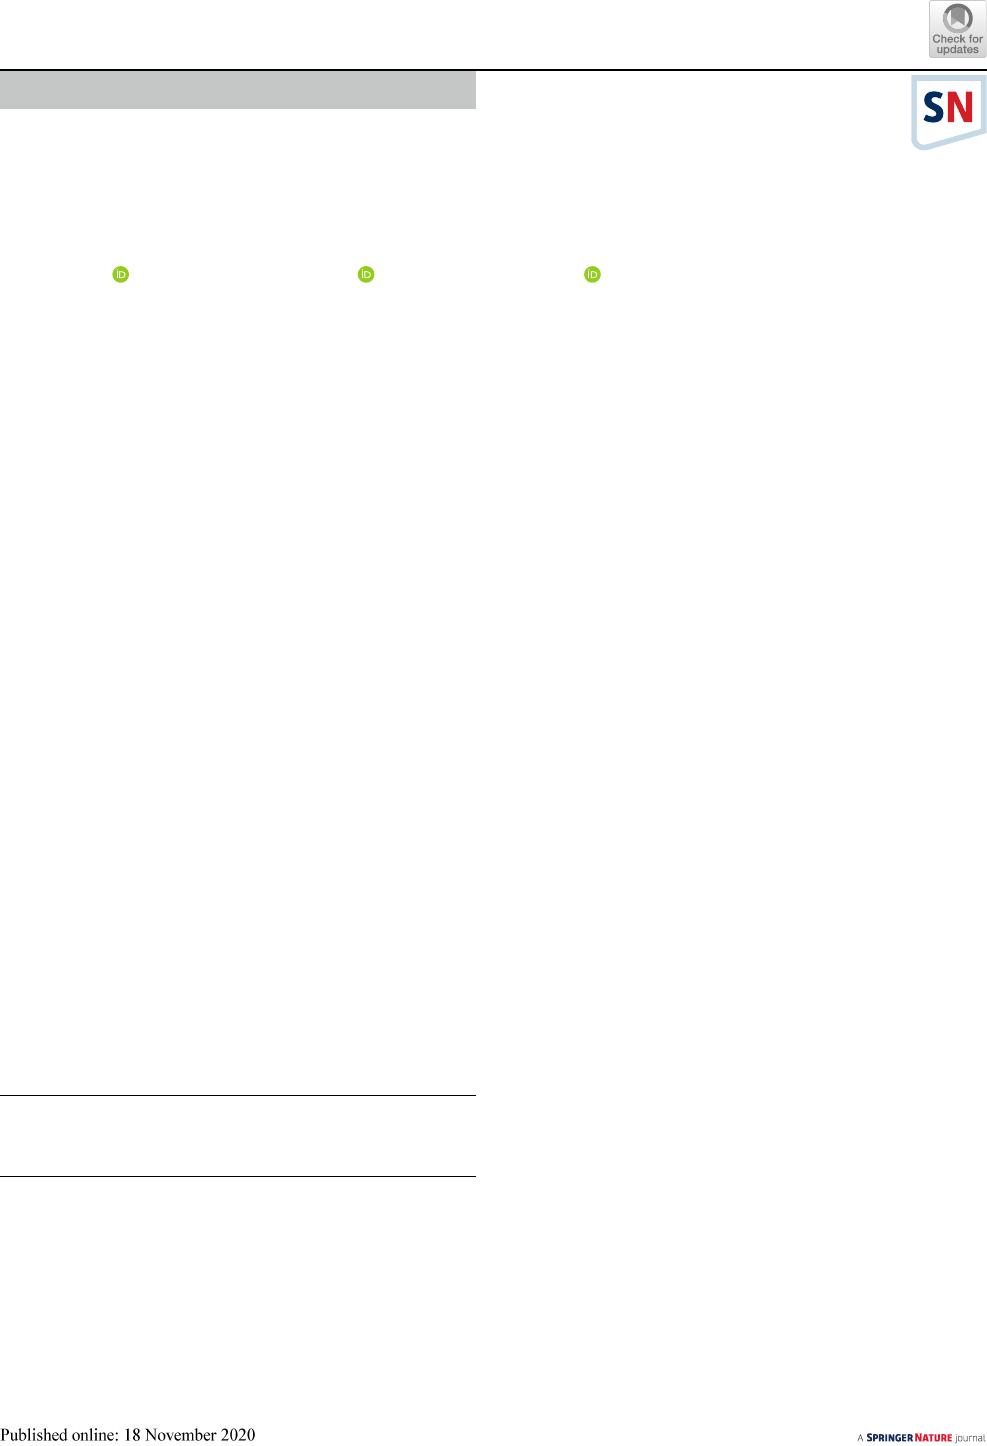
ized log-binned probability distribution p (k) is shown in
Fig.1.
SN Computer Science (2021) 2:4 4 Page 4 of 11
SN Computer Science
Despite a few internal and many external collaborators
for whom k = 1 (6923 nodes), the frequency of nodes with
k < 9 is very small (318), indicating that most nodes has at
least nine preferential coauthors. Nodes with k ≥ 9 (1777) are
those with increasing co-authorship of scientific documents.
The distribution p (k) indicates a free scaling network with
large hubs resulting from preferential attachment [9].
For scientific collaboration, a p (k) distribution is usually
scale free and decays with an exponent γ > 3, which indicate
a random regime indistinguishable from a random network
[5]. For the Embrapa dataset, bootstrap interval estimation
reaches 1.6613 ≤ γ ≤ 2.273 (Fig.1), suggesting that the net-
work results from a nonrandom scale-free regime associated
with the interval 2 ≤ γ < 3.
In particular, the log-binned regression gives γ ~ 2, indi-
cating an anomalous scale-free regime that induces a hub-
and-spoke (centralized) configuration [5], where most nodes
are closer to each other (constant path length l) because
almost all of them connect to a common central hub. Since
the largest hub (k
max
) is given by
k
max
= k
min
× n
(
𝛾 −1
)
−1
, then
the number of hubs increases linearly with n in that anoma-
lous scale-free case [5]. In brief, Fig.1 illustrates that, over
the organization timespan (currently 47years), only a very
small fraction of nodes gained much more connections (very
large hubs) than other nodes in the scientific collaboration
network of Embrapa.
Another interesting property of networks is given by the
degree correlation function
k
nn
(
k
)
∼ k
𝜇
. The exponent µ
is associated with the modus operandi of interconnection
between nodes. If the nodes connect randomly, then µ = 0.
In cases where nodes with similar values of k connect, the
degree correlation is assortative and µ > 0. In contrast, when
hubs preferentially connect to low-degree nodes (tending to
a radial topology with a centered hub), then µ < 0 and the
degree correlation is disassortative.
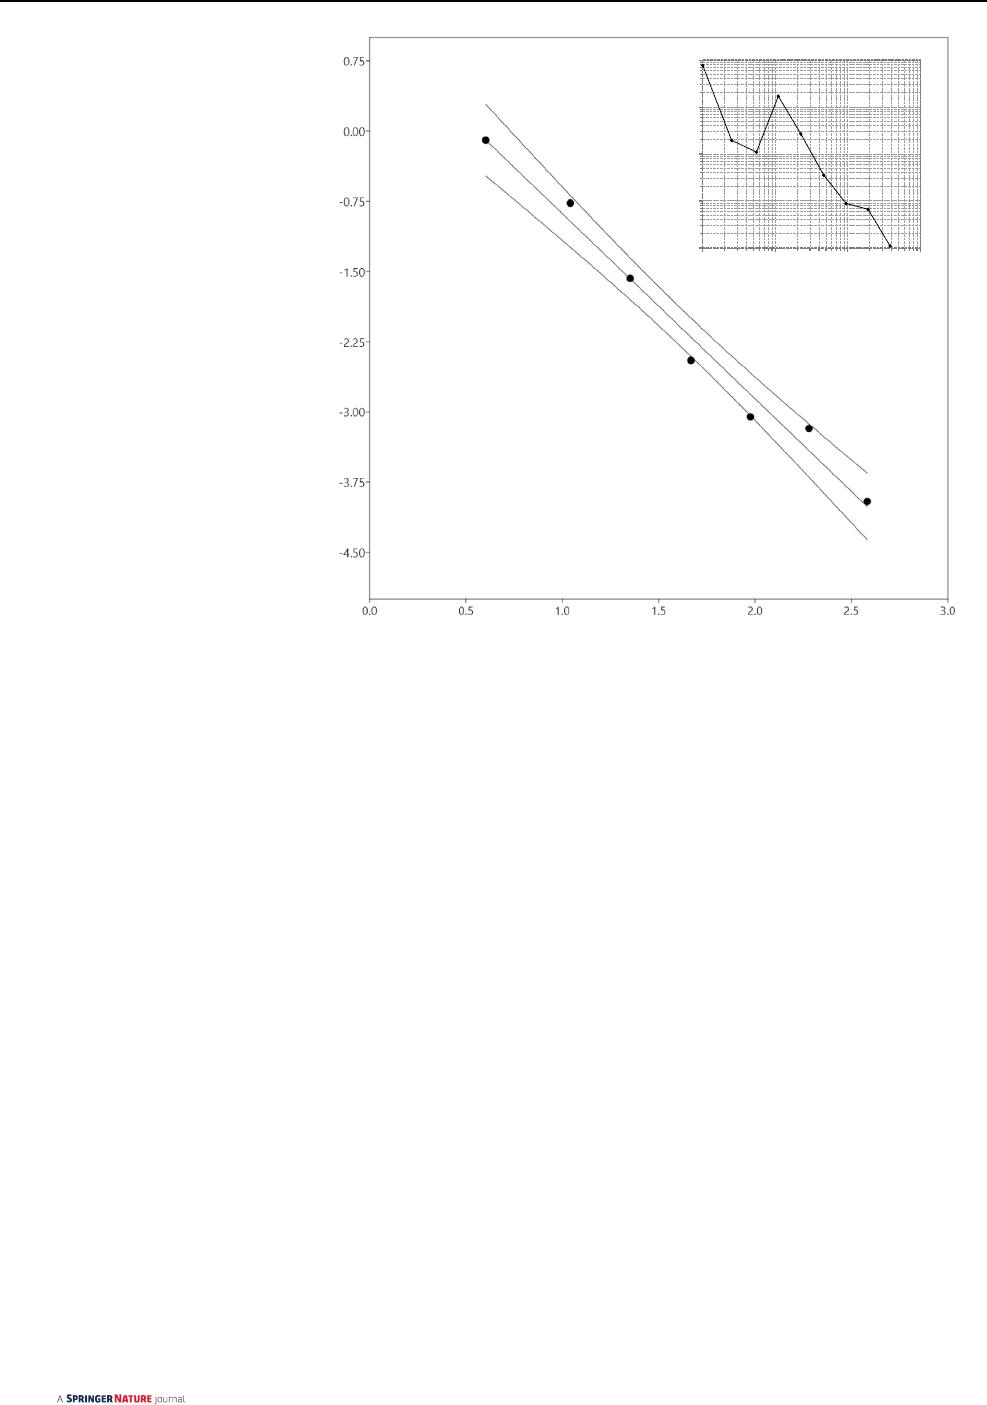
Figure2 presents the plot
k
nn
(
k
)
∼ k
𝜇
for the coauthor-
ing network. A disassortative regime is expected theoreti-
cally for the anomalous scale-free regime γ ~ 2. Accordingly,
statistical regressions and bootstrap of the empirical data
provide µ ≤ 0 (Fig.2).
As the network is a product of the evolving dynamics of
preferential attachment, then the hub-and-spoke radial pat-
tern of co-authorship emerges as a response of long lasting
internal organizational dynamics, in which some nodes have
better competitive fitness (characteristic individual features)
to gain more edges than others nodes [5].
Nonparametric Statistical Analyses
Measurements of network centralities (normalized
betweenness, closeness and degree), modularity and clus-
tering might be also useful to unveil internal dynamics
Fig. 1 Log-binned prob-
ability distribution
p
(
k
)
∼ k
−𝛾
with γ = 1.9768 ± 0.1215
(r
2
= 0.98146, p = 1.5993 × 10
–5
)
and 1.6613 ≤ γ ≤ 2.273 in
95% bootstrapped confidence
intervals with 1999 iterations.
The 189 nodes for which
k = 0 were dismissed, and the
frequencies of the log-bins
centered in k = 1, 2.5 and 5.5
were averaged as <k> = 4.
For k ≥ 10, regression reaches
γ = 1.9784 ± 0.18016 within
1.4315 ≤ γ ≤ 2.4937
log k
log p(k)
0.0001
0.001
0.01
0.1
1
110100 1000
p(k)
k
SN Computer Science (2021) 2:4
Page 5 of 11 4
SN Computer Science
configuring social network topology. TableS1 (Appendi-
ces) provides the descriptive statistics of network meas-
urements obtained for internal collaborators (n = 2231),
whose attributes data of gender, organization post (posi-
tion), and unit type and region are available (see Sect.2.1
in Methods). For selecting the best network measure-
ments for statistics, it was studied the linear strength of
redundancy or randomness between centralities, modular-
ity and clustering by means of Pearson correlations and
the corresponding statistical significances (TableS2 and
cross-plot Figure S1).
The correlation analysis evidenced strong redun-
dancy between degree k and betweenness (r = 0.8379,
p < 0.0001), and moderate redundancy between k and
closeness (r = 0.2269, p < 0.0001). Furthermore, modular-
ity correlations with network measurements were very low
(0.008 < r < 0.073) indicating randomness. Consequently,
for evaluating differences between grouped attributes, it
was considered only the variables of normalized between-
ness and closeness to assess hub and gatekeeper proper-
ties, respectively, and clustering. Descriptive statistics of
the selected network measurements for each attribute are
shown in Tables S3 to S6.
Table1 shows the p and F statistics obtained with non-
parametric Permutational Multivariate Analyses of Vari-
ance (PerMANOVA) in the Euclidian space to evaluate
differences between the selected attributes. The study was
made with 9999 permutations as a two-way PerMANOVA
for checking any mutual interactions between attributes.
Betweenness centrality has shown not useful to distin-
guish network differences between gender, position, and
unit type and region, suggesting that hubs are relatively
well distributed among groups in the network. On the other
hand, significant network differences were encountered for
closeness centrality (Table1). In particular, the two-way
PerMANOVA tests between gender (p = 0.0229) and posi-
tion (p = 0.0001), and gender (p = 0.0318) and unit type
(p = 0.0479) provided significant statistical interactions
(p = 0.0492 and p = 0.0278, respectively). Nonetheless,
1
10
100
11
01
00
k
nn
(k)
k
Fig. 2 Degree correlation function for the Embrapa coauthor-
ing network (straight line). The statistical regression gives
µ = − 0.09358 ± 0.040969, r
2
= 0.08253, p < 0.026041, and bootstrap
interval of −0.18902 ≤ µ ≤ −0.0032878 with 1999 iterations
Table 1 Two-way
PerMANOVA tests to evaluate
differences of network
properties between attributes:
gender (male, female); position
(controller, researcher, analyst),
unit type (product, thematic,
ecoregion), region (South,
Midwest, North, Southeast,
Northeast)
Significance levels are marked at α = 0.05* and 0.001**
Attribute Betweenness Closeness Clustering
F p F p F p
Gender 0.0586 0.8645 2.8318 0.0229* 0.7483 0.2538
Position 2.1094 0.2392 20.052 0.0001** 19.183 0.0001**
Interaction −406.83 0.4719 −396.37 0.0492* −491.10 0.8186
Region 0.9469 0.2504 0.4405 0.6325 5.2000 0.0001**
Unit type 0.1888 0.9198 2.0815 0.0500* 9.2453 0.0001**
Interaction −97.519 0.5324 −73.007 0.0574 −84.004 0.1536
Gender 0.0874 0.8618 3.9532 0.0357* 1.1785 0.2468
Region 1.3879 0.2039 0.5539 0.6446 6.6307 0.0001**
Interaction −28.973 0.4402 −41.952 0.1438 −57.461 0.1699
Gender 0.1109 0.8489 4.2068 0.0318* 1.2131 0.2397
Unit type 0.3511 0.8550 2.7850 0.0479* 12.135 0.0001**
Interaction 225.86 0.2689 −21.657 0.0278* −86.216 0.2165
Position 1.9267 0.2672 20.088 0.0001** 20.274 0.0001**
Unit type 0.1696 0.9044 1.8781 0.0455* 7.9113 0.0001**
Interaction −233.30 0.4200 −197.03 0.1699 −230.89 0.9716

SN Computer Science (2021) 2:4 4 Page 6 of 11
SN Computer Science
the interaction between gender (p = 0.0357) and region
(p = 0.6446) was not significant (p = 0.1438).
The results suggest that closeness centrality is independ-
ent of the region and somewhat driven by gender (lower
for females) and position (lower for analysts), but unclear
concerning unit type (nonparametric Mann–Whitney and
Kruskal–Wallis tests at Sect.2 of the Appendices). These
findings are corroborated by a contingence table analysis
(Fischer’s exact test) indicating high proportion of females
enrolled as analysts rather than controllers and researchers
(Sect.3 of the Appendices).
Concerning the clustering network variable, significant
differences were detected for position, region and unit type
however without significant interactions (Table1). Differ-
ences in the attribute position are mostly due to lower clus-
tering values for analysts, which reinforces their gatekeeper
role in the network. However, differences in clustering
seems more associated with region and unit type. A paired
Mann–Whitney U test indicated that clustering at the South
region is significantly higher than that measured for Midwest
and North regions. In addition, the same test evidenced that
clustering at product units is significantly higher than that
measured for thematic and ecoregional units (Sect.2 of the
Appendices).
Graph Explorations
Network analysis has identified 206 connected components.
The giant component for which k ≥ 10 has 1107 nodes with
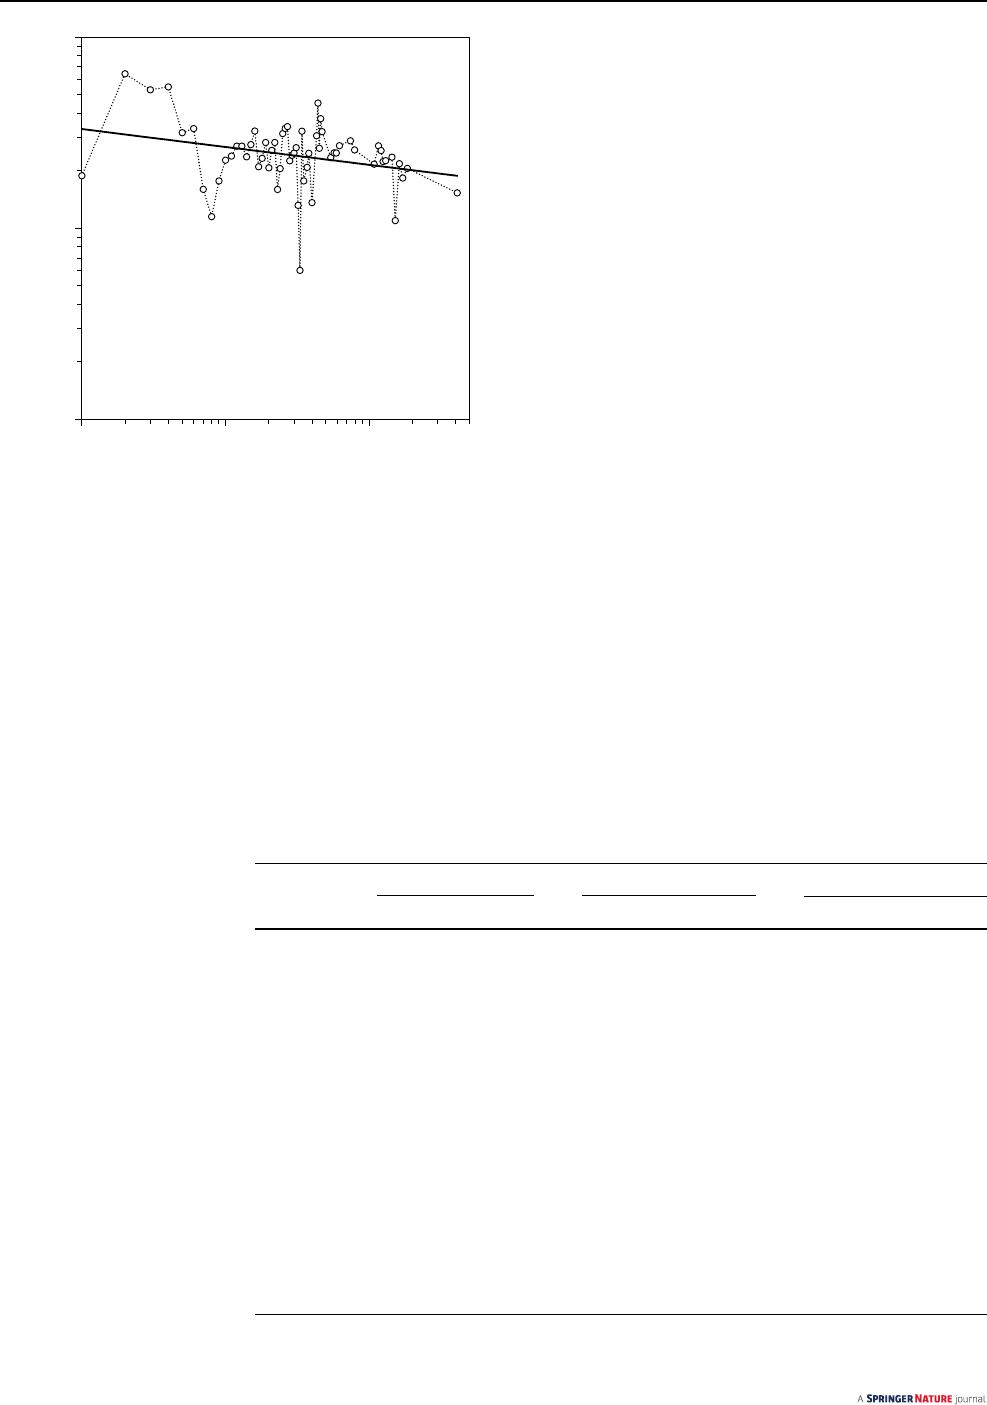
4943 edges. Graph analyses with partitions of attributes by
color are shown in Figs.3 and 4 for the whole network (on
the left) and for the giant component (right sided).
In agreement with the estimated values for γ and µ (see
Sect.3.1), the graphs reveal a radial hub-and-spoke pattern,
in which a constellation belt of low-order nodes surround a
core of internal collaborators permeated by external collabo-
rators (Fig.3a). In the void between the core and the belt,
small components reproduce the hub-and-spoke pattern.
The constellation belt consists of proportions of females
and males (Fig.3b) distributed over regions (Fig.4a), unit
types (Fig.4b), and enrolled as researcher, analyst or con-
troller (Fig.3c).
The core of the giant component gathers mostly research-
ers associated with ecoregional and thematic units (Fig.4b).
The graph suggests a prevalence of males as controllers,
confirmed by contingency tables (Sect.3 in the Appendices).
Statistical differences in clustering by region and unit
type (Table1) are graphically evident in Fig.4a, b. Southern
units gather more nodes in productunits that, as found, tend
to develop more collaboration in clusters. However, hubs
located in thematic and ecoregional units (Fig.4b), in par-
ticular at Midwest (Fig.4a), have greater gravitational force,
sitting in the inner core of the giant component. Modularity
class was somewhat useful for identifying singularities of
communities mutually modulated by region and unit type
effects (Fig.4c).
Discussions andRelated Works
Scale-free networks derive from at least three major ingre-
dients: growth, preferential attachment and fitness [5]. The
present work mostly explores the second factor, in which
high-degree nodes tend to increase links faster than other
low-degree nodes. However, while a network grows over
time, the distinct competitive fitness of nodes may also play
a vital role in configuring hub-and-spoke topologies [5], as
those shown in Figs.3 and 4, which was not addressed here
in details. Therefore, a limitation of this work is that it relies
in a snapshot of the current state of the organization, and an
evolutionary network approach would bring more insightful
information. In any case, deciphering the current topology
of the interdisciplinary Embrapa is the new contribution of
this paper.
Network science applied in the coauthoring system of
Embrapa revealed that the degree of network nodes follows
a power law distribution derived from a scale-free dynamics
with preferential attachment producing a giant component
[9, 39]. For the present case, however, p (k) distribution
does not require exponential cutoffs [10] and the exponent
rests nearly γ ~ 2, a special circumstance associated with the
development of hub-and-spoke patterns over several scales,
in agreement with a disassortative regime [5].
Alternatively, it has been shown that scientific collabora-
tion generally creates an assortative network [13, 33]. Dis-
assortative regimes have been acknowledged as an outcome
of technological and biological networks [13] that embed
some degree of controllability [20]. Therefore, Embrapa’s
scientific co-authorship network resembles networks with
controls and constrains, which agrees with the findings by
Zuo and Zhao [40] that more multidisciplinary institutions
are not necessarily more collaborative.
As the Embrapa coauthoring network evolves, the control
of individual and regional units, combined with competition
and centralized bureaucracy, can synergistically sustain the
observed hub-and-spoke network pattern. Such dynamics
emerges from scale-free networks because connectivity has
considerable effects not only on the behavior of the system,
but also on how the dynamics of the system can be directed
at will, where only a few nodes are needed to control the
entire network, especially when γ ≤ 2 [19].
It has been shown that the size of a minimum dominant
set of a network, Γ, depends on µ, γ, and <k>, but not on
modularity and clustering [19, 20]. Decreases in Γ when
µ ≤ 0 is due to the repulsion (competition) between hubs.
Additionally, Nacher and Akutsu [19] have shown that p (k
Γ
)

SN Computer Science (2021) 2:4
Page 7 of 11 4
SN Computer Science
Int. Collab.
Ext. Collab.
A
C
B
Researcher
Analyst
Ext. Collab.
Controller
Female
Male
Ext. Collab.
Fig. 3 Whole network and the giant component for k ≥ 10 partitioned by internal and external collaborators (a), gender (b) and position (c)
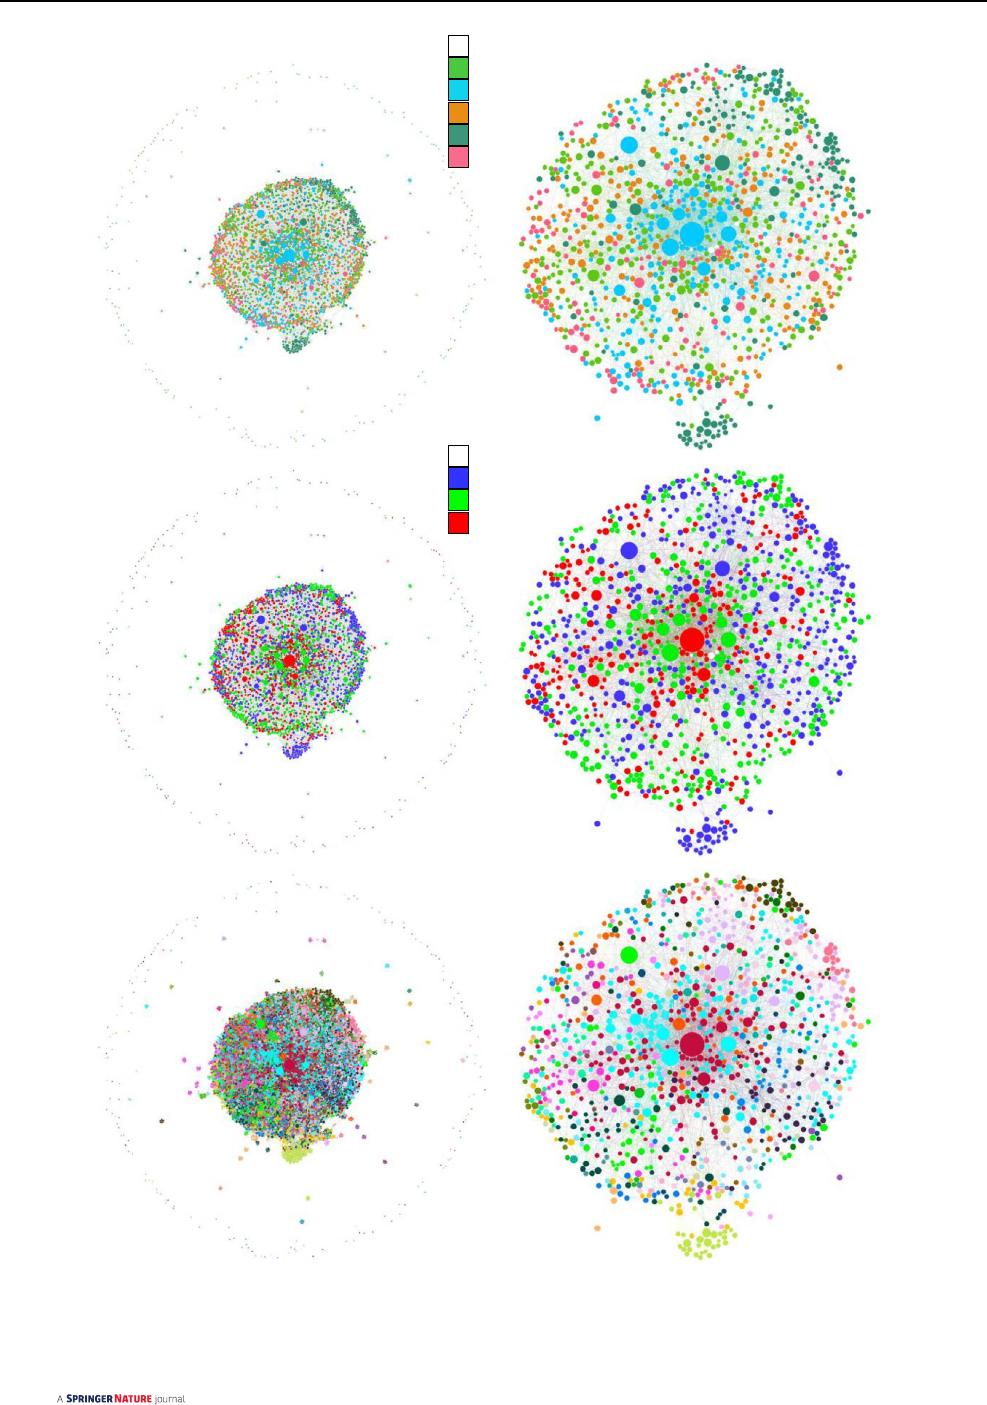
SN Computer Science (2021) 2:4 4 Page 8 of 11
SN Computer Science
A
C
B
Product
Ecoregional
Ext. Collab.
Themac
Southeast
Midwest
Ext. Collab.
South
Northeast
North
Fig. 4 Whole network and giant component for k ≥ 10 partitioned by region (a), unit type (b) and modularity class (c, without legend for 250
classes)

SN Computer Science (2021) 2:4
Page 9 of 11 4
SN Computer Science
does not preferentially aggregate hubs, but decays also as a
power law of k
Γ
, which agrees with 92% of nodes in Γ with
k
Γ
< 20. As a result, the hub-and-spoke pattern guarantees
minimal, but sufficient, network control of the information
flow, limiting the system in the transition between assorta-
tive and disassortative regimes towards the latter. Currently,
the solution γ ~ 2 and µ ≤ 0 found for Embrapa seems driven
by the system self-adaptation to minimize Γ that gathers
about 14% of internal collaborators, principally males (con-
tingence table in Sect.3 of the Appendices).
Scale-free networks lying on γ ~ 2 minimize Γ because
the trivial upper limit of Γ is described by n ~ k
max
, where
k
max
is the highest degree of a network [5]. However, Γ is
minimized for µ < 0 in which hubs are separated and can
independently rule many of low-degree nodes. Alternatively,
low-degree nodes also likely obtain advantages by connect-
ing at least to a single hub [39] for, e.g., paced promotions,
considering the functional stability in the Brazilian public
services.
On the other hand, network control seems useful to focus
on TRL [28] to strengthen collaboration and innovation
with the private sectors [29, 30]. The ability to control the
information flow, however, may bring also implications for
the institutional efforts to boost innovation in open science
based, e.g., on FAIR (findability, accessibility, interoper-
ability, and reuse of digital assets) principles [41]. Conse-
quently, current optimization problems seem associated with
minimal but sufficient organizational changes.
Definitely, more incentives may be necessary to exploit
the potential benefits of multidisciplinary diversity in stim-
ulating more intra-organizational research collaborations
that span disciplinary (and regional) boundaries [40]. For
instance, the current division of Embrapa’s units in three
major types (product, ecoregional and thematic) that favors
competition and isolation could benefit from only one or
two labels aligned to a TRL model—e.g., innovation and
business centers—focused on a few portfolios and mixed or
not with external RD&I associates [26].
An interesting example is the system adopted by the
USDA-ARS, which has physical bases (laboratories) at
universities, working in an integrated manner on specific
research topics [24]. In addition, the programmatic figure of
portfolios is very welcome because it replaces the current
strategy of decentralized units with national missions for
the coordination of large product chains, as well as making
it possible to act on transversal themes in various regions of
the country [27].
In general, organizations have formal and informal
structures. Collaboration is distributed laterally due to
more capacity, transparency and trust, rendered as human
capital [42]. On the other hand, human capital in hierarchi-
cal topologies is asymmetrical and routinely concentrates
between superiors and subordinates [18, 43]. Consequently,
for increasing the pace of innovation, a widespread increase
in human capital ought to be considered throughout the
entire network [42]. Furthermore, an increase in the role
of gatekeeper agents, which is now restricted for analyst
females, may ease the establishment of innovation by bridg-
ing organization’s units.
Lastly, a multidisciplinary organization demanding more
innovation capacity in infodemic societies [3, 4] needs to
seek for new formal and informal rules that optimize degree
and correlation degree distributions toward γ ≥ 2 and µ ≥ 0,
respectively. As communication (network edges) grows, it
seems reasonable to allocate efforts to strengthen the auton-
omy of the nodes [42] instead of increasing the controllabil-
ity of information [44, 45].
Conclusions
The topological study of the scientific collaboration net-
work of Embrapa indicates that nodes degree distribution
is scale free and forms a giant component, whereas nodes
degree correlation suggests a disassortative regime. A hub-
and-spoke topology likely emerges from competition and
minimal but sufficient network control, which may, however,
prevent a required increment in innovation capacity.
Jobs of controller and researcher are twice as many occu-
pied by males, except for the jobs of analysts, who act as
network gatekeepers, as indicated by the measure of close-
ness centrality. Product units show greater affinity to form
clusters than ecoregional or thematic units that, in turn, tend
to concentrate hubs at the inner core of the giant component.
With the largest number of individuals in product units, the
South region tends to develop more collaborative clusters.
Alternatively, hubs located in thematic and ecoregional units
in the Midwest region have greater gravitational force, posi-
tioning themselves at the inner core of the giant component.
Combining the improvement in human capital with the uni-
versalization in the labeling of units can motivate a multi-
disciplinary organization to share knowledge and hasten the
pace of innovation internally and with external associates.
A clear limitation of this work is that it considers only a
snapshot of the current state of scientific collaboration of the
studied organization, and an evolutionary network approach
would bring more insightful information regarding, e.g., the
reasons for reaching the actual topological shape. In any
case, the preliminary deciphering of the current network
topology by network science remains a new contribution,
as, to date, a network study of all of Embrapa’s scientific
collaboration has not been carried out.
Acknowledgements The authors thank to Embrapa for providing open
data that supported this work. The anonymous dataset explored in this
research can be available on request to the corresponding author.

SN Computer Science (2021) 2:4 4 Page 10 of 11
SN Computer Science
Author Contributions Conceptualization: IB; Methodology: IB; For-
mal analysis and investigation: IB; Writing—original draft preparation:
IB; Writing—review and editing: PMS, AHO.
Funding Nothing to declare.
Compliance with Ethical Standards
Conflict of interest The authors are members of the studied organiza-
tion, whose motivation is to find new organizational models that im-
prove the capacity for scientific innovation based on ethical and trans-
parency principles to cope with a digital world with increasing spread
of misinformation and denial.
References
1. Strogatz SH. Exploring complex networks. Nature. 2001;410:268–
76. https ://doi.org/10.1038/35065 725.
2. Newman MEJ. Mixing patterns in networks. Phys Rev E.
2003;67:026126. https ://doi.org/10.1103/PhysR evE.67.02612 6.
3. Vosoughi S, Roy D, Aral S. The spread of true and false
news online. Science. 2018;359(6380):1146–51. https ://doi.
org/10.1126/scien ce.aap95 59.
4. Scheufele DA, Krause NM. Science audiences misinformation and
fake news. Proc Natl Acad Sci. 2019;116(16):7662–9. https ://doi.
org/10.1073/pnas.18058 71115 .
5. Barabási A-L. Network science. 1st ed. Cambridge: Cambridge
University Press; 2016.
6. Watts DJ, Strogatz SH. Collective dynamics of “small-world” net-
works. Nature. 1998;393:440–2. https ://doi.org/10.1038/30918 .
7. Barabási A-L, Albert R. Emergence of scaling in random net-
works. Science. 1999;286:509–12. https ://doi.org/10.1126/scien
ce.286.5439.509.
8. Barabási A-L, Albert R, Jeong H. Mean-field theory for scale-
free random networks. Phys A. 1999;272:173–97. https ://doi.
org/10.1016/S0378 -4371(99)00291 -5.
9. Albert R, Barabási A-L. Statistical mechanics of complex net-
works. Rev Mod Phys. 2002;74:47–97. https ://doi.org/10.1103/
RevMo dPhys .74.47.
10. Newman MEJ. The structure of scientific collaboration networks.
Proc Natl Acad Sci. 2001;98(2):404–9. https ://doi.org/10.1073/
pnas.98.2.404.
11. Aiello W, Chung F, Lu L. A random graph model for massive
graphs. In: STOC ’00 Proceedings of the thirty-second annual
ACM symposium on theory of computing. 2000;171–80. https ://
doi.org/10.1145/33530 5.33532 6
12. Grossman JW, Ion PDF. On a portion of the well-known collabo-
ration graph. Congr Numer. 1995;108:129–31. http://cites eerx.ist.
psu.edu/viewd oc/downl oad?doi=10.1.1.35.4242&rep=rep1&typ
e=pdf.
13. Newman MEJ. Co-authorship networks and patterns of scientific
collaboration. Proc Natl Acad Sci. 2004;101(1):5200–5. https ://
doi.org/10.1073/pnas.03075 45100 .
14. Wang Z, Wang N. Knowledge sharing innovation and firm per-
formance. Expert Syst Appl. 2012;39(10):8899–908. https ://doi.
org/10.1016/j.eswa.2012.02.017.
15. Caseiro N, Coelho A. The influence of business intelligence capac-
ity network learning and innovativeness on startups performance.
J Innov Knowl. 2019;4(3):139–45. https ://doi.org/10.1016/j.
jik.2018.03.009.
16. Axtell RL. Zipf distribution of US firm sizes. Science.
2001;293:1818–20. https ://doi.org/10.1126/scien ce.10620 81.
17. Gaffeo E, Gallegati M, Palestrini A. On the size distribu-
tion of firms: additional evidence from the G7 countries.
Phys A. 2003;324(12):117–23. https ://doi.org/10.1016/S0378
-4371(02)01890 -3.
18. Fix B. Energy hierarchy and the origin of inequality. PLoS ONE.
2019;14(4):e0215692. https ://doi.org/10.1371/journ al.pone.02156
92.
19. Nacher JC, Akutsu T. Dominating scale-free networks with
variable scaling exponent: heterogeneous networks are not dif-
ficult to control. New J Phys. 2012;14:073005. https ://doi.
org/10.1088/1367-2630/14/7/07300 5.
20. Takemoto K, Akutsu T. Analysis of the effect of degree correlation
on the size of minimum dominating sets in complex networks.
PLoS ONE. 2016;11(6):e0157868. https ://doi.org/10.1371/journ
al.pone.01578 68.
21. Rodrigues GS, Campanhola C, Kitamura PC. An environmental
impact assessment system for agricultural RD. Environ Impact
Assess Rev. 2003;23:219–44. https ://doi.org/10.1016/S0195
-9255(02)00097 -5.
22. Embrapa. Brazilian Agriculture: one of the most efficient and sus-
tainable in tropical zones. 2017. http://ainfo .cnpti a.embra pa.br/
digit al/bitst ream/item/16481 5/1/38137 -folde r-suste ntabi lidad
e.pdf. Accessed 15 Oct 2020.
23. Salnikova E, Grunert KG. The role of consumption orientation
in consumer food preferences in emerging markets. J Bus Res.
2020;112:147–59. https ://doi.org/10.1016/j.jbusr es.2020.03.006.
24. Freitas-Filho A, Paez MLDA, Goedert WJ. Strategic planning in
public R&D organizations for agribusiness: Brazil and the United
States of America. Technol Forecast Soc Change. 2002;69(8):833–
47. https ://doi.org/10.1016/S0040 -1625(01)00139 -1.
25. Figueiredo PN. New challenges for public research organisations
in agricultural innovation in developing economies: evidence
from Embrapa in Brazil’s soybean industry. Q Rev Econ Financ.
2016;62:21–32. https ://doi.org/10.1016/j.qref.2016.07.011.
26. Alves AA, Hoffmann A, Nepomuceno AL, Oster AH, Fonseca
CEF, Torres CRB etal. Task force to support structural and func-
tional improvement of Embrapa’s Decentralized Units. In: Internal
Executive Report. Embrapa Brasília-DF. 2018. p. 28.
27. Bittencourt DMC, Campos MM, Euclides-Filho K, Moretti C.
Análise de redes sociais como ferramenta para a gestão da pes-
quisa e desenvolvimento (PD) na Embrapa. In: Desafíos y opor-
tunidades de las Ciencias de la Información y la Documentación
en la era digital: actas del VII Encuentro Ibérico EDICIC 2015
(Madrid 16–17 November 2015). Universidad Complutense de
Madrid, Madrid. https ://eprin ts.ucm.es/34645 /1/293-Matia s_redes
-socia is.pdf.
28. Mankins J. Technology readiness assessments: a retrospec-
tive. Acta Astronaut. 2009;65(9–10):1216–23. https ://doi.
org/10.1016/j.actaa stro.2009.03.058.
29. Capdeville G, Alves AA, Brasil BSAF. Modelo de Inovação e
Negócios da Embrapa Agroenergia: Gestão Estratégica Integrada
de P&D e TT. Documentos 24 Embrapa Brasília-DF, 2017. p.
45. https ://www.embra pa.br/busca -de-publi cacoe s/-/publi cacao
/10853 22/model o-de-inova cao-e-negoc ios-da-embra pa-ag roe
nergi a-gesta o-estra tegic a-integ rada-de-pd-e-tt. Accessed 16 Oct
2020.
30. Embrapa. SEG—Embrapa Management System: manual on the
use of the TRL/MRL scale. 2018. https ://cloud .cnpgc .embra pa.br/
nap/files /2018/08/Escal aTRL-MRL-17Abr 2018.pdf. Accessed 16
Oct 2020.
31. Golbeck J. Analyzing the social web. 1st ed. Amsterdam: Elsevier;
2013.
32. Marsden PV. Measures of network centrality. Int Encycl Soc
Behav Sci. 2015;16:532–9. https ://doi.org/10.1016/B978-0-08-
09708 6-8.43115 -6.
